Project Appraisal at Durgapur Steel Plant
Abstract
This research paper studies the tools and techniques used in
investment appraisal in Steel Authority Of India Limited using
a live modernization project at SAIL “ the rebuilding of coke oven
battery # 4”. It is observed that Investment decisions are
the most important and crucial decisions of the corporate world owing to
the large amount of risk involved. They affect
the value of the firm and thus they need to be critically analyzed both
technically and financially. To investigate the
feasibility of a proposal, project appraisal techniques like Net Present
Value (NPV) method, Internal Rate of Return (IRR)
method and Sensitivity Analysis were employed. The authors opine that the
NPV comes out to be  .296.20
crores (posttax)
and IRR 26.81% and 33.75% for post- tax and pre- tax respectively which
is well above the hurdle rate, hence the
project is feasible and recommended for implementation.
.296.20
crores (posttax)
and IRR 26.81% and 33.75% for post- tax and pre- tax respectively which
is well above the hurdle rate, hence the
project is feasible and recommended for implementation.
Keywords :
- Investment Appraisal,
- Internal Rate of Return,
- Cash Flows,
- Techno-Economics Analysis.
Introduction
Global Steel Industry
The global steel industry employs more than two million
people worldwide, with further two million contractors and
four million people in supporting industries. It is at the
source of employment for more than 50 million people. In
2014, global demand for steel is forecast to grow at about
3.3%. Much of the demand growth is expected to come
from outside of China. Global demand and supply for
steel will be mostly from the developing economy and
also from recovering economies. As urbanization projects
continue, accompanied by a strong domestic economy
and a growing middle class, the demand for steel will
continue to stimulate. It will also shift the product range as
more sophisticated consumer products, such as
automobiles and home appliances, are sought after. This
will benefit steelmakers with high-end, value-added
products (Global steel 2014, Ernst & Young
Publications p.
6). World crude steel production increased from 28.3
mega tonnes (MT) in 1900 to 1,607 MT. in 2013 and
currently stands at 405677 thousand tonnes as on March
2014 (World Steel Association).
Global Supply and Demand
Global steel demand increased by an estimated 3.2% in 2013 as compared
to 2012, largely due to increased
infrastructure and construction activity, especially in
Asia.
China leads from the front, recording 6% growth in 2013
compared to 2.9% in 2012 in the global steel industry.
However, the rest of the world failed to meet expectations
and was lower than as forecasted in 2013. A larger portion
of the demand (+4.9%) came from emerging
economics; North America showed a slight increase in
demand of steel usage (+0.2%), whereas demand in EU
continues to decline for the apparent use of steel (-3.8%).
In 2013, global production of steel increased by 3.5% to
1,607 million tonnes despite low demand growth in most
parts of the world, lead by China, where at least 58 new
furnaces have come online, which increased the annual
capacity by 80 million tonnes. Japan also showed an
increase in steel production by 3.1% to 110.6 million
tonnes. Some countries show decline in the production,
with a 4.4%, 2%, 2% and 1% fall in South Korea, the US,
Europe and Brazil, respectively. Average capacity
utilization in the industry increased from 76.2% during
2012 to 78.1% in 2013 (Global steel 2014, Ernst &
Young
Publications p.4).
Domestic Scenario
India has become the second best in terms of growth
amongst the top ten steel producing countries in the world
and a net exporter of steel during 2013–14. Steel
production in India recorded a growth rate of 4.8 per cent
in February 2014 over February 2013. The cumulative
growth during April–February, 2013–14 stood at 4.2 per
cent over the corresponding period of the previous year
(India Brand Equity Foundation, updated May, 2014)
.
Market Size
India's real consumption of total finished steel grew by 0.6
per cent year-on-year in April–March 2013-14 to 73.93
million tonnes (MT), according to Joint Plant Committee
(JPC), Ministry of Steel. Construction sector accounts for
around 60 per cent of the country's total steel demand
while the automobile industry consumes 15 per cent
(Economic times, online article, March 2014). India
became net steel exporter in 2013–14 and is likely to
maintain the momentum in 2014-15 as producers are
looking to dock more overseas shipment to tide over
subdued domestic consumption. Total steel exports by
India during 2013–14 stood at 5.59 MT, as against imports
of 5.44 MT. (Indian steel industry facts and figures,
retrieved may 8 2014, from http://www.ibef.org/industry/
steel.aspx)
Figure 1 shows the consumption pattern of steel in the
Indian market, as can be seen the largest share is of
infrastructure 63%. Thus we can say that, as the
construction and real estate industry grows in India so will
the steel industry.

Figure 1. Indian Steel Consumption
Road Ahead
Indian steel industry has a bright future. Infrastructure
spending are projected to be increased from 5 per cent
to 10 per cent in 2017 and the country has a plan of
investing around US$ 1 lakh crore in infrastructure in its 12th five-year
plan. (Data Retrieved from working group report
on Indian steel industry, retrieved may 8 2014, from
http://planningcommission.gov.in/aboutus/committee/w
rkgrp12/wg_steel2212.pdf)
1. Objectives Methodology and Review of Literature
1.1Objective of the Study
Investment planning is a long term exercise and involves a
huge amount of time and money. It therefore involves
careful analysis of the proposal. SAIL (Steel Authority Of
India Limited) has specified procedures for such
modernization and replacement proposals and their
approval. Some of the objectives of the study are as
follows:
- To study the financial performance of Steel Authority
of India, its growth and profitability in the recent years.
- To study and understand the process of investment
appraisal at a big government undertaking with Steel
Authority of India as the platform.
- To learn and understand the tools and techniques
used in capital budgeting like NPV (Net Present Value
method) and IRR (Internal Rate of Return method),
Cost Benefit Analysis and Sensitivity Analysis.
1.2 Methodology
The study is mainly based on secondary data. In order to
study the global steel industry, the data is collected from
world steel association's website and for the domestic
steel industry, data from various sources like Ministry of
Steel publications is amassed. The company data is taken
from company's annual reports and official website. To
study the process of investment appraisal, details for the
same is studied from the company’s appraisal books and
for financial analysis part, a live project was studied and
the project was appraised with techniques like Net Present
Value method, Internal Rate of Return method, Gross
margin calculation and sensitivity analysis.
1.3 Literature Review
Singh Shveta, Jain P.K., Yadav Surendra S., Department of
Management Studies, Indian Institute of Technology
Delhi, New Delhi, India (2012) have studied “Capital
budgeting decisions: Evidence from India” for 10 years from 2001 to
2011. The authors found that, trends towards
sophisticated techniques and sound capital budgeting
decisions have continued in India. All sample respondent
firms used Discounted Cash Flow (DCF) techniques in
conjunction with non-DCF techniques. Internal Rate of
Return (IRR), used by more than three quarters of the
sample companies, is favoured over Net Present Value
(NPV), used by half of the sample companies. Real
options are used by half of the sample companies.
Permanent (long-term) capital has been used to finance
fixed assets (net) and working capital (net).
The authors highlight that, Capital budgeting practices in
India appear to have improved over the past decade or
so with an increasing number of companies using more
sophisticated DCF techniques. To assess risk, sensitivity
analysis is perceived to be the most important technique.
It is a matter of gratification to note that all the respondent
sample companies used DCF techniques in conjunction
with non-DCF techniques. There was a strong preference
for DCF with 50 per cent using NPV and 78.57 per cent
using IRR. The results also indicated that firms still relied on
simple capital budgeting techniques such as the
payback period and the ARR. Despite the
recommendations of the financial literature on using NPV
as the primary technique, this research too found that
respondent firms indicated a preference for IRR
compared to NPV. (Journal Retrieved May 13 2014, from
http://www.emeraldinsight.com/journals.htm?articleid=1
7035911)
Cooper William D., Morgan Robert G., Regman Alonzo,
Smith Margart (2001) have done a study to assess the
current level of capital budgeting sophistication in
Corporate America. A survey questionnaire was sent to
the CFOs of the Fortune 500 companies. They received
response from 113 companies having a response rate of
23%. As per the results of their study, the most commonly
used primary capital budgeting evaluation technique is
the IRR (57%). The second most popular technique is the
PBP (20%). The most popular backup technique is the PBP
(23%), which is slightly more popular than the IRR and the
NPV (21%). Many firms use a team approach to evaluate
capital projects. The largest number of their respondents believe that
project definition and cash flow estimation is
the most important and difficult stage of the capital
budgeting process. Majority of the firms used cut-off rate
between 10% and 15%. The most popular method of
handling risk in the capital budgeting process identified
by 33% of the respondents was to increase the required
rate of return of cost of capital.
Venkatesan T., Dr. Nagarajan S. K. (2012) had done a study
on the topic titled “An empirical study of profitability
analysis of selected steel companies in India” founded
that, profitability more or less depends upon better
utilization of resources, cut-off expenses and quality of
management function in the products, customer services
and to manpower and goodwill and market share. It is
worthwhile to increase production capacity and use
advance technology to cut down cost of production and
wage cost in order to increase profitability, not only
against the investment, but also for the investor's return
point of view. These programs are helpful to increase the
profitability of selected steel companies in India in future
prospects. If the management or government does not
look into it seriously, it can result in loss of jobs and the
company will become a sick unit. And founded in
numerical statement, the correlation of SAIL to Tata (0.56)
of NP and SAIL to Tata 0.64 of OP ratio was positive. It shows
that they maintained similar level in NP and OP ratio and
negative correlation was observed among bhushan to jsw (-0.12) of NP
ratio and bhushan to jsw of (-0.394) OP
ratio. Conclude by “t” test, there is no correlation among
SAIL to Tata and bhushan to jsw of NP ratio and SAIL to Tata
and sail to Tata and bhushan to jsw of OP ratio and in
ANOVA test, there is no significant difference in the ROI of
SAIL, Tata, bhushan, visa, & jsw.
1.4 Limitation
- Industry norms are defined.
- Full disclosure of the company information is not
allowed.
- Manufacturing expenses for the modernization of
battery are calculated by Engineers.
- Approval time is 30 months Therefore, it takes a long
time to pass on from one stage to another, thus appraisal may be
effected by macro forces.
2. Steel Authority of India Limited (SAIL)
Started with the name of Hindustan Steel Private Limited
set up on January 19, 1954, Steel Authority of India Limited
has grown immensely. The Government of India owns
about 80% of SAIL's equity and retains voting control of the
Company. However, SAIL, by virtue of its 'Maharatna'
status, enjoys significant operational and financial
autonomy. SAIL is India's largest steel producing
company, with a turnover of `. 49,350 crore. SAIL has five
integrated steel plants, three special plants, and one
subsidiary in different parts of the country. It holds a handsome
2nd position in the Indian steel industry and a
decent 24th position in the global arena. (Retrieved
April
10 2014, from http://sail.co.in/aboutus.php?tag=
company-aboutus)
2.1 Financial Highlights
SAIL achieved the saleable steel production of 12.385
Million Tonnes (MT) during the financial year 2012-13. The
profit after tax of Rs. 2170 crore was lower by Rs. 1373 crore
over the last year (Rs.3543 crore).
Table 1 shows the comparison between the financial
performance of 2012-13 and 2011-12 as it can be seen
that the company achieved a turnover of Rs. 49,350 crore
during the Financial Year 2012-13, which was almost at
the same level as that of last year (. 50348 crore). The
profit after tax of the Company for the Financial Year 2012-
13 was . 2170.35 crore
compared to . 3542.72 crore in
the previous Financial Year. Net profit was down largely
due to the lower Net Sales Realization resulting from a
subdued market. Higher usage of external inputs like BF
Coke & pellets and higher salary & wages were other key
factors impacting profitability adversely. The debt equity
ratio of the Company was 0.53:1 as on 31st March, 2013
as against 0.41:1 as on 31st March, 2012 which went up
on account of increase in borrowings during the year to
fund the ongoing capital expenditure. The net worth of the
Company improved from . 39,811
crore as on 31st
March, 2012 to . 41,025 crore
as on 31st March, 2013.
The Company paid interim dividend at 16% of the paidup
equity share capital during the year. The Board of Directors have further
recommended a final dividend at
4%, subject to approval of shareholders, thus making the
total dividend at 20% of the paid up equity share capital
for the Financial Year 2012-13. A sum of Rs. 163 crore has
been transferred to the general reserves during the
Financial Year 2012-13 (Steel Authority Of India Limited,
annual report 2013 p.6).
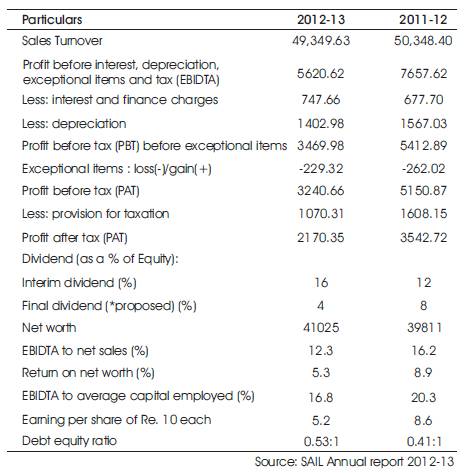
Table 1. Comparative performance sheet
for the year 2012-13 and 2011-12
3. Investment Appraisal at Steel Authority of India Limited
3.1 Procedure of Investment Appraisal at SAIL
At SAIL, regular capital investments are necessary for
maintaining health of the plants and to face
technological obsolescence. Since such investment
decisions are quite critical owing to the risks involved, they
need to be critically analyzed both technically and
financially. SAIL has an effective investment appraisal
process which is mandatory for any investment decision
to pass through before it gets approved for execution.
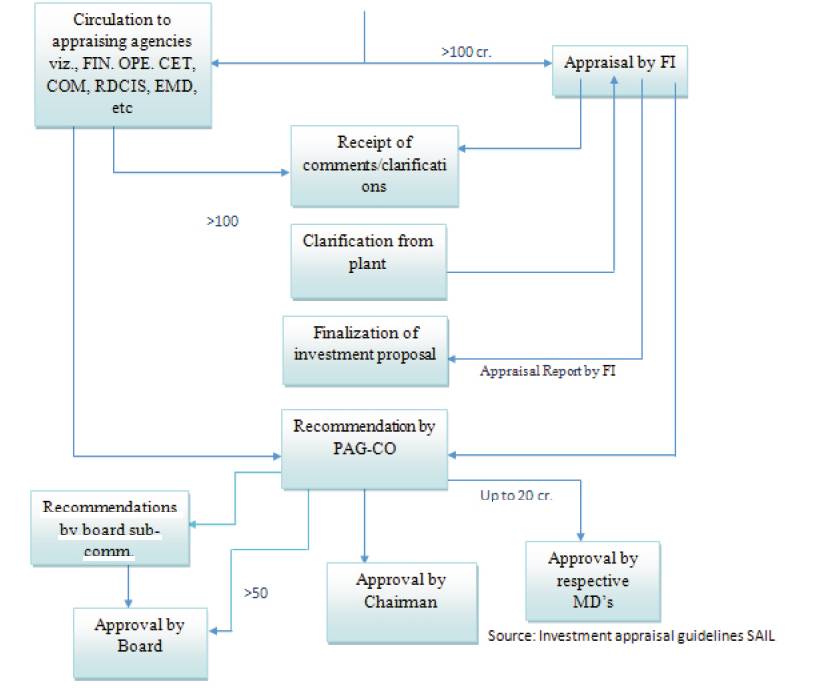
3.1.1 Appraisal Process Flow
Figure 2 shows the appraisal process at SAIL, where the
plan starts, how it flows through various departments,
and who approves it. (Retrieved on April 10, 2014
Guidelines for Formulation of Investment Proposals for
Appraisal, SAIL)
3.1.2 Present Delegating Powers
Table 2 shows the present delegation of powers for
sanction of investment proposals for SAIL plants/units,
including Enabling /Auxiliary Package sunder
Modernization & Expansion Plan of SAIL, as approved by
SAIL Board in its 359th meeting held on 17.03.10.
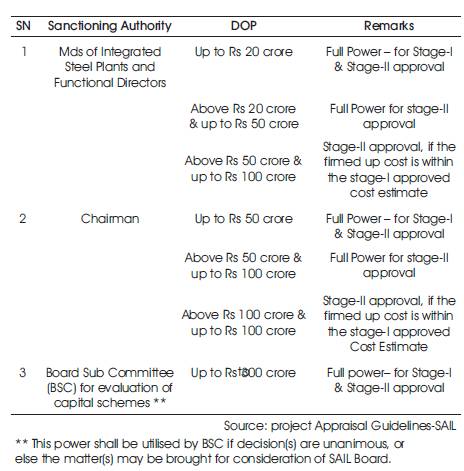
Table 2. Delegation Power for Sanction of Investment
Proposal
3.1.3 Time Schedule for Appraisal of Proposals
Table 3 outlines a time schedule for scrutiny, appraisal and
sanction of Investment Proposals from the date of its
submission by Plants / Units to Projects Directorate.
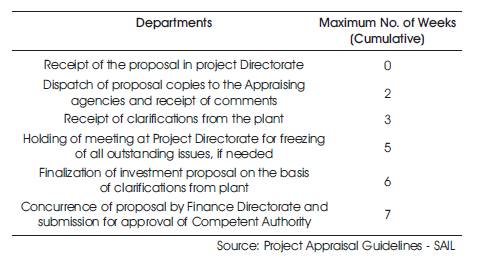
Table 3. Time Schedule for Appraisal
If the Proposal is required to be appraised by an
Independent Institution, then the activity will commence
in Week 1 and will get complete by Week 5. This activity will
be carried out in parallel with above listed activity.
3.1.4 Procedure of Financial Appraisal at SAIL
At SAIL, regular capital investments are necessary for maintaining
health of the plants and to face
technological obsolescence. Since such investment
decisions are quite critical owing to the risks involved, they
need to be analyzed financially. SAIL has an effective
financial appraisal process which is mandatory for any
investment decision to go through.
Once the investment proposal is received by the finance
department for financial appraisal to assess the
investment viability, it is assessed through the following
step-by-step method :-
3.1.4.1 Capital Cost
The Capital Cost of the Project should be based on
Budgetary Quotation / Engineering Estimate. Basis of
Capital Cost should include FE parity, base date, taxes &
duties and Interest During Construction (IDC). The Capital
Cost should be indicated on net of CENVAT basis indicating the CENVAT
amount specially.
3.1.4.2 Financing & Financial Closure
The Project shall be financed through the following
- Equity / Internal Resources
- Loans from …. @.. p.a.
Ratio of Loan to Equity and the Interest Rate on the loan
portion are to be considered based on the guidelines
issued from time to time.
3.1.4.3 Phasing Of Capital Expenditure
The phasing of Capital Expenditure should be estimated
according to the Bar-Chart for Project implementation for
each of the Project activity. Based on the construction
schedule and the financing pattern, the Interest During Construction
(IDC) should be calculated.
Table 4 shows the format for phasing of expenditure
including Interest During Construction (IDC).

Table 4. Phasing of Expenditure Including IDC -
Format
3.1.5 Benefits Envisaged
The benefits envisaged for the selected alternative should
be clearly brought out in quantitative as well as qualitative
terms. While working out the benefits, selling price of the
product along with the Net Sales Realization and the
quantities with quality / size that the market can absorb
should be vetted by Central Marketing Organisation only
for New Products in writing which shall form a part of the
Proposal. Concession benefits include Section 80 I (A),
and all other assumptions for calculating benefits.
3.1.6 Techno-Economics Analysis
The Techno-economics should be done on realistic basis
and should be calculated based on:
- Considering Technical Parameters of previous year if
the Investment Proposal (IP) is prepared during the
period April-September and considering technical
parameters of first Half Year (H1), if FR/ IP is prepared
during the period October-March.
- Standard Cost for the current year should be
considered for working out the Production Cost/
Manufacturing Cost/ Additional Expenditure.
- Simple average of Net Sales Realization (NSR) of last 3
years as per CMO price circulars OR as supplied by
the Plants or current NSR whichever is lower.
- Salvage/ Residual value of the Project should be
considered at 5% at the end of economic life of
Project.
- In the Cash Flow Statement, Depreciation, in general,
to be calculated on WDV basis and Capital Cost on
net of CENVAT basis for green field/brown field units of SAIL.
However, in case of Projects executed under new
Joint Venture and Projects with 80 I benefits
Depreciation under straight line method also needs to
be calculated to arrive at Book Profit to determine
applicability of MAT (Minimum Alternate Tax) flows in
the Cash Flow Statement.
- CENVAT Benefit should be considered while
calculating the Techno-Economics.
Table 5 outlines the financial indices that should be given
along with the proposal.
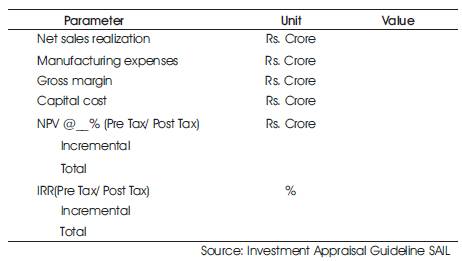
Table 5. Financial Indices
3.1.7 Sensitivity Analysis
Sensitivity of Financial Indices for selected parameters
should be indicated which are given in Table 6.
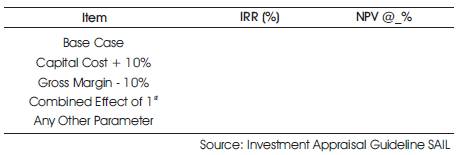
Table 6. Sensitivity Analysis - Format
4. Analysis of a Live Project
Durgapur Steel Plant (DSP) has embarked upon expansion
plan to achieve hot metal production of 3.3 MT p.a. in
2016-17. To take care of the hot metal production, Battery
No. 2 is being rebuilt which is scheduled for
commissioning in November 2012. Battery No.4 is the
oldest battery which is more than 24 years old followed by
Battery No.1 which is more than 20 years old. Next in line
for rebuilding is Battery No.3 which is also more than 15
years old. Bunching of rebuilding is foreseen if timely
action for rebuilding is not taken. This will lead to coke
shortages in future. To meet the future demand of BF coke,
DSP gave an assignment to CET (Civil Engineering
Technician) for rebuilding of Coke Oven Battery No. 4.
As per present Repair/Rebuilding plan, Battery No.5 will be
taken up for construction first followed by rebuilding of
Battery No.4, which will be taken up for rebuilding after
Battery No.2 is commissioned. With commissioning of Battery No.5, Battery
No.1 will be taken down for
rebuilding. With rebuilding of Battery No.4, DSP will have
three healthy batteries with pollution control facilities in
operation i.e. Batteries Nos. 2, 4 & 5 which will also avoid
bunching of rebuilding of batteries. Therefore, immediate
action for rebuilding of Battery No.4 is being taken for
obtaining approval of SAIL Board Sub-Committee. (Data
retrieved from http://www.sail.co.in/pnu.php?tag=
durgapur)
4.1 Financial Analysis of the Proposal
4.1.1 Capital Cost Estimates
The capital cost of the project “Rebuilding of Coke Oven
Battery # 4, DSP” is estimated at .304.87 crore net of
CENVAT of . 25.39 crore
including IDC of .18.76 crore.
There is no FE component in it.
4.1.2 Mode of Financing
The total capital requirement of the project is proposed to
be provided from debt equity in the ratio of 1:1 with an
interest rate @ 11% per annum on loan.
The total capital required for the project is 330.26 which
includes plant cost of 311.50 and IDC of 18.76, out of
which 50%, that is 155.75, will be financed by equity and
the rest 155.75 from market loan at 11%.
Debt-equity ratio = 1:1, which is said to be a good
measure as it shows a balance between debt and equity.
4.1.3 Cost-Benefit Analysis
Gross margin calculation for the project is based on the assumption
that, in case the Coke Oven Battery is not
rebuilt, the entire requirement of coke (456887t) would
be met from purchased coke. Considering DSP average
price of purchased coke at .23,300/t, savings on
account of purchased coke works out to be Rs. 1064.55
crore per annum. Other operational benefits in the form
of Coke Oven Gas as well as other by products have also been considered.
The total benefit on account of rebuilt
battery works out to be Rs. 1194.37 crore per annum.
Production cost of equivalent coke considering at
Rs.24,046/t (Standard cost 2011-12 H-1, DSP) works out
to be Rs.1089.03 crore per annum. Based on the above,
Gross Margin works out to be Rs.104.78 crore per
annum.
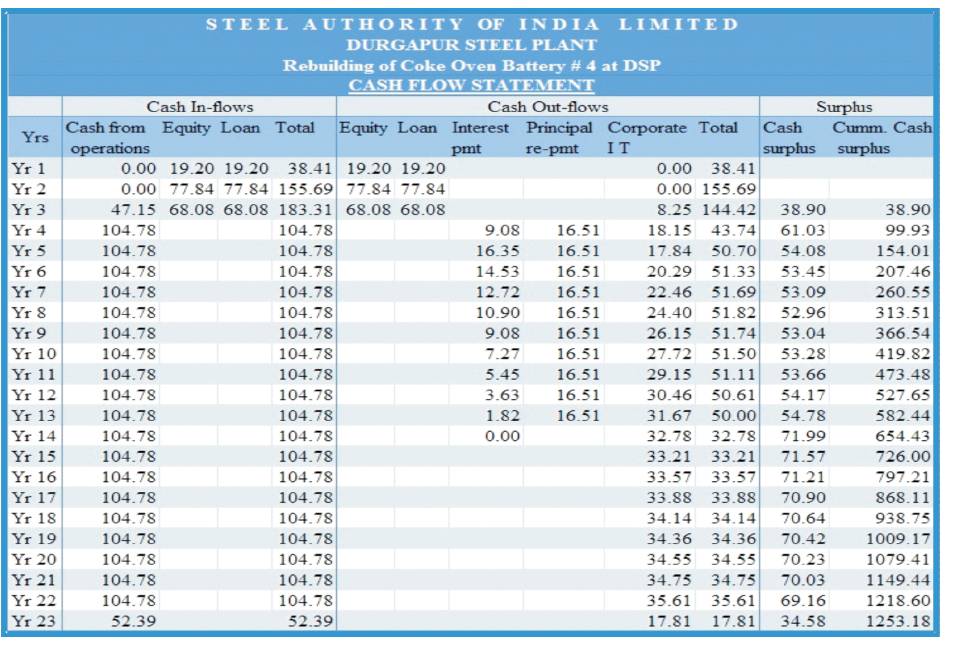
4.1.4 Cash Flow Statement
Cash flow analysis is simply the process of identifying the
categories of cash flows associated with a project or
proposed course of action, and making estimates of their
values.
In the research work, cash flow has been calculated for
the period of 20 years.
Table 7 summarises the cash flow statement of the project
and this shows that the project will generate surplus cash
for almost all the years expect the first 2 beginning years of the life
of the project.
4.1.5 NPV and IRR of the Proposal
Table 8 shows the Net Present Value (NPV) and Internal
Rate of Return (IRR) for both pre-tax and post-tax of the
proposal. The proposal, as can be seen, is a clear go for
the financial part as NPV is very high and the IRR is well
above the hurdle rate.
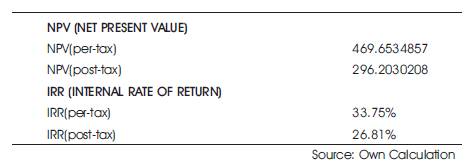
Table 8. NPV & IRR
4.2 Sensitivity Analysis
Sensitivity analysis involves evaluating proposals over a
range of assumptions about key factors (e.g. prices, costs,
interest rates on any borrowed funds). If an option yields
acceptable results only with particular combinations of
circumstances, and the results are very sensitive to
variations in these circumstances, then it should probably
not be undertaken. If the relative merits of options change
with variations in the assumed values of variables, those
values should be examined to see whether they can be made more
reliable.
The following factors have been taken into account for
measuring the sensitivity of the profitability of the project:
- Increase in Capital Cost by 10 percent;
- Fall in Operating Margin by 10 percent;
- Combined Effect of above two factors;
- Debt Equity ratio changes to 1:1 from 3:2;
- Project is all Debt Financed;
- Project is all Equity Financed
Table 9 shows the effect of various changes on the NPV
and IRR of the proposal and as can be seen, none of the
alternates have an adverse effect on the proposal. Thus,
we can say the proposal is not at all sensitive.
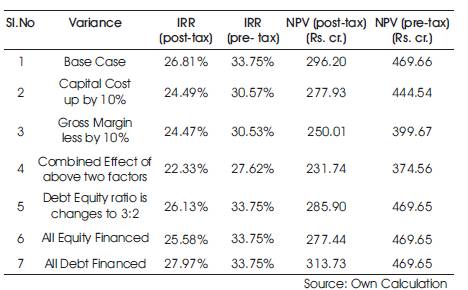
Table 9. Sensitivity Analyses
5. Analysis and Interpretation
- If the Capital Cost increases by 10% (due to any
reason like increase in the cost of equipment or
structure etc.) then both NPV and IRR decreases, but
IRR is still greater than 10% and NPV is still positive. Thus,
the project, though sensitive to the increase in Capital
Cost, is still acceptable.
- If the gross margin decreases by 10% (due to any
reason like increase in the cost of production), then
both NPV and IRR decreases, but are still within the
acceptable range and the proposal can be
accepted.
- The combined effect of increase in capital cost by
10% and decrease in gross margin by 10%, yields
greater decrease in NPV and IRR values, but still
doesn't produce a significant change in NPV and IRR
values.
- If the debt-equity mix is changed from 1:1 to3:2, the
NPV and IRR values do not change significantly and
the proposal is still acceptable.
- As the leverage decreases, the post tax IRR and NPV
values decreases, thus giving lower returns. Hence,
the project should not be 100% equity financed.
- As the leverage increases, the post tax IRR and NPV
values increase due to tax deductibility of interest
cost thus giving higher returns.
6. Findings and Recommendations
Steel Authority of India (SAIL) is a very well established
company and holds a strong position in the industry. The
financial position of SAIL is very strong. It had turnover of
49,350 crores in the last financial year. Though it has seen
a continuous decline in its profits, but they are only due to
the various expansion and modernization plans taken up
by the company. Findings made during the appraisal of
the givenproject “Rebuilding of Coke Oven Battery # 4 at
Durgapur Steel Plant” are as follows:
- Plant cost estimation is 330.26 cr. including Interest
During Construction (IDC) of Rs. 18.76 cr., which is
calculated by taking care of all the necessary
equipments and tools required.
- Gross margin is found out to be Rs.104.78 crs.
- Phasing of expenditure is considered in three years
which is divided in a certain ratio of 12%, 48%, 30%
and 10% respectively. (10% is considered for the post
commission)
- Cenvat credit is considered to be Rs. 25.39 cr.
- NPV and IRR both satisfy their acceptance criteria,
hence the proposal is acceptable.
- The project is not very sensitive to environmental changes.
Conclusion
Steel Authority of India (SAIL) is a well established
company and is a very strong pillar of the Indian
economy. SAIL has a bright future ahead, as both the
Global and Domestic Steel Industry have shown signs of
high growth in future and the market promised a rise in
the demand for steel.
SAIL achieved a turnover of Rs.49,350 crore during the
Financial Year 2012-13 and the profit after tax was
Rs.2170.35 crore compared to Rs. 3542.72 crore in the
previous Financial Year. Net profit was down largely due
to many modernization projects going throughout the
company and higher usage of external inputs like BF
Coke & pellets are other key factors impacting
profitability.
Having analyzed the project dynamics in details and
keeping in view the technical/ technological/
commercial parameters assumed by Durgapur Steel
Plant, SAIL, it is clear that SAIL follows a well developed
procedure for investment appraisal. It has predefined
rules and procedure for handing various parameters and
the process follows a set of series of steps.
Recommendation
- Steel Authority of India (SAIL) can even rise to new
heights if it adopts new and latest technology and
exploits the export market by increasing its operations
in the global market.
- During the financial analysis of investment plan, some
grey areas have been encountered. It is seen that,
while estimating the gross margin and capital costs,
current prices are used and there is no provision for
any escalation in prices of the raw material or capital
costs. In the light of an inflation prone country like
India, this can be a major setback on profitability in
later years of operation. Hence for a more pragmatic
estimation, it is recommended that the effect of
inflation be accounted on the prices by applying
appropriate models.
References
[1]. About Durgapur Steel Plant, April 12 2014, Retrieved
from Steel Authority of India ltd . Website
:http://www.sail.co.in/pnu.php?tag=durgapur
[2]. SAIL's Company Details, April 10 2014, Retrieved
from
Steel Authority of India ltd.Website:
http://sail.co.in/aboutus.php?tag=company-aboutus
[3]. SAIL, Guidelines for Formulation of Investment
Proposals for Appraisal, SAIL
[4]. Indian steel industry facts and figures, May 8 2014,
Retrieved from India Brand Equity Foundation, Website:
http://www.ibef.org/industry/steel.aspx
[5]. Data from working group report on Indian steel
industry, May 8 2014, retrieved from Report of the working
group on steel industry for the twelfth five year plan (2012 –
2017)Website:http://planningcommission.gov.in/aboutus
/committee/wrkgrp12/wg_steel2212.pdf
[6]. Global steel industry report, (2014). Retrieved from
Global Steel 2014, Planning To Profit From Opportunity:
Preparing For Future Demand ,Website:
http:// www.ey.com / Publication /vw LUAs sets / EY _-
_Global_steel_2014/$FILE/EY-Global-steel-2014.pdf
[7]. Global steel data and facts, (2014). retrieved from
World Steel Association Website :
http://www.worldsteel.org/
[8]. Pandey I.M., (2011). Financial Management 10th
edition (Vikas Publishing House Reprint 2011), Chapter No.
8, In text reference: Project Appraisal Techniques.
[9]. Pamela P. Peterson, Frank J. Fabozzi, (2002). Capital
Budgeting: Theory and Practice volume 10 (Wiley, 2002),
in text reference : Capital Budgeting.
[10]. Pandey I.M., (2011). Financial Management 10th
edition (Vikas Publishing House) Reprint 2011, In text
reference: Sensitivity Analysis.
[11]. SAIL's Directors, (6th August 2012). SAIL's
Annual
Report 2011-12, and SAIL's Directors, 22nd July 2013, SAIL's
Annual Report 2012-13, retrieved May 11 2014, from
Website: http://sail.co.in/financial-list/103.
[12]. Singh Shveta, Jain P.K., Yadav Surendra S., (2014).
Department of Management Studies, Indian Institute of
Technology Delhi, New Delhi, India (2012), Capital
Budgeting Techniques, (publisher: Emerald Group Publishing Limited )
retrieved May 132014,
http://www.emeraldinsight.com/journals.htm?articleid=1
7035911