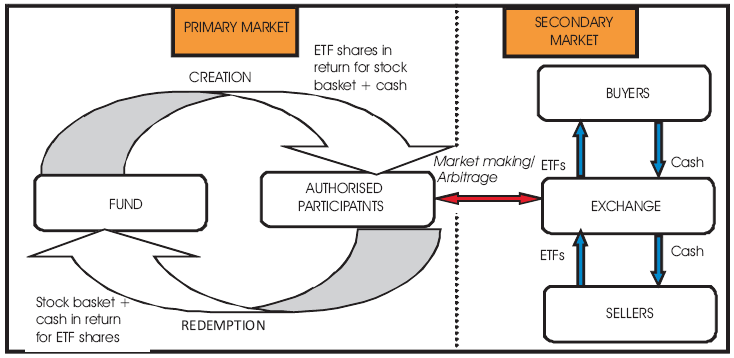
Figure 1. How ETFs work
The paper examines mechanism of functioning of Exchange Traded Funds (ETFs) and its growth in India. It also includes identification of potential new ETFs which can be launched to cater the need of Indian investor to effectively diversify their portfolios at minimal cost. To analyze performance characteristics of ETFs and their comparison with Index Mutual Funds, a sample of 6 ETFs tracking different indices and 5 Index Mutual funds tracking the same S&P CNX Nifty Index, was studies based on past 3 years daily data. Performance characteristic like tracking error was calculated by three methods. Average percentage yearly return was also calculated. Findings and conclusions show that ETFs are better in tracking their respective benchmarks as compared to Index Mutual Funds.
An ETF is usually made up of a fixed list of securities or commodities, with changes made to the list only in special circumstances. It trades on the exchange just like any other share. Main difference between ETF and mutual fund is trading pattern. ETFs trade continually on exchange but mutual funds are traded at the end of the day (Kothari & Warner, n.d).
To pick a winning script out of thousands trading on the stock exchange is a challenging task for any investor. Individual stocks and bonds go up and down, often rapidly and unpredictably. Commodities trading require expert knowledge and continuous monitoring. So what investors can do to minimize the risk associated with particular stock? The answer is that investor can spread the risk across different securities, which is known as diversification of portfolio (Gupta, A, 2002). But how a retail investor can buy large number of securities as there is transaction cost associated with it. So mutual funds come to rescue. They allow the investor to buy units of mutual fund from an asset management company, which collects the money from many investors and invest it in large number of securities in the market. But mutual funds come with high costs-management fees, transactions costs and unnecessary taxes-that minimize the overall profit of an investor. Also there is another limitation that mutual fund do not allow to invest in commodities like oil or gold. In mid 1993, Wall Street developed a way for investors to diversify their holdings into stocks, bonds, and commodities, in low cost, tax efficient manner, with the creation of the Exchange Traded Fund (ETF) (Fredman & Wiles, 2003).
Only Authorized Participants (APs), typically large institutional investors who have an agreement with the fund sponsor, are allowed to create new shares, in blocks of specified minimal amounts called creation units. Creation units vary in size from one fund to another, ranging from 2000 up to 10000 shares [Deville, 2008]. Most ETFs have creation units of 10000 shares, which represent an amount 100 times the dollar value of the index underlying the ETF. APs deposit the corresponding pre-specified stock basket plus an amount of cash into the fund and receive the corresponding number of shares in return. Consequently, ongoing shareholders do not bear the cost of the entry (or exit) of new shareholders.
Shares are not individually redeemable. Investors can ask for redemption only by tendering to the trust shares in creation units. Typically, the operation is done “in-kind”. Redeemers are offered the portfolio of stocks that make up the underlying index plus a cash amount in return for creation units. The number of outstanding shares tradable on the secondary market varies over time according to creation and redemption operations carried out on the primary market. The cash component is equal to the difference between the NAV and the value of the stock basket. It accounts for the dividends cumulated by the funds, the management fees and adjustments due to rounding (Haslem, 2003). Both institutional and individual investors can buy and sell shares in the secondary market like ordinary stocks at any time during the trading day. As such, there is no fee payable for secondary market purchases or sales, but secondary market transactions are subject to regular brokerage commissions (Gupta et.al 2009).
Figure 1. How ETFs work
This research is based on both Primary and Secondary data analysis. The following sections detail the steps and approaches employed to achieve the above objectives.
Whole research project has been divided into 5 stages.
Stage 1: All the available literature related to Exchange Traded Funds (ETFs), Index Mutual Funds, Sector Mutual Funds, Diversified Mutual Funds and Investor attitude towards mutual funds is thoroughly studied.
Stage 2: Gained the in depth knowledge of all the concepts related to ETFs, its evolution in world and India, types of ETFs, governing regulations, functioning in exchange, creation and redemption of ETF units in primary and secondary market, taxes and other cost implications, advantages and disadvantages as compared to Index Mutual Funds. Also study was expanded to assess the potential areas for introduction of new ETFs.
Stage 3: Calculation of Performance Characteristics of ETFs
The first variable the author estimate is the risk of ETFs and corresponding indexes in daily return percentage terms. Same is done for Index Mutual Funds also. The author compute return using the following equation: [Rompotis,2008]
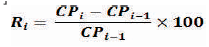
| Where | Ri – Percentage return on i-th day |
| CPi – Closing price on day i-th day for ETF, Index or Index Mutual Fund |
In the next step the author calculate risk of ETFs, Benchmark Index and Index Mutual Funds. Risk is measured as standard deviation of return around the average return.
It can be calculated using following equation:
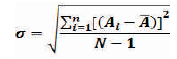
Where σ denotes the percentage risk of portfolio in terms of standard deviation.
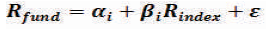
In this section, The author perform a simple regression in order to determine the systematic risk to which ETFs and Index Funds are exposed. Also through regression model he confirm extent of replication strategy of Index funds.
Single variable regression model is represented by following equation:
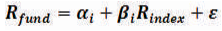
| Where: | Rfund indicates the return of the ETF or Index fund |
| Rindex Indicates the return of the corresponding index |
αi and βi are regression coefficients and ε is the residual error.
In this regression, the 'α' coefficient stands for the return an ETF or Index fund can have above the return that relates to the index portfolio. However, since ETFs and Index Funds pursue a passive investment strategy, 'α' estimations are not expected to be statistically significant. The 'β' coefficient in equation (2) is an estimate for the systematic risk to which an ETFs and Index funds are exposed and reflects the aggressiveness of management strategy. 'β' estimations are also considered as an indicator of ETFs replication strategy. A 'β' of unity suggests a full replication strategy whereby the ETF invests to all components of the tracking index in the same weights. In contrast, a 'β' which differs from unity represents a departure from a full replication strategy.
In reality, although no indexing strategy can perfectly match the performance of an index or benchmark, the tracking error can quantify the degree to which the strategy differed from the index or benchmark which reflects the divergence among the performance of ETFs and indexes. This study measure the tracking error with 3 most commonly used methods.
First Method (TE1) is very straight forward is defined as the standard error of regression calculated using equation 2.
Second method one computes the standard deviation of return differences between ETFs and indexes. The tracking error estimation is formed in following equation:
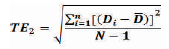
| Where | Di is the difference in returns on i-th day between Index returns and ETF/Ind. Fund returns. |
 is the average of difference in returns over period 'n’ is the average of difference in returns over period 'n’ |
Third method to compute tracking error is the average of absolute difference between returns of Index and Returns of ETF or Index Mutual Funds. Third method r uses the following equation:
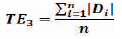
| Where | |Di| is the absolute difference between returns of Index and returns of ETF (or Index MF) |
| n- is the total no. of observation data points. |
In the next step yearly returns of Nifty BeES ETF have been compared with randomly selected Index Mutual Funds which are also tracking the same index.
Sample Size for comparison of ETFs and Index Mutual Funds in Stage 3:
Secondary data for ETF stock prices and NAV of Index mutual funds have been collected on daily basis over 3 year's time horizon, from 1st April 2007 to 31st March 2010, for research. In India there are only 3 Equity ETFs which are listed for more than 3 years. So ETFs less than 3 year time horizon were also considered for research in order to cover sufficient representative sample.
The Research has been done for ETF's and findings cannot be generalized for whole stock market.
Reference period of Study is limited to past 3 years data, results may differ if more number of year's data is considered for research.
The researcher relied completely on the secondary information freely available on internet or other sources, so 100% accuracy of data is not guaranteed. Statistical tools and Regression Analysis has been conducted on past data, which do not predict the future trends fully. The representativeness of the study sample is limited to the Hyderabad region and Friend Circle only so it may not represent the whole population. Since the survey is to be conducted exclusively on individual's investment behavior, there is ample scope of personal bias creeping in.
Research on Exchange Traded Funds (ETFs) in this project is significant for LKP Shares as they can prove to investors who follow passive management strategy that ETFs are better that Index Mutual Funds. This can prompt investors to do transactions in ETFs through LKP Shares broking services. This in turn will increase the brokerage and other services revenue for LKP Shares.
Research on Sector Mutual Funds and Diversified Mutual Funds can guide common mutual fund investor that there is a higher risk involved in Sector MFs as compared to Diversified MFs. So investors can choose the right investment instrument depending upon their risk appetite and returns desired.
Research on Investor's Fund Selection behavior (through Factor Analysis) can assist Asset Management Company (AMC) to design new mutual fund schemes and their advertising strategy. It can also help AMC to come up with areas of potential improvement where if improvement made can actually make maximum impact on investor's fund selection behavior
Mustafa Mesut Kayali (2007) This study investigates the pricing efficiency of the Dow Jones Istanbul 20 (DJIST), on the Istanbul Stock Exchange and following the performance of the Dow Jones Turkey Titans 20 Index since January 14, 2005. First, he run the following regression to see whether there is a close pricing relationship between the two price series or not, and to see whether the DJIST trades at a premium or discount, on average: PRICEt = + NAVt . The high coefficient of NAVt, which is very close to unity, and the high correlation between the daily net asset value and closing price of the DJIST verifies the close pricing relationship between the respective price series. That is, they move in tandem with each other. Next he computed the TRY premium/discount as the difference between the closing price and the net asset value of the DJIST on day t by the following formula: PREMDISCt = (PRICEt - NAVt). The t-test results show that the average TRY premium/discount of -0.0080 has a t-value of -6.305 and is statistically and significantly different from zero at the 1 percent level. The average premiums and discounts are also significant at the 1 percent level. This finding indicated a possible arbitrage opportunity. In order to investigate whether the premiums and discounts persist over time or not, he conducted a regression analysis of the TRY premium/discount at the close of day t on its one day lagged TRY premium/discount. That is, he defined the TRY premium/discount on day t as the dependent variable and its lagged counterpart as the independent variable. He also includes a constant term in the regression model. After regression he found constant term is -0.0067. Although it is very close to zero, it is statistically and significantly different from zero with a t-value of -4.924 at the 1 percent level. The fit of the regression model was also close to zero (R2 = 0.028). However coefficient of the independent variable, which was 0.168, was statistically and significantly different from zero with a t-value of 2.635 at the 1 percent level. This finding supported the idea that the deviations of price from the net asset value persist in the following day, or in other words, they did not disappear in one day.
Lin & Chou (2006) publish research on pricing efficiency of Taiwan Top 50 Tracker Fund (TTT), in Taiwan. He took 423 daily observation points to calculate 2 tracking error series namely TENRIR & TERRIR. TENRIR is the tracking error series adjusted and accounting for management fees, stock replacement impact as well as cash dividend accumulation. TERRIR, based on the return index of the TTT, without deduction of management fees and with adjustments to balance price drops due to dividend payouts, shows a greater accumulation value than TENRIR over time. Two-sample t test is applied first to investigate the mean equality of TENRIR and TERRIR. The tracking error of the TTT is mainly constituted by its cash dividends. Also in another objective of this research, empirical results based on a run test show that the TTT discount/premium condition does not occur randomly. By applying a multivariate model, the empirical evidence shows that the TTT discount/premium could be attributed to its own volatility and market return. The final multivariate results reveal that the return of the TTT is highly correlated with general stock market movements and its arbitrary opportunity. TTT mimic the performance of Taiwan 50 Index. The researcher concludes that there is a close relationship between TAIEX & Taiwan1 50 index fund.
Gerasimos G. Rompotis (2006) conducted an empirical study taking 16 pairs of ETFs and Index Funds, which track the same indexes. He compared the results of ETFs, index funds and indexes average daily return and risk calculations. He applied two alternate methods of ETF return measurement. The first one was to divide the difference of ETF last trade prices on day one and on zero day with the last trade price on zero day. The second one is the division of difference between the bid price on day one and the ask price on zero day to the ask price on zero day. Also he inferred that ETFs and index funds essentially display the same performance attitude. When the comparison was between index fund's return and ETFs bid-ask return, a remarkable advantage of index funds is detected. Index funds have also about the same risk with ETFs, while their return standard deviation is equal to 1.492, too close to ETFs volatility. He concluded that ETFs and index result nearly the same levels of performance and portfolio risk to their investors, so one could wonder why we should have two different investment products, which both derive similar effects. The answer was that ETFs principally address to stock investors who prefer to invest on exchange indexes, while mutual funds investors are more conservative, they narrowly invest on ETFs and prefer to follow buy and hold investing strategies. Applying regression analysis, he verified that, both ETFs and index funds do not derive any excess return relative to the returns of the tracking indexes. He also found that ETFs follow more accurately the composition of indexes in comparison with index funds. Furthermore, he used three alternative methods to estimate tracking error and found that, on average, ETFs and index funds present qualitatively the same tracking error records. He also concluded that risky mutual fund investors prefer ETFs. Institutional investors invest in ETFs if they are not allowed to invest in financial derivative products for hedging.
Gallagher and Segara (2004) based their research on Australian ETFs for their tracking error. They calculated tracking error by two methods. In first method, they took the average of absolute difference and in second method they took the standard deviation of difference in returns between Control ETF and Wholesale Index Funds. He took S&P/ASX 200 Accumulation Index & street TRACKS S&P/ASX 200 Fund as control ETF. They also found that the tracking error of wholesale index equity funds is significantly higher relative to ETFs that are benchmarked against appropriate underlying indices. This may be due to problems associated with liquidity costs, dividend policies in the timing of receiving dividends for re-investment purposes and/or higher expenses. In another objective they also found deviations between unit traded price and NAV disappear within a day. To investigate this issue, a regression model was used. The difference between price and NAV as expressed in dollars at the close of day t (Dt) was regressed in a model with a constant (α) and its one day lagged variable (Dt-1). He concludes that market is efficient, where deviations that do occur between price and NAV do not persist over time, but rather disappear within a day.
Till now India has 19 ETFs listed on National stock exchange. Out of theses 7 are commodity ETFs. They are based Gold Commodity. Another corporate major Tata Group is also said to be finalizing its Gold ETF under the Tata Mutual Fund2 (Sondhi & Jain 2006). India's gold volumes under the exchange-traded funds rose 55 percent on year to 8.265 tonnes in December, 2009. “Gold collections by Gold ETFs in India are negligible compared to the physical trade of some 700 tonnes of the yellow metal. Therefore, In my opinion there is lot of scope for new ETFs to enter and existing ETFs to do more and more business. The entry of new gold funds will expand the investment potential for Gold ETFs in India. According to Saurabh Nanavati, chief executive officer of Rellgare Mutual Fund that launched the Religare Gold ETF said that gold is a hedge against inflation and a falling US dollar in emerging markets like India which are facing inflationary Issues due to ample liquidity created by global central banks. Launched in 2007, Gold ETFs in India are now managed by seven fund houses that include Religare Mutual Fund, State Bank of India Mutual Fund, Benchmark Asset Management, UTI Mutual Fund, Kotak Mahindra Mutual Fund, Reliance Capital Asset Management and Quantum Mutual Fund. ETFs track the performance of a particular index; their base price is basically equivalent to the value of the index. ETFs are not limited to gold. There are ETFs of almost all metals and most-traded agro-commodities. Eg: Gold, silver, copper, wheat, corn, cotton etc. At present, in India gold is the only commodity ETF.
Recently India has also launched its first international ETF as Hang Seng BeES. It was launched by Benchmark Mutual fund Asset Management Company. It gives option to Indian investors to diversify their portfolio across countries or internally. In my opinion there is a huge potential for ETFs tracking the international indices and emerging market indices especially ETFs based on high growing Chinese market and Brazilian market can do well by giving investor a wider choice for investment outside India.
Out of 10 equity ETFs listed on National Stock Exchange, only 3 ETFs are more than 3 years listing history, rest all are recent listings. Trend of ETFs is catching in India because of passive management is giving similar returns as compared to the active management but with very high cost effectiveness. Nifty BeES ETF by benchmark mutual fund Company is having largest assets under management amongst ETFs category. It is valued nearly 600 Cr. Rs Which is substantial amount and tells its growth story from first listing in 2003 to 19 listings by now.
There are various advantages of ETF which make them attractive investment instrument. Following are the major advantages.
ETFs allow investors to easily diversify portfolios and gain exposure to specific regions of the world, investment styles, or themes.
ETFs provide diversification while they are traded like a share of stock. Investors can buy or sell shares in a mutual fund only once a day, after the markets haves closed. In contrast, ETFs trade continually throughout the day, allowing investors to get in, and out, rapidly when the market makes large moves (Panwar & Madhumathi 2011).
ETFs are more cost-effective than mutual funds for a number of reasons. The first is that they tend to be index products so they don't require actives management. In addition, ETFs are bought and sold through brokers, so there is less need for marketing directly to investors, which is not the case with mutual funds. In general brokerage fees for buying or selling an ETF will be smaller than those for mutual fund purchases and sales, unless the investor has very large mutual fund holdings. Another reason for the cost efficiency is that record keeping and customer service are handled by the broker, not the ETF developer-all securities are book entry-and no certificates and issued. Compare this to a mutual fund, which needs extensive infrastructure to handle record keeping and customer support (Kamiyama 2012).
Investors can control when they will pay capital gains taxes, or take tax losses, with ETFs. They incur the taxes only when they sell the shares. This contrasts with the situation of the mutual fund holder, whose tax position is determined by the actions of the mutual fund manager. First when the manager faces a high level of redemptions by its shareholders, it sells shares held by the fund in order to pay back the investors. Selling those shares leads to capital gains taxes that the remaining shareholders must pay. Second mutual fund mangers like to sell shares to pay capital gains dividends to investors each year which creates taxes for the investors. Third, when manager comes in to run the fund, that new manager may sell the old holdings to create a new portfolio, leading to capital gains taxes for the owners of the fund. With ETFs, small investors incur taxes only for their trading decisions and don't suffer from the actions of the others (Rajeswari & Moorthy 2012).
ETFs allow investors to hedge portfolios (unlike mutual funds) because investors can short ETFs (which can't be done with mutual funds) (Rao & Ravindran, 2011). This can allow them to protect portfolios from falling prices. SEBI prohibits mutual fund managers from shorting stocks thereby denying investors the opportunity to profit from falling prices.
ETFs allow investors to imitate many hedge fund strategies, without the high costs imposed on hedge fund investors. ETFs allow investors to implement common hedge fund strategies such as market neutral strategy, long-short equity, and other spreading strategies.
Since ETFs trade on regulated exchanges, under the jurisdiction of Securities and Exchange Board of India (SEBI), they provide investors with more protection than does investing in hedge funds which do not have proper regulatory body.
ETFs also benefit from liquid markets, which mean that investors can buy, or sell whenever they want to, without pushing the stock up or down. Of course, this doesn't mean that liquidity can't dry up and be missing in action when it's needed.
India has its only commodity ETF which is based upon Gold. Although there are Gold 7 ETFs are existing in India, but there is none catering to the investment in Silver, Copper, Aluminum, Wheat, Rice etc. So in my opinion it is the unexplored area of ETFs in India.
There are 10 Equity ETFs in India but only one is based on International Market. So there can be more ETFs tracking the growing market indexes like Bovespa of Brazil or Chinese Indices.
There are no currency ETFs existing in India. So there is opportunity to launch ETFs which are based on the basket of currencies (Poterba & Shoven 2012).
There is unexplored area of ETFs as ETFs of other ETFs. It means there can be one ETF which will track the International index and Domestic index at the same time by investing in other ETFs which are based on International market and Domestic Market.
There are no ETFs in India, which are based on Crude Oil movement. So there is a place for ETFs in India to capture this segment.
There is lot of scope for sector specific ETFs. There can ETFs which track the real estate sector companies, or Metal index or Pharma index. As these sectors are growth engines of Indian Economy, so this is the area to launch new ETFs.
Bond ETFs are still not available in India. Exchange-traded funds that invest in bonds are known as bond ETFs. They thrive during economic recessions because investors pull their money out of the stock market and into bonds (for example, government treasury bonds or those issues by companies regarded as financially stable).
There are many other areas of ETFs which are still unexplored not only in India but even in developed markets also. ETFs have come long way since their introduction in India in 2003 and they are growing in number of listings as well as the categories.
This section presents the analysis of performance characteristics of ETFs and their comparison with Index Mutual Funds. Table 1 gives the general statistics of the data. There are 6 ETFs and 5 Index Mutual Funds. The investment objective of each ETF is to track the respective index as give in the table. All Index mutual funds selected are tracking S&P CNX Nifty Index. Maximum time horizon for the study is 3 year period starting from 1st April 2007 to 31st March 2010. Reliance Banking, PSU Band BeES and Kotak PSU Bank ETFs do not have 3 years trading history hence data points for these ETFs are less than other ETFs.
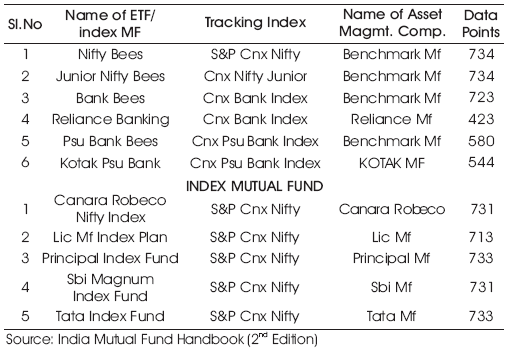
Table 1. General Information of ETF's and Index Mutual Funds
Table 2 has been prepared by using the Equations 1 & Equation 2 i.e. Standard deviation of returns of ETFs, Index Mutual Funds and Indices have been calculated.
From Table 2 it can be inferred that risk of Index is passed on to the tracking ETF. This is in line with author’s expectation because all the securities in the Index are included in the ETF in the same proportion. So it will carry almost same risk as that of underlying index. Very small deviation in risk of ETF w.r.t to underlying index is available due to the tracking error.
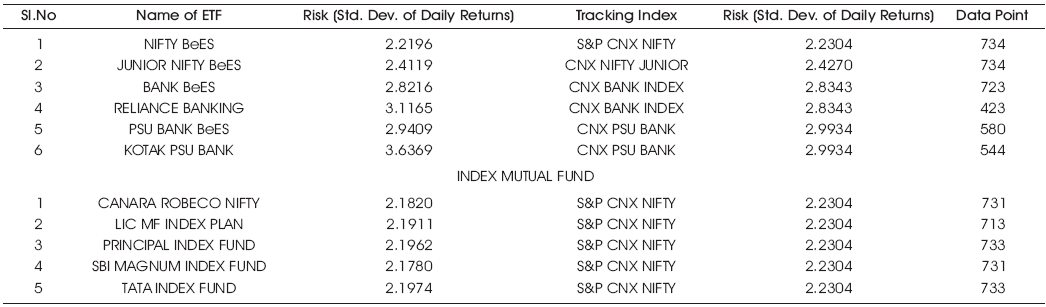
Table 2. Risk of ETFs, Index Mutual Funds & Indices
Figure 2 shows that Nifty BeES ETF and S&P CNX Nifty (underlying index for Nifty BeES) share same risk profile. Similarly it can be inferred that Junior Nifty BeES and CNX Nifty Junior also have same risk. Major deviation of risk of ETF and underlying index can be observed in Kotak PSU Bank ETF and CNX PSU BANK index. This deviation indicates the possible tracking error between these two.
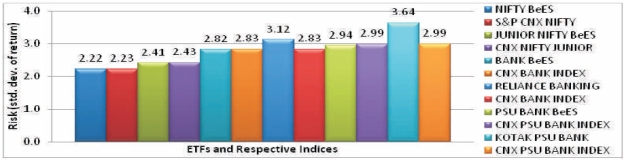
Figure 2. Comparison of Risk of ETF and Respective tracking index
It can be observed from Figure 3 that all the index mutual funds have slightly lesser risk as compared to S&P CNX Nifty. This can be explained by the fact that there is tracking error in all of these index funds and hence they are not able to replicate the full risk (and return also) of S&P CNX Nifty index.
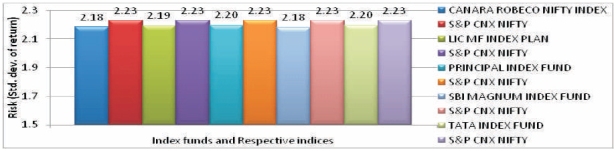
Figure 3. Comparison of Risk of Index Mutual Funds and Respective tracking index
Here regression has been run by taking return of ETF or Index Mutual Fund as dependent variable and return of respective index as independent variable. In this section, the author present the results of the time-series performance regression using equation 3. In regression analysis the author look for the following numbers:
Standard Error of the Regression Model: This tells that how good the model is to draw meaningful conclusion.
α, and β coefficients in the regression model and their statistical significance.
R2 of the model. This tells that how much variance in dependent variable has been explained by the chosen independent variable.
Null Hypothesis H0 : α = β = 0 i.e. all the regression coefficient are zero and return on ETF or Index Fund is independent of return on respective index.
Alternate Hypothesis H1 : : α,β ≠ 0 i.e. all the regression coefficient are statistically different from zero and return on ETF or Index Fund is not independent (correlated) of return on respective index.
First the author look at the regression model of ETFs. Here it can be observed that the alpha coefficient estimate is not statistically different from zero. This is confirmed by looking at the p-value in the adjacent column on the right side. All the p-values for ETFs are > 0.05 (Taking 95% confidence interval) which conveys the meaning that all alpha values are not statistically significant and hence are not diffident from zero. Therefore the author fail to reject the null hypothesis for alpha coefficient.
This finding agrees to the author’s expectations, since all ETFs of the sample are passively managed having no material trading flexibility to produce superior returns than their underlying indexes. Now observing the beta coefficients in ETFs regression model, the authors found that beta coefficient in all the models is statistically significant as p-value is less than 0.05 for 95% confidence interval. For Nifty BeES and Junior Nifty BeES, beta coefficient is close to 1, which tells that there is almost perfect correlation between returns of these ETFs and returns of underlying indices. Coming down to other ETF's in Table 3, it is observed that beta coefficient for Reliance Banking ETF is only 0.57, hence it can be inferred that there exist a high tracking error. This tracking error can be due to management fees, dividends or other taxes. Now the author observe Table 3 for Index mutual funds. Alpha coefficients in Index mutual funds are close to zero but statistically significant for 3 index funds namely Principal index fund, SBI Magnum index fund and Tata index fund. So the authors accept the alternate hypothesis for alpha coefficients. It shows that there is a portion of returns of these index funds which is independent of returns of respective indices. This independence of returns from respective indices can be attributed to tracking error. Now observing the beta coefficients for Index mutual funds for remaining 5 regression models suggest that all the beta values are significantly different from zero. So the author reject the null hypothesis for beta coefficient and conclude that returns of index funds are dependent on the returns of respective indices. He also observe that all the beta values for index mutual funds are close to 1, i.e. there is very high correlation of returns between index mutual funds and respective indices.
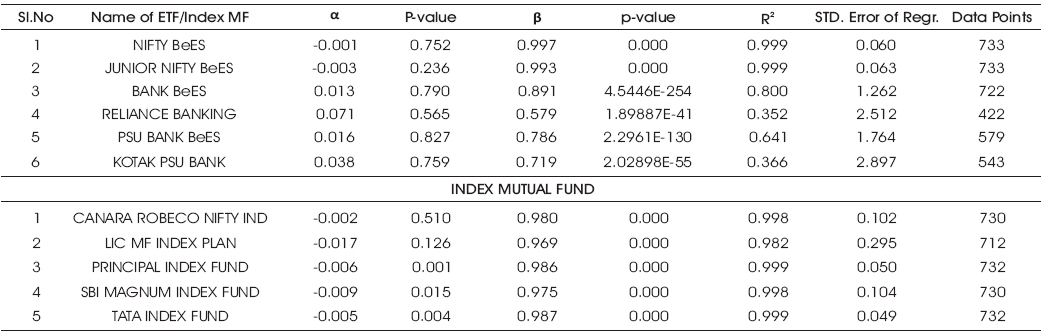
Table 3. Regression model of ETF and Index Mutual Funds
Major current problem that portfolio managers face is the minimization of portfolio's return volatility relative to volatility of a benchmark or an index portfolio, known as tracking error criterion. The first goal of Fund Manager is the beating of market, resulting in a positive expected tracking error and the second one is the reduction of the variance of difference between managed portfolio return and benchmark return. Main factors that derive and induce tracking error of index fund portfolios are managerial fees and transaction costs, which are correlated with portfolio operation, rebalancing and capital flows, both for ETFs and index funds.
The authors have calculated tracking error by 3 methods using as explained in the methodology section. Then he take the average of all the three values of tracking error to come up with a final tracking error.
Table 4 reports the tracking error estimations of ETFs and index funds, In this Table TE1 refers to the standard error of regression, TE2 is the calculated as standard deviation of difference in returns between ETFs and respective indices, and TE3 is the average of absolute difference between returns of ETF and respective index.
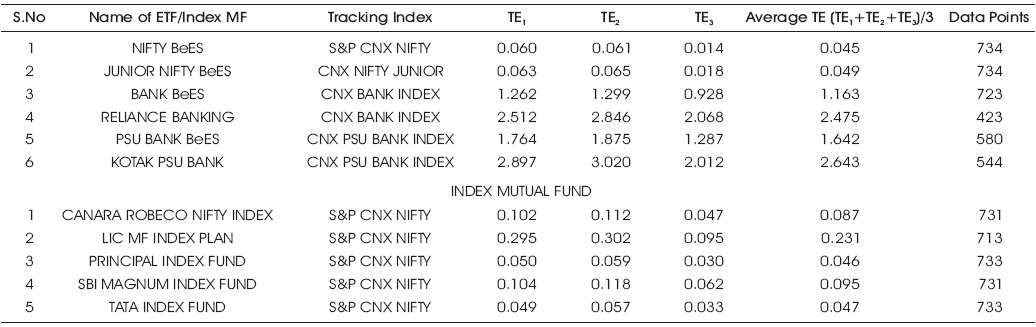
Table 4. Tracking Error for ETFs and Index Mutual Funds
Figure 4 gives the comparison of tracking error amongst ETFs. Minimum tracking error is 0.045 of Nifty BeES and Maximum tracking error is of Kotak PSU Bank ETF which is 2.643. We can also observe that Tracking Error in ETFs in the range of 0 to 2.7 percent only.
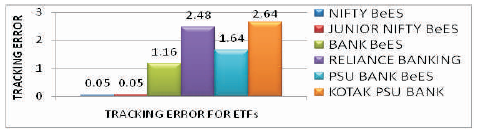
Figure 4. Tracking Error for ETFs
Figure 5 shows the comparison of tracking error amongst other Index mutual funds. It is observed that minimum tracking error is for Principal Index Fund which is 0.46 and maximum tracking error is for LIC MF Index Plan which is 0.23.
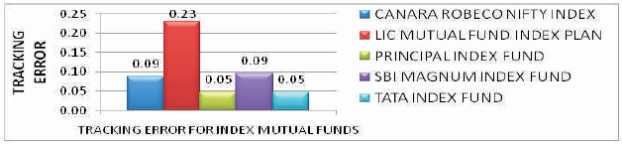
Figure 5. Tracking Error for Index Mutual Funds
From Figures 4 and 5 it can be inferred that Nifty BeES is the best amongst all ETFs and Index Mutual fund due to least tracking error also tracking error for Principal Index Fund is very close to Nifty BeES. Kotak PSU Bank ETF is worst performing ETF due to its highest tracking error in considered sample of 6 ETFs and 5 Index Mutual Funds.
NAV at the beginning & at the end of year have been used to compute average yearly percentage return.
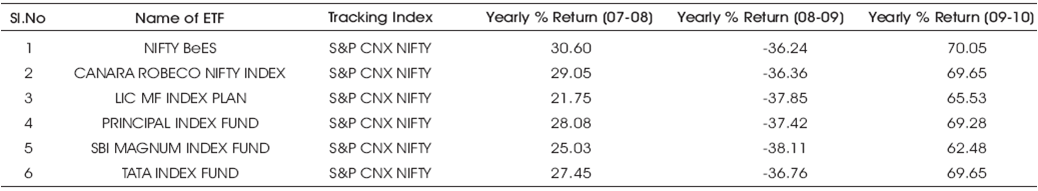
Table 5. Yearly % return comparison between Nifty BeES and Index Mutual Fund
From Figure 6, it can be interpreted that highest yearly percentage return for year 2007-08 was given by Nifty BeES and was equal to 30.6%, whereas the next closest was Canara Robeco, with return of 29.05%. This result is in line with author’s expectation as ETFs are more cost effective and can imitate the Index better than Index Mutual Funds.
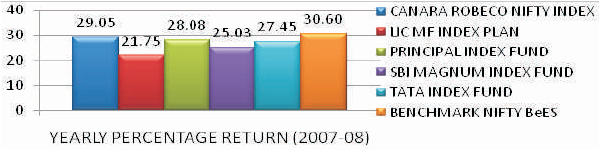
Figure 6. Yearly % return comparison for year 2007-08
From Figure 7, it can be interpreted that yearly % return for all the Index Funds and Nifty BeES ETF are negative i.e. they all have made losses in year 2008-09. They have fallen to the same extent but still Nifty BeES ETF has fallen the least and SBI Magnum Index fund has fallen the most with -38.11% returns. From the Figure 8, it can be interpreted that highest yearly percentage return for year 2007-08 was given by Nifty BeES and was equal to 30.6%, whereas the next closest was Canara Robeco with return of 29.05%. This result is in line with author’s expectation as ETFs are more cost effective and can imitate the Index better than Index Mutual Funds.
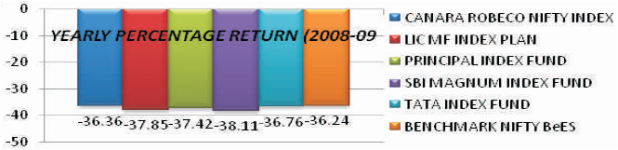
Figure 7. Yearly % return comparison for year 2008-09
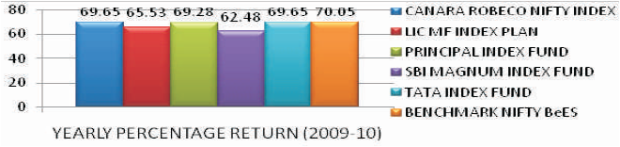
Figure 8. Yearly % return comparison for year 2009-10
Studying the benefits of ETFs as compared to Index mutual funds and other mutual funds, it is concluded that ETFs are more cost effective and flexible instrument for investment to a common investor. They are more transparent and “In Kind” creation and redemption mechanism makes them trade at the value which is very close to the underlying basket of securities. This protects the common investor from buying overvalued ETF units from the market. ETFs have very optimistic scenario in India and they are expected to grow in numbers as well as in different categories. Study has also identified potential new areas and categories available to launch new ETFs in India. Some potential areas are like ETFs based on agricultural products like Wheat, based on metals other than gold, like silver and copper. ETFs based on currencies and ETFs based on Emerging markets like China and Brazil.
Risk analysis of ETFs, Index Funds and Indices allow us to draw the conclusion that Kotak PSU Bank ETF has very high variability of returns and hence is most risky ETF from the sample of 6 ETFs and 5 Index mutual Funds. It is also concluded that CNX PSU Bank Index is most risky and S&P CNX Nifty is least risky index.
Studying the performance characteristics of ETFs and their comparison with other index mutual fund allow us to conclude that ETFs are more efficient to track the underlying index. From the regression models we conclude that ETFs have least tracking error and hence are able to replicate the index returns almost completely. Comparison of ETFs with other index funds also allow us to draw a conclusion that when underlying index value rises, ETFs rises to almost same extent subjected to tracking errors but when underlying indices value fall then ETFs fall to the same extent and actually less than the index mutual funds.
Tracking error calculations based on standard error of regression and based on average of absolute returns are almost same when beta coefficient in regression model approaches to unity. Beta coefficient in all the regression models is less than unity, which makes us to conclude that there is defensive management while tracking the indices. Looking at the average of tracking error values from three methods, It is concluded that ETFs have generally lower tracking error than Index mutual Funds.
Performing the comparative analysis of 7 Diversified Mutual Fund Schemes and 9 Sector Mutual Funds allow us draw the conclusion that Sector Mutual Funds generally give better returns but they are more risky at the same time. SBI Magnum FMCG Fund who has given highest average percentage weekly returns (1.2274%) has also taken the highest risk (Std. Dev.16.9212). This observation leads to fact that 'high returns' have been generated by taking 'high risk'. In the study it was found that Sector Mutual Funds follow the risk return trade off i.e. better returns comes with additional risk associated with sector mutual funds.
Study related to identifying the factors influencing the investor behavior while investing in mutual funds allows us to draw the conclusion that there are 5 factors which influence the investing decision of investor. These factors are Fundamental Product Qualities, Communication, Image, Innovate with Objectives and Research Wing. Looking at these factors we conclude that Mutual fund products should possess the fundamental qualities like withdrawal flexibility, less expense ratio etc. At the same time products and new schemes should be communicated to the investor through channels like advertisements or through agents. Also the asset management company should have good brand image and innovation capability to come up with new and better schemes for investors.
From the research on ETFs and Index Mutual Funds it is recommended that investors who are looking for instrument to track the returns of a Benchmark Index (following the passive investment strategy) should invest in Exchange Traded Funds rather than Index Mutual Funds. Investors can achieve the objective of tracking Index returns at lesser cost and higher flexibility.
1TAIEX is stock market index of Taiwan
2For further details visit http://www.amfiindia.com