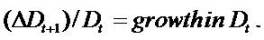
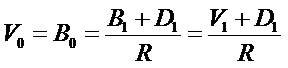
The Relationship Between Value, Net Income, And Book Values
Chao-Hui Yeh * Ti-Ling Wang **
*Department of Business Administration, I-Shou University, Taiwan, Roc.
** Department of International Business, Kao Yuan University, Taiwan, Roc.
Abstract
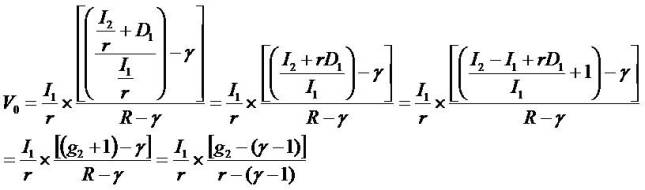
The central variables of this paper are value, net income (wealth creation), book values (wealth accumulated), and dividends (wealth distribution). This paper provides a conceptually useful foundation for the study of net income, book values, and dividends as to how these variables relate to equity value. The discussion makes the case that the analysis is also of empirical interest. This paper systemized overview of the Ohlson 1995(O95) literatures. The paper considers situations in which price equal capitalized forward net income add growth in net income and book values. Accounting, or the financial reporting model, has its own rules, and these make their presence felt all the time. The CSR has a role to interlock the book values and net income. Book values differ from net income because the latter need a capitalization factor to be of the same order of scale as book values. Dividends decrease market value on a dollar-for-dollar basis as dividends (i) decrease book value similarly on a dollar-for-dollar basis but (ii) do not affect the expected residual income series. This paper shows further that the value replacement property tangles closely with the idea that dividends decrease subsequent periods' expected earnings. That is, the more the dividends today pay out; the less the book values accumulate today. The less the book values accumulate today; the less the future net income will come tomorrow. Finally, this paper studies two simple ideas. First, one can use residual income valuation model to predict stock value. Second, mathematical zero-sum series equality provides the analytical starting point and ensures analytical simplicity. These two ideas combine to yield many closed- form valuation models. Without violating the PVED precept, one obtains explicit and basic models relating market value to book value and income.
Keywords :
- Price,
- Earnings,
- Book Values,
- Dividends
Introduction
After Ohlson 1995(O95) and Yeh (2001), literature has been published numerous papers on accounting data and value. A review of this literature reveals that many themes and insights recur across the papers. This paper addresses the essence of O95 and tries to integrate the O95 literatures, and thereby making the O95 literatures more accessible to the average reader. Only with a systemized overview of the O95 literatures can a reader compare how models differ in their key characteristics (like their reliance on certain measures of growth). The paper considers situations in which price equal capitalized forward net income add growth in net income and book values.
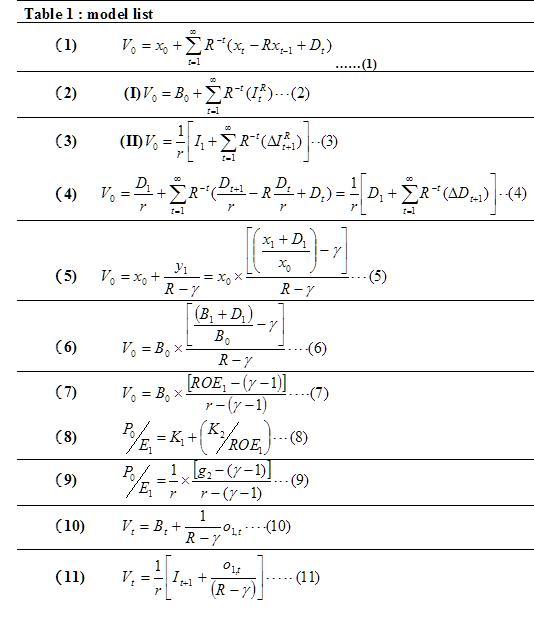
As a preliminary to deal with growth, the paper lays out the framework for (i) Book Value plus Residual Income (BVRI) valuation model and (ii) Capitalized Earning & Increments in Residual Income (CE&IRI) valuation model. The derivations of the (i) and the (ii) are from present value of expected dividends (PVED), but the (i) emphasizes book values while the (ii) emphasizes earning (earning also called net income). The (I) represents PVED via book value plus the present value (PV) of residual net income. Residual net income can be thought of as simply the change in book values with an adjustment for dividends. This manner of treating at residual net income causes an emphasis of growth of book values. On the other hand, the (II) formula derivation does not introduce book values. The (II) formula represents PVED via capitalized both forward earning and the PV of capitalized increments in residual net income. Both (I) and (II) are valuation tools; the goal of this paper is to show how growth influences valuation.
The more detailed study of growth assumes that the residual net income variable satisfies a standard growth/decay dynamic 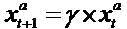 The parameter γ identifies the long-term growth rate. The (I) formula then causes the market-to-book(P/B)1 model familiar from many textbooks (e.g. Penman 2006), and the (II) formula causes the so-called OJ model (Ohlson and Jeuttner-Nauroth 2005). Both (I) and (II) models can explain the price-to- forward-earning (P/E)2 ratio, but they do so with different dependent variables. In case of (I) formula, the return on equity (ROE)3 explains the P/E ratio
In case of (II) formula, the growth in expected net income explains the P/E ratio
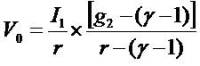
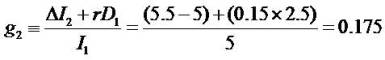
The g2 defines the short-term growth (STG) in expected net income). Therefore one obtains two distinct ways of explaining the P/E ratio with transforming the mathematics. With growth being expected, it follows that the firm's price equates book values (or capitalized forward net income) add growth.
The central variables of this paper are value, earnings (wealth creation), book values (wealth accumulated) and dividends (wealth distribution).
1. The models
This paper uses the following notation:
Vt= Value (price) of equity, V = P
Dt = (net) Dividends
Bt= Book value
It = (net) Income (NI=EAT=earning after tax), I = EPS, the P/E ratio
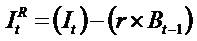
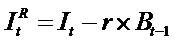 = Residual (abnormal) Income (RI), R = 1+ r= the discount factor, an exogenous constant equals the risk-free rate. RI is defined as current earnings minus the risk-free rate times the beginning of period book value, that is, earnings minus a charge for the use of capital. (RI =earning after tax and cost of capital (cc),
 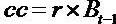 . If the ROE > r (
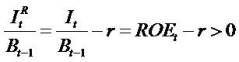 ) then the firm has the positive RI.
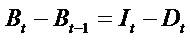
Clean surplus relation (CSR), Bt - Bt-1= It - Dt. Regardless one considers growth in expected Income or book values, such growth depends on dividends and the retention of earning. The more the retention, the more the firm will grow.
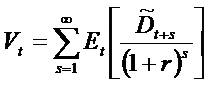
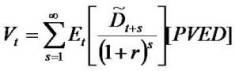
As is normal, this paper assumes that PVED determines value:
The Et [] is an expectation operator.
We build on the dividend discount model (PVED) using the following unified valuation framework. The framework emphasizes that from a mathematical point of view, one can use dividends, earnings, residual earnings, or free cash flows for valuation. To simplify the mathematical expressions, hereafter date 0 (NOT t) specifies the valuation date.
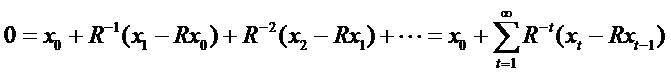
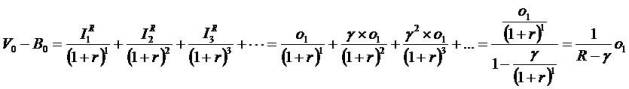
Mathematical zero-sum series equality provides the analytical starting point. For any series of numbers x0,x1…
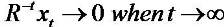
If x (numerator) grows slower than R-t (denomenator), then 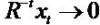
That  makes sense, due to no firm will grow forever.
Adding PVED to zero-sum series produces the first
equation
makes sense, due to no firm will grow forever.
Adding PVED to zero-sum series produces the first
equation
Certainly, the analysis is valid for any x-series. The idea is
that one can represent value in respect of two parts: a
starting point, x0 and a complement defined by the present value of a generic series, 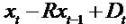 which
implants the series of dividends.
which
implants the series of dividends.
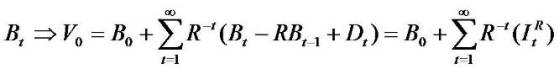
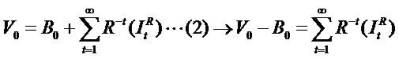
One starts with the book value of equity as follows.
By putting xt = Bt and combining it with residual income (RI) and clean surplus relation (C.S.R.).
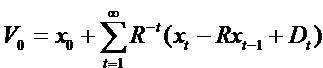
We get 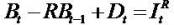 and the second equation (2) and call it as
(I) Book Value plus Residual Income (BVRI) valuation
model.
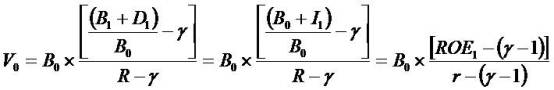
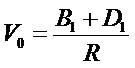
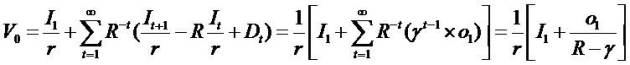
The price (V0) is explained by the initial book value (B0) and the subsequent growth in book value. If the firm has no
growth (R.I.), then price (V0) equate the initial book value (B0). The model fastens value on book value and plus a premium for the present value of residual income (super
growth in book value). The super growth is the growth
beyond what could be achieved by making the normal
rate of return on book value. Book value growth is
explained by the ItR due to the subsequent book value t
increase in ItR (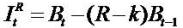 ).
).
The subsequent book value increase in ItR, due to
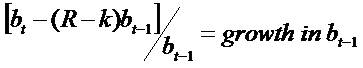
The 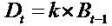 means fixed dividends policy and k = 0 means zero dividends policy and the
  means growth in book value.
The market-to-book ratio ( ) increases as subsequent ItR
increases
) increases as subsequent ItR
increases
Proof of (2):
Replace It in R.I. with  in C.S.R., we get
If xt is book value,  is residual income
Replace xt in (1) with
Q. E. D.
Book value and its growth are famous valuation models
only in banking industries. Analysts in many other industries
focus on earnings and earnings growth. In the following,
we show that instead of starting the valuation with book
value, one can start with capitalized forward earnings and
then plus a premium for abnormal earnings growth. We
call this model the Capitalized Earning & Increments in
Residual Income (CE&IRI) valuation model.
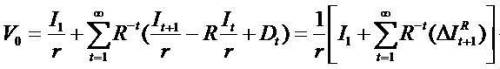
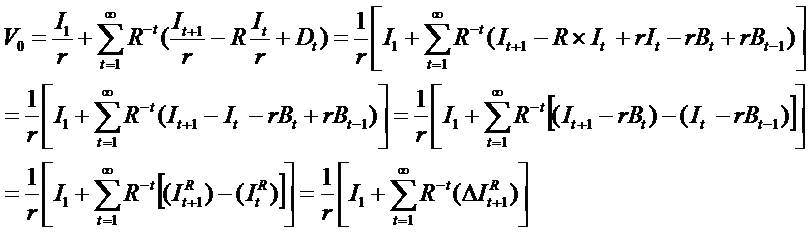
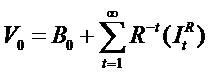
Instead of starting with book value of equity, one can start
with the Capitalized earning as follows. In a similar spirit, by
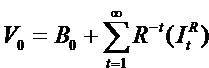
putting  we get the third equation (3) and call it as
(II) Capitalized Earning & Increments in Residual Income
(CE&IRI) valuation model.
we get the third equation (3) and call it as
(II) Capitalized Earning & Increments in Residual Income
(CE&IRI) valuation model.
The price (V0) is explained by capitalization of next period's expected earning ( ) and the subsequent growth
(increments) in residual net income.
) and the subsequent growth
(increments) in residual net income.
Residual earning (income) growth is explained by the
Due to
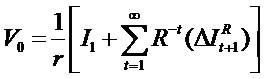
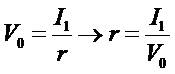
If the firm has no growth ( ), then price (Vo) equate the
capitalization of next period's expected earning (). That
), then price (Vo) equate the
capitalization of next period's expected earning (). That
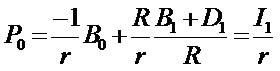
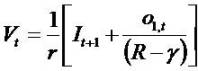
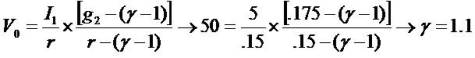
 means time value of money. The V0 is the beginning investment, the I1 is income. Each dollar of stock price (V0) forecasts r dollars of next period earnings. In a certainty setting (referred to as the "savings
account"), where Vt is the amount deposited in the savings account; x, is earnings (the dollar amount of the
interest on the savings account deposit) for period t; r is
the rate of interest on the savings account deposit; and
Dt is the dividend paid to the owner of the savings account (the amount that the depositor chooses to
withdraw) at time t.
means time value of money. The V0 is the beginning investment, the I1 is income. Each dollar of stock price (V0) forecasts r dollars of next period earnings. In a certainty setting (referred to as the "savings
account"), where Vt is the amount deposited in the savings account; x, is earnings (the dollar amount of the
interest on the savings account deposit) for period t; r is
the rate of interest on the savings account deposit; and
Dt is the dividend paid to the owner of the savings account (the amount that the depositor chooses to
withdraw) at time t.
Proof of (3)
In CSR we replace  with
with  and get
Q. E. D.
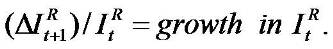
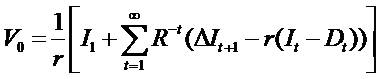
In the third equation
One interprets the item  as the increase in
expected earnings in excess of the increase due to
reinvestment of wealth (
as the increase in
expected earnings in excess of the increase due to
reinvestment of wealth ( ) during the period. The equity value equals capitalized forthcoming earnings add a
premium for growth in expected earnings in excess of the
growth that could be realized by simply retaining the
wealth generated in a fixed return (
) during the period. The equity value equals capitalized forthcoming earnings add a
premium for growth in expected earnings in excess of the
growth that could be realized by simply retaining the
wealth generated in a fixed return ( ) instead of paying dividends. In a fixed rate savings account, the item
(-Dt) is the withdrawal and remaining amount (It - Dt) increases the savings account balance and yields
additional interest income: r (It - Dt). For a savings account, the item r (It - Dt) equates ΔIt+1 and the item (
) instead of paying dividends. In a fixed rate savings account, the item
(-Dt) is the withdrawal and remaining amount (It - Dt) increases the savings account balance and yields
additional interest income: r (It - Dt). For a savings account, the item r (It - Dt) equates ΔIt+1 and the item ( ) is
zero. Thus, there is no premium over capitalized
forthcoming earnings. That is, the marginal investment in a
savings account has zero NPV.
) is
zero. Thus, there is no premium over capitalized
forthcoming earnings. That is, the marginal investment in a
savings account has zero NPV.
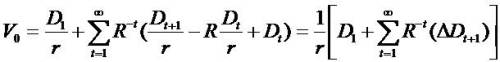
In a similar spirit, by putting  we get the fourth
equation (4) and call it as capitalized dividends&
increments in dividends valuation model (CD&IDVM).
we get the fourth
equation (4) and call it as capitalized dividends&
increments in dividends valuation model (CD&IDVM).
The price (V0) is explained by capitalization of next period's expected dividends  and the subsequent growth
(increments) in dividends.
and the subsequent growth
(increments) in dividends.
Dividends growth is explained by the
due to
Those derivations (equations (2), (3) and (4)) do not
depend on any conceptual restrictions on accounting
data. There is, for example, no clear distinction between
the distribution (D) and creation (I) of wealth.
If net income means creation of wealth, then dividends
mean distribution of wealth.
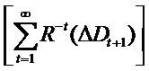
After those derivations (equation (2), (3) and (4)), the
reader will see why the author want to introduce equation
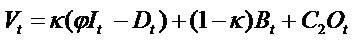
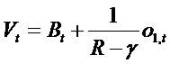
(1). Because equation (1) has item  then
then  mean growth.
If  in the then
  means
growth in book value.
means
growth in book value.
If  in the then means
growth in earning.
in the then means
growth in earning.
If  in the then means
growth in dividend.
in the then means
growth in dividend.
That  in equation (1) means zero growth
in all accounting variables.
in equation (1) means zero growth
in all accounting variables.
Moreover, this growth item goes beyond
the call of duty due to retained net income. In other words,
this growth item is, in fact, a dividend-adjusted
growth. Now the question arises whether one can find
some useful, additional assumption that parameterizes
this growth item . All parameterizes are known.
1.1 Comparisons of model (I) BVRIVM and model (II)
CE&IRIVM
Model (I) BVRIVM develop market value as book value plus
a premium above book value for expected growth in
book value, model (I) anchors valuation on book values.
Such focus on book values is justified when book values
near market values, for example, financial instruments
are marked to market. So, model (I) is good to value
financial institutions. But, the emphasis on book values is
lost when firms are conservative accounting rules. E.g.,
the most important assets of knowledge intensive
corporations are not shown on their books as
investments in intellectual assets are not shown on their
financial statements. Thus, their book values are underestimated
and the ROE is over-estimated. Analysts
valuing these firms usually do not use book value of
equity as the starting point in their valuation. Thus, model
(II) CE&IRIVM focus on the earnings and earnings growth
expected from these “off-balance sheet” properties.
Analysts focus on capitalized earning & increments in
residual income (CE&IRIVM) because future earnings
and earnings growth are less affected by conservatism
than are book values. Thus, model (II) are heavily used for
valuation.
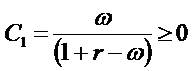
In model (I) BVRIVM
if the item  i.e.,
ROE=r, then model (I) reduce to Vt = Bt. Similarly, in model
(II) CE&IRIVM
i.e.,
ROE=r, then model (I) reduce to Vt = Bt. Similarly, in model
(II) CE&IRIVM
if the item  then model (II) reduce to
  . In a fixed rate savings
account, the interest income expected from a savings
account equals
. In a fixed rate savings
account, the interest income expected from a savings
account equals  , which implies
  . For a savings account, the model (I) and model (II) are
equivalent. Real firms, however, are not savings accounts.
. For a savings account, the model (I) and model (II) are
equivalent. Real firms, however, are not savings accounts.
2. Parameterized models explaining the P/E ratio
In what follows the authors do not initially attach any
economic interpretation to this growth item . One can derive V0 as a function of x0 and x0 + x1 alone, given suitable assumptions on the x-series. Unsurprisingly, the
assumption requires the yt -series 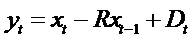 to grow (or decay) geometrically. By imposing some structure on the
pattern on yt we get a short formula. To make the model
more realistic yet simple we do not restrict on one-year
ahead yt allowing y1 being any positive number. After year 1
we assume yt grows at a constant rate. Specifically,
to grow (or decay) geometrically. By imposing some structure on the
pattern on yt we get a short formula. To make the model
more realistic yet simple we do not restrict on one-year
ahead yt allowing y1 being any positive number. After year 1
we assume yt grows at a constant rate. Specifically, 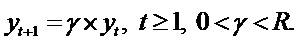 . Where 0 < γ is some presumed growth t
parameter and 0 < yt. If yt = 0, then
. Where 0 < γ is some presumed growth t
parameter and 0 < yt. If yt = 0, then  .
.
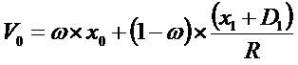
Given PVED and consider any series  satisfying
 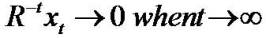 and a related series
 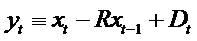 such that
Then
And
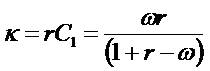
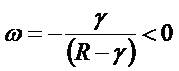
Where all parameterizes (ω, γ) are constants.
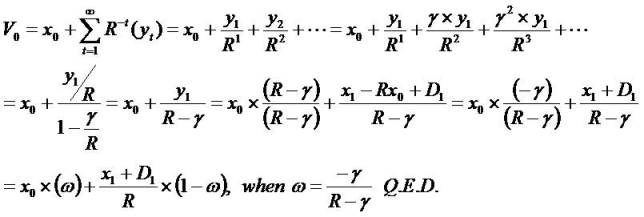
Proof of (5):
Given(1),
Armed with these analytical results, I next identify the two
cases that explain the P/E ratio. The first approach, (a),
refers to the growth in book value, and the second, (b),
refers to the growth in net income.
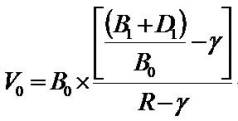
(I) Setting x = B in (5) simply changes the notation and the (5) decreases to (6)
One reads  in (6) as the forthcoming growth in the
expected book value, adjusted for dividends. The
numerator adjustment for dividends is important: it reflects
dividend policy irrelevancy (DPI). That is, the numerator
does not depend on the next period's dividend decision
since the cum-dividend book value,
in (6) as the forthcoming growth in the
expected book value, adjusted for dividends. The
numerator adjustment for dividends is important: it reflects
dividend policy irrelevancy (DPI). That is, the numerator
does not depend on the next period's dividend decision
since the cum-dividend book value,  , does not depend on the dividend. Thus the choice of date-one
dividends does not affect V0.
, does not depend on the dividend. Thus the choice of date-one
dividends does not affect V0.
In CSR we replace with 
Standard derivations of the model assume CSR. It causes
the textbook expression:
Given (6),
Where 
equals the forthcoming expected return
on equity. It follows that increases as ROE1 increases. With respect to γ - where now
The market-to-book ratio () increases as γ increases when  . These conclusions are reasonable because they decrease to the idea that "growth in residual net income is
good assuming they are initially positive". Relating the
ratio to ROE has some attraction, certainly. But it needs a convincing real-world (For real-world reference
purpose, we put a sample in endnote 4) motivation.
Investors tend to ask "What factors explain the P/E ratio?"
rather than "What factors explain the ratio?" More
important for our purposes, the last question is of interest
because it has already been established that
. These conclusions are reasonable because they decrease to the idea that "growth in residual net income is
good assuming they are initially positive". Relating the
ratio to ROE has some attraction, certainly. But it needs a convincing real-world (For real-world reference
purpose, we put a sample in endnote 4) motivation.
Investors tend to ask "What factors explain the P/E ratio?"
rather than "What factors explain the ratio?" More
important for our purposes, the last question is of interest
because it has already been established that  is valid
for time value of money
is valid
for time value of money
A model
resting on book values ought not to rule out an
explanation of the P/E ratio ( ).
).
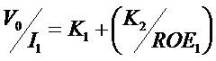
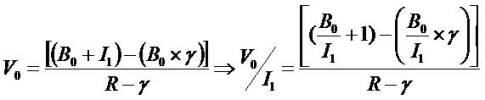
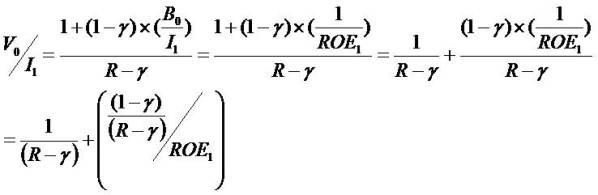
Shifting the focus to the P/E ratio, simple manipulations of
the last equation causes
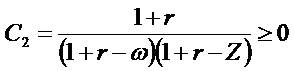
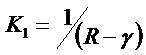
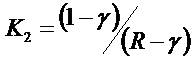
Where
Proof of (8):
Given (7),
Q.E.D.
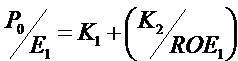
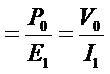
The left-hand-side variable of interest, the P/E ratio (),
depends only on the right-hand-side variable ROE1 in addition to the parameters γ and R.
An evaluation of how ROE1 influences the P/E ratio (), depends on the sign of K2. Signing K2 sequentially lays the duty on the sign of 1 - γ. Is γ greater or less than one? It
makes sense to require γ to exceed 1 if residual net
income (ItR) is positive (i.e., ROE1 > r), just as γ should be less than one if ItR is negative (ROE1 < r). The first claim is based on the idea that if the firm is profitable, then, in
expectation, the dollar amount of ItR should expand with time. Such an expected situation occurs if conservative
accounting is combined with growth in the firm (if ROE1 > r but γ < 1, then ItR and Vt - Bt decline with t and both go to zero, which is conflicting with conservative accounting).
As the second possibility, if the firm is unprofitable (ROE1 < r), then one should expect that the gap, ROE versus r, to be slowly closed in the future. And given ROE1 < r (or ItR < 0), ItR goes to zero as t → ∞ if and only if γ < 1. Thus ROE1 < r causes the condition y < 1.
Given the above restrictions — summarized by ItR (γ - 1) > 0 - it follows that if ROE1 is less than r, and then the price-to-
forward net income ratio, the P/E ratio () decreases as
ROE1 increases. For ROE1 greater than r, the P/E ratio now increases as ROE1 increases. In other words, as an empirical matter one should expect the function on
ROE1 to be U-shaped.
Despite the fact that the analysis may seem somewhat
self-important and mechanical, it makes more intuitive
sense than one might think initially. Consider a firm with
ROE1 of, say, 20 percent when r = 10 percent. Such a firm is profitable, and the setting corresponds to γ > 1. Now it is
clear that if the firm remains about equally profitable
some day, then a computation shows that the growth in
expected net income will be superior. Hence the P/E ratio
ought to show a premium (exceed 1/r). Next consider
when ROE1 is poor, say, 5 percent, which is the setting when y < 1. Now there is reason to expect that ROE improves with
the passage of time. A computation now shows that even
a modest improvement in ROE to, say, 6 percent implies a
considerable growth, in expected net income. Again, the
growth principle causes the conclusion that the P/E ratio
reflects a premium. (As an empirical matter, it is easily
verified, looking at real-world data, that the huge firms with
subpar ROE1 such as than 7 percent, indeed have relatively large P/E ratios. Yet, as any textbook will note,
such firms will also have below-average ratios.)
The modeling allows for the case when the capitalized
forward net income alone decides value: γ = 1 or ROE1 = r
give the necessary and sufficient conditions. The case
ROE1 = r is rather stale since now . The idea behind γ = 1 is more clever; now the conclusion
follows even though V0 - B0 ≠ 0 (the sign depends on the sign of ItR, of course). However, γ = 1 implies V0 - B0 = V1 - B1 (γ = 0 implies Vt = Bt) and hence the expected balance
sheet valuation "error" in the next year cancels with the
one in the current year. And such canceling of error
causes a perfect measure of expected net income so
that
. The idea behind γ = 1 is more clever; now the conclusion
follows even though V0 - B0 ≠ 0 (the sign depends on the sign of ItR, of course). However, γ = 1 implies V0 - B0 = V1 - B1 (γ = 0 implies Vt = Bt) and hence the expected balance
sheet valuation "error" in the next year cancels with the
one in the current year. And such canceling of error
causes a perfect measure of expected net income so
that  . That means no growth. Profitability,
as a concept, refers to the dividend-adjusted growth in
book value, and
. That means no growth. Profitability,
as a concept, refers to the dividend-adjusted growth in
book value, and  explains whether one believes
CSR or not.
explains whether one believes
CSR or not.
In x = B setting and also  that means no
growth and price decay to
that means no
growth and price decay to
The equation
implies
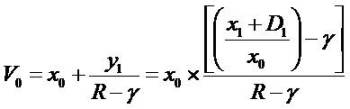
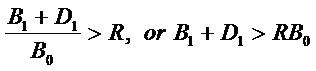
Hence the more general model
admits for a growth in book values
to explain the  ratio less than . In the equation (5.2)
that P0 increases as B0 decreases, holding (B1 + D1) fixed.
ratio less than . In the equation (5.2)
that P0 increases as B0 decreases, holding (B1 + D1) fixed.
In xt = Bt setting and also  . Thus
this setting thereby interlock between xt = Bt and 
(II) Set . This setting interlocks with the (CE&IRIVM:
model framework. A
geometric growth (decay) assumption now causes the
equation (9).
Where
Proof of (9):
Given (5),
Put  In(5), get
The item 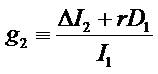 defines the short-term growth (STG)
in expected net income, adjusted for dividends (For realworld
reference purpose, we put a sample in endnote 5).
Like the book value model, DPI constructs in an
adjustment for dividends. In the present case, the idea is
that
defines the short-term growth (STG)
in expected net income, adjusted for dividends (For realworld
reference purpose, we put a sample in endnote 5).
Like the book value model, DPI constructs in an
adjustment for dividends. In the present case, the idea is
that  does not depend on dividends because I2 depends directly on D1. A savings account illuminates the idea as it shows that D1 gives up net income in the subsequent period such that is independent of D1.
Thus the dependent variable (V0) increases as g2 (STG) increases, as ought to be the case. With respect to γ, the
dependent variable increases in γ if one assumes that g2
exceeds the level of cost-of-capital ( r). It, too, makes
sense as γ represents long-term growth (LTG). For g2 equal cost-of-capital, LTG is now immaterial as the current
growth is neutral to value. If the item g2 < r, a case of inferior growth, then it makes sense to think that γ is less than one.
Now the P/E ratio () decreases as γ increases. But this limit does not affect whether the P/E ratio () increases as STG
increases (given fixed γ and r): it forever increases as g2
increases.
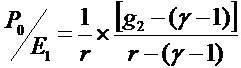
The special case when the P/E ratio () suffice to decide
value occurs if and only if g2 =r (equally, y1 = 0). The pricing (V0) reflects no premium unless there is growth in expected net income. The g2 measures the short-term growth in earnings (adjusted for earnings foregone in period t+2
due to next-year dividends). Hence, the model has two
measures of growth in earnings, g2 and γ, explain the price to forward-earnings ratio.
Simple as the analysis is, one gets the following
conclusion: the idea that the growth in net income
explains the P/E ratio is a principle of generality.
3. The sustaining information dynamics (dynamics
means time series)
This section affirms the two information dynamics that
support the parameterized the (I) model and the (II) model
framework, thus the modeling extends the benchmarks
by growth. This generality implies that the P/E ratio exceeds
1/r. Simplicity and symmetry will be piece of the modeling:
having thanked one of the dynamics, it becomes more or
less repeated what the second must be. Each of the two
dynamic have two parts: (a) a starting point as decided by
either book value or net income, and (b) information that
allows on the coming growth. With those concepts in
mind, one can next expand the dynamic via periodidiosyncratic
information, which makes the practical
content of the model more realistic. Finally, I show the
ways in which the modeling explains accounting
conservatism.
The first case extends the (I) Book Value plus Residual
Income (BVRI) valuation model such that it causes the
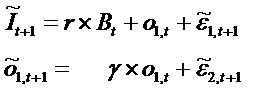
parameterized the BVRIVM. Consider the dynamic
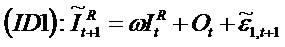
equations
The disturbance terms have zero mean in the usual
fashion. With respect to the incremental notation, one
thinks of 01,t as general "other" information. It can depend on almost anything inside and outside the financial statements.
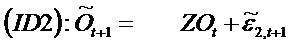
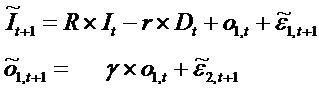
The second case generalizes (II) Capitalized earning&
increments in residual income valuation model
(CE&IRIVM) framework. Consider the dynamic equations
Each of the two dynamics implies a valuation answer
which expresses how the price depends on the
information and the parameters γ.
Assume PVED and consider two information dynamics. For
ID1 value equals
Proof of (10)
Given (2)
For ID2 value equals
The equation (11) tells us that next period expected
earnings, scaled by the inverse of the risk-free rate, decide
value, if other information is zero.
Proof of (11)
Given (3)
Q. E. D.
For real-world reference purpose, we put a sample in
endnote 6 about equation 11.
It is obvious that ID1 implies the model. ID2, on the
other hand, gives a more robust valuation setting. This
watching suggests, speaking in broad terms, that an
earnings point of view provides greater flexibility than a book
value view. That said, for both models one easily explains
the value via a growth construct. When the setting is certain,
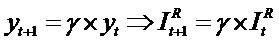
one put money a savings account. The dynamic (ID2) can
be decreased to (ID2.1), like It+1 = R x It - r x Dt ... (ID2.1).
Expressing the dynamic this way makes it apparent that
the change in earnings, It+1 - It, depends only on the earnings r x (It - Dt) retained in the current period. t t
Accordingly, the dividend policy alone explains the
growth in earnings. Zero growth corresponds to a 100
percent payout; a growth that equals the discount factor
corresponds to a zero payout. Common sense suggests
that this growth effect due to retained earnings should
influence any model of earnings and dividends. More
general models, however, ought to also allow for growth
that goes beyond this dividend policy effect, unlike a
savings account. The more the retention holds, the more it
grow.
The dynamic (ID2) deals with "superior" growth, which goes
beyond the growth due to retained earnings in the
dynamic (ID2.1).
O95 suggest that conservatism arises from two different
sources. First, there exist positive net present value (NPV)
projects. Second, the accounting rules can be basically
conservative.
As to the first point, a firm may be observed to have the
opportunity to undertake positive NPV projects. Such
projects do not affect the accounting today, however the
same is not true for today's value. Thus it goes without
saying that the market value today can exceed both
book value and next period's expected net income
capitalized. (A general analysis exploits the (I) model and
the (II) model).
Even so, equation (10) and (11) make it clear that this
source of conservatism can happen only in the context of
growth. .jpg) will not exist
with a positive NPV setting.
will not exist
with a positive NPV setting.
It is seen that the import of growth asserts any introduction
of positive NPV projects. It may seem that positive NPV is
not only sufficient but also necessary for the conservatism.
Such is not the case, however. O95 provide a second
point: the accounting rules themselves can be
conservative besides not recognizing positive NPV
opportunities. The accelerated depreciation, R&D and
excess write-offs cases. Hence one can easily obtain an
inequity where price exceeds book value only as a result of a downward bias in the balance-sheet valuation
model. If in addition there is firm growth, then net income
will also be relatively discouraged because they will be
effectively "deferred".
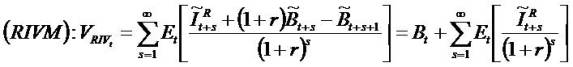
For reference purpose, we put Yeh (2001) Residual
Income valuation mode (RIVM) in endnote 7.
Conclusion
The paper proceeds in three steps. First it presents and
critiques the extant valuation approaches namely the
present value of expected dividends (PVED) and the
residual income valuation model (RIVM). Second, it
presents a framework to unify these extant models and to
derive a model based on residual income and growth on
residual income, which are the two most heavily watched
metrics in the real world. Third, it presents a parsimonious
parameterization of the net income-based model that is
easy to implement and yet gives powerful insights into a
firm's value and its perceived risk.
This paper provides a conceptually useful foundation for
the study of net income, book values, and dividends as to
how these variables relate to equity value. The discussion
makes the case that the analysis is also of empirical
interest.
Accounting, or the financial reporting model, has its own
rules, and these make their presence felt all the time. The
CSR has a role to interlock the book values and net
income. Book values differ from net income because the
latter need a capitalization factor to be of the same order
of scale as book values. With respect to dividend, this
paper discriminates the creation of wealth from its
distribution and its accumulation: the dividend does
indeed differ from the net income and book values, and
the shift from PVED to various expressions that incorporate
net income and book values implants the simple but
important idea that the distribution of value must bring
together and be in agreement with its creation and its
accumulation. Wealth creation takes on fame insofar that
the dividend policy itself cannot create any value — that
is, DPI applies. Performance of this concept depends
critically — and attractively — on the five accounting
concepts: (i) dividends do not influence same-date net income ( ), (ii) dividends decrease book value (
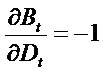 )
(iii) dividends decrease subsequent net income (
)
(iii) dividends decrease subsequent net income (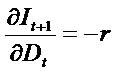 )
since the decreased book value represents fewer resources
essential to generate future net income, An increase in
dividends at any given date decrease the subsequent
period's expected earnings. Because risk neutrality obtains,
the marginal effect of a dollar of dividends on next period's
foregone expected earnings equals the risk-free rate. (iv)
Dividends do not influence residual net income (
)
since the decreased book value represents fewer resources
essential to generate future net income, An increase in
dividends at any given date decrease the subsequent
period's expected earnings. Because risk neutrality obtains,
the marginal effect of a dollar of dividends on next period's
foregone expected earnings equals the risk-free rate. (iv)
Dividends do not influence residual net income ( ),
and (v) dividends do not influence increment (
),
and (v) dividends do not influence increment ( ) in residual net income (
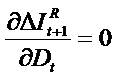 ).
).
Does the analysis result in useful empirical implications? I
think so, for the simple reason that investor starts from the
principle that the growth of expected net income should
justify the P/E ratio. And this is the principle that the analysis
elaborates on, including "why net income" and the nature
of the growth shapes. It certainly improves on the
traditional, textbook, so-called constant growth model.
The popularity of this model has been more dependent
on the importance of the empirical issues that it can
manage than on its intrinsic attraction.
Endnotes
- The market-to-book (V/B) also called price-to-book
(P/B), a ratio used to find the value of a company by
comparing market value of a firm to its book value. Market
value is determined in the stock market through its market
capitalization. Book value is calculated by looking at the
firm's historical cost, or accounting value. The market-tobook
ratio attempts to identify undervalued or overvalued
securities by taking the market value and dividing it by
book value. In basic terms, if the ratio is above 1 then the
stock is overvalued (growth stocks); if it is less than 1, the
stock is undervalued (value stocks). Growth stocks
returned 6.41% per year compared with value stocks
which returned 23.28%.
- A measure of the price-to-earnings ratio (P/E) using
forecasted earnings for the P/E calculation. While the
earnings used are just an estimate and are not as reliable
as current earnings data, there is still benefit in estimated
P/E analysis. The forecasted earnings used in the formula
can either be for the next 12 months or for the next full-year fiscal period. Long-term investors—investors who commit
their money to an investment for ten full years—did do well
when prices were low relative to earnings at the beginning
of the ten years. The lower P/E ratio stock you buy the
higher return you earn. Note that at the height of the Dotcom
bubble P/E had raised to 32. The collapse in earnings
caused P/E to rise to 46.50 in 2001. It has declined to a
more sustainable region of 17. Its decline in recent years
has been due to higher earnings growth.
- Return on Equity (ROE) between 15% and 20% are
considered desirable. High ROE yields no immediate
benefit. Since stock prices are most strongly determined
by earnings per share (EPS), you will be paying twice as
much (in Price/Book terms) for a 20% ROE company as for
a 10% ROE company. The benefit comes from the
earnings reinvested in the company at a high ROE rate,
which in turn gives the company a high growth rate. ROE is
presumably irrelevant if the earnings are not reinvested.
The sustainable growth model shows us that when firms
pay dividends, earnings growth lowers. If the dividend
payout is 20%, the growth expected will be only 80% of
the ROE rate.
What Does ROE Mean? The amount of net income
returned as a percentage of shareholders equity. Return
on equity measures a corporation's profitability by
revealing how much profit a company generates with the
money shareholders have invested. ROE is expressed as
a percentage and calculated as: Return on Equity = Net
Income/Shareholder's Equity.
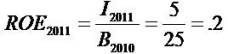
- (I) Setting xt = Bt, The firm in our example is Taiwan
Semiconductor Manufacturing Company (TSMC). TSMC
shares were trading at $50 at the end of 2010 and the
book value per share was $25. Market-to-book ratio = 2.
Bloomberg's estimate of the cost of capital on TSMC was
15 percent. Value Line forecasted earnings for 2011 of $5.
The implied long-term growth in residual income g, is 10
percent.
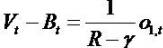
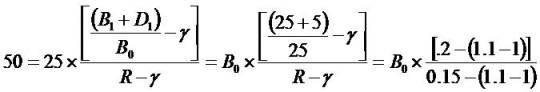
The relations between
prices, book value, and growth in book value are
illustrated in equation (7.1)
Notice that the price-to-book ratio of 2 is greater than one
— That is, the balance sheet is conservative. This
conservative accounting is associated with short-term
growth in (dividend-adjusted) book value (20 percent)
and long-term growth in residual income of 10 percent;
The observation that the expected short- term rate of
growth in dividend-adjusted book value (i.e., the
expected return on equity) of 20 percent is greater than
the cost of capital (15 percent) shows that the 2011
accounting is beginning to "correct" for the conservatism
in the 2011 balance sheet. The long-term growth rate in
residual income of 10 percent shows that more growth is
expected in future accounting earnings to complete the
"correction" for conservatism.
- (II) If , is capitalized earnings, y is capitalized t
abnormal earnings growth, g is (one plus) change in
abnormal earnings growth, and the abnormal earnings
growth model may be written as
Where,
The adjustment to capitalized earnings in this form of the
model is additive in (II); the alternate form differs in that the
adjustment is multiplicative in (I). This form highlights
growth in earnings — both short-term and long-term. The
relations between TSMC's prices, earnings, and growth in
earnings are illustrated in equation (9.1) and (9.2). (In
addition to data seen before we now note that Value
Line's forecast of TSMC's 2012 earnings will be $5.5 and
TSMC's 2011dividends will be $2.50). Notice that the
forward-earnings-to-price ratio of 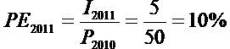 is
less than r (the cost of capital on TSMC was 15 percent) —
that is, the income statement is conservative. This
conservative accounting is associated with short-term
growth in (dividend-adjusted) earnings of 20 percent and
long-term growth/decay from this high base-level of
abnormal earnings growth, 10 percent (γ = 1.10).
is
less than r (the cost of capital on TSMC was 15 percent) —
that is, the income statement is conservative. This
conservative accounting is associated with short-term
growth in (dividend-adjusted) earnings of 20 percent and
long-term growth/decay from this high base-level of
abnormal earnings growth, 10 percent (γ = 1.10).
- The firm in our example is TSMC. Data same as above,
other information is close to zero (01 = 0.1).
- Residual Income (Residual-Income, I R).
It : Net Income=NI, Earnings After Tax=EAT=EPS
r = denotes the nominal cost of capital and
Discounted Dividend Valuation Model (DDVM)
Under the clean surplus rule (CSR), dividend-adjusted
incomes are added to shareholder's book value.
Combine (A1) 、 (A2) 、 (A3), we get (A4) :
Linear Information Models, LIM
Combine (A4) 、 (A5) 、 (A6), we get (A7) :
Where
A restatement of the model (A7)
Using the definition of ItR, the model (1.7) also equals 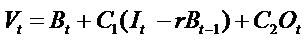 . If one further replace Bt-1 with
CSR, then, we get
. If one further replace Bt-1 with
CSR, then, we get
Where
These valuation weights are purely functions of the cost of
equity and the persistence of residual income.
References
[1]. Ohlson, J. A. (1995). Earnings, book values, and
dividends in equity valuation. Contemporary Accounting
Research 11 (2): 661-87.
[2]. Ohlson, J. A., and B. Jeuttner-Nauroth. (2005).
Expected EPS and EPS growth as determinants of value.
Review of Accounting Studies 10 (2-3): 349-65.
[3]. Penman, S. (2006). Financial statement analysis and
security valuation, 3rd ed. New York: McGraw-Hill.
[4]. Yeh, chao-hui. (2001). A study on non-linear residual
income valuation model, doctoral dissertation, National
Sun Yat-sen University.


.jpg)
.jpg)
.jpg)
.jpg)