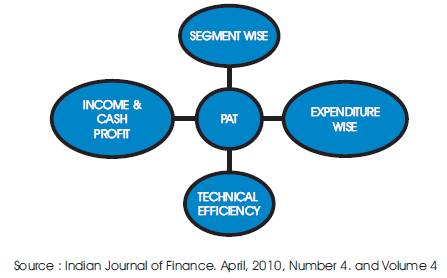
Figure 1. Financial Statement
In this study, the researchers analyzed the financial analysis and profitability position of the Truck Weigh Systems India Pvt Ltd by using the financial reports and other documents given by the company. They had analyzed the perspectives of four directions namely segment wise sales, technical wise, expenditure wise, cash profit and income. The authors found the importance given for the main product and accessories for the main product sales in segment wise sales. Each Direction carries 90 degrees. They also found the good production capacity and controlled stock level in technical analysis. In expenditure analysis, the reasonable expense spent for the production which in turn help to earn good income for the company.
Profit was the main reason for continued existence of every commercial organization and profitability depicts the relationship of the absolute amount of profit with various other factors. Profitability used as a word to describe financial health can be interpreted several ways, but profitability can generally be described as how well a company can get a return on the investments they make. If a company is bringing in more revenue than it costs to create those revenues, then a company can be called profitable.
Profitability can also be labeled as a measurement of business success. So, one could roughly say success = profitability. A Company manufactures a product or renders a service; all its transactions are represented in terms of money. Similarly its performance whether its success or failures, was again evaluated in terms of money. Thus the common denominator was money or finance. The activities of an enterprise-planning, control, operation etc, are all measured in financial terms with the onslaught of competition, growth inflationary pressure and volatile exchange rates.
The analysis of financial statement enables to judge the profitability with the segment wise sales, Income and cash profit, Expenditure, Technical efficiency. In Segment wise, project analyze the individual product sales whereby to know the profit effect. In Expenditure wise two aspects were analyze, which are operating and non-operating expenses.
Next two aspects which analyzed was Income and cash profit which help to know the profitability of company. Fourth direction was Technical wise analysis; where production rate analyzed to know about the profitability. In other terms it implies the 360° FINANCIAL APPRAISAL-4 DIRECTIONAL APPROACH.
Figure 1. Financial Statement
After duly recognizing the importance of financial statement analysis this topic has been chosen as the focus of the project. The analysis of financial statement was a process of evaluating the relationships between component parts of financial statement to obtain a better understanding of the firm's position and performance.
M/s. Truck Weigh Systems India Private Limited is one of the leading manufacturer & suppliers of all types of Electronic Weigh Bridges based at Coimbatore with its Registered Office @ 479B, Avinashi Road, Peelamedu, Coimbatore- 641 004. INDIA, the industrial city of Tamilnadu. The company was registered under the Company's Act 1956 on 15th May 2009.
Initially the company was founded as a firm in the name of WEIGH-TRONIC SYSTEMS in the year 2004. The founders are well qualified Graduate Engineers with extensive experience from MNC of AVERY & ESSAE TEROKA more than 30 years of cumulative experience. With this, the Company manufacture the weigh bridges with high quality & improved specifications at the factory @ Peelamedu Industrial Estate, Peelamedu, Coimbatore. Their installation spreads over entire South India. Now they started entering into the North & West part of our Country. We hope we will be covering the entire country within short span of time. Further we planned to export our products in the near future. We have installed more than 250 weigh bridges in a short span of 6 years.
Now we are in the process of constructing our new factory with 40000 sq.ft to improve our production capacity & to improve the quality of our products by implementing the advanced methods of production, painting & dispatching systems. Also we started our process of getting ISO 9001:2008 to validate our Quality Systems. We have branches @ Chennai, Bangalore (Karnataka), Palakkad (Kerala), Trichy, Madurai & other places to give our customers the immediate service after sales. We also have complete service support setup @ Goa under M/s. Technocrats-Goa for giving immediate support to the customers at Goa region.
We have wide range of products details as given below:
By and large companies are suffering on account of wrong assessment about firms' Sales trend, Inventory availability and Careless ways of approach in maintaining product line. Due to these problems the companies are not able to calculate the future profits; the niche area where in the firm has the scope; where the unnecessary expenditure taking place where necessary expenditure taking place; where and how much materials waste have occurred. Besides, the firms are totally clueless on Income trends and cash profit trends. In order to wipe out these problems, the researcher felt that there is a meticulous approach is required to take in to account the profitability planning and analysis. This meticulous approach is found to be the objectives of the study.
Financial statements provide financial statistics of past events; but they are not forward looking. They don't provide key non-financial information like quality of revenues, types of customers and risk factors. The accuracy of financial information largely depends on how accurately financial statements are prepared. With regard to Ratio analysis, the differences in the definitions of items in the balance sheet and the Profit and Loss statement make the interpretation of ratios difficult. More over the past financial statements are no indicators of the future.( I.M.Ponday, 2005).
There were a lot of studies done previously in support of researcher's topic. Some of the studies related to profitability are highlighted below.
Source: http://www.profitentree.com/previous financialresearch_ profitability.htm.
Source : http : // www. profit entree. com / articles _ profitability.htm
This study was found to be different in the sense of studying four directions namely Segment wise sales, Expenditure wise, Income and cash profit, Technical efficiency. In segment wise direction, an individual product sale was analyzed to know which product gives more profit to the company. In expenditure wise direction, Operating and Non-operating expenses were analyzed to know where the company spent more. In Income and cash profit direction, the sale and income performance of the company was analyzed. In technical wise direction, production rate and stock level performance of the company was analyzed.
Preparation of Research Design is stating the conceptual structure within which research has been conducted. The research design used for this project was Analytical research. Analytical research describes and interprets the past or recent past from selected sources. The sources may be documents preserved in collections. Researcher had chosen the analytical research because, research pertaining to financial performance analyzed the past years data (Kothari C R, 2007).
The method of data collection was secondary in nature.
The details for the last five years were collected from the company. The sources were Annual Statement of Account, Annual Stock statement and Annual Reports.
The data collected from the period of 2005-06 to 2009-10.
No sample method is adopted, but case study based method is used for the research.
A case study is an analytical piece. It involves heavy research and application of theories, concepts, and knowledge commonly discussed in the field of study. It highlights common problems in the field and will illuminate those problems through the in-depth study of its application to one individual, one company, one government, or one of whatever the studies.
The statistical tools used in the project are Percentage and Correlation.
Percentage analysis is used for the data that is collected for the research work. Percentages are often used in data presentation for simplifying numbers through the use of percentages.
The Partial Correlations procedure computes partial correlation coefficients that describe the linear relationship between two variables while controlling for the effects of one or more additional variables. Correlations are measures of linear association. Two variables can be perfectly related, but if the relationship is not linear, a correlation coefficient is not an appropriate statistic for measuring their association.
Introduction of the study tells about the project, why the project was worth doing and how it fulfills the objective of the study. Objective of the study tells about the research analysis. Statement of the problem shows the kind of problem which may arise when the research is not studied. Limitation of the study shows the difficulties of the research. Review of literature tells the past study on research and uniqueness of the present study. Methodology tells the type of research selected for the study.
In Segment wise individual product sales were analyzed. In Expenditure wise, operating and Non-Operating expenses were analyzed. Income and cash profit was analyzed to know the performance of the company. In Technical wise, production rate and stock level were analyzed.
The segment wise sales percentage as shown in Graph 1, Weigh Bridge sales decreased and then increased was the positive performance of the company (Table 1). Weighing scale sales increased and then decreased shows the less importance to other product than main product sales (Table 2). Indicator and load cell sales increased then decreased shows the good quality implementation and good performance of the company. Accessories sales increased year after year shows that the company satisfied the customers with all accessories as need, in turn shows good performance of the company. Thus it implies positive approach and profitability increase result in the growth of the company.
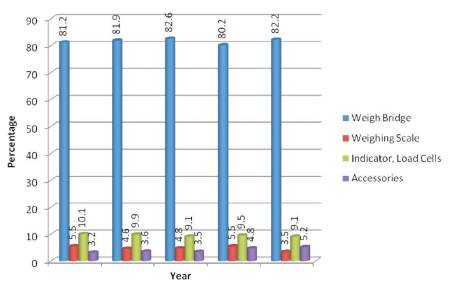
Graph 1. Percentage of Sales
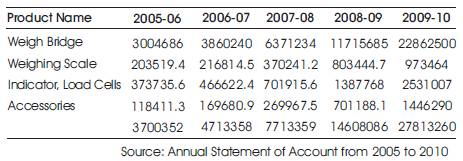
Table 1. Showing Segmentwise Sales Analysis
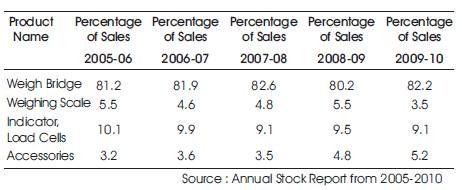
Table 2. Showing the Percentage of Sales
In Technical wise direction, production rate of the company was analyzed. There was slight decrease in 2008-09 but great improvement in 2009-10 (Table 3). It implies that the company was good in performance thus the production rate is very good year after year. Their capacity level and production rate increase shows the good target and the performance of the company (Table 4, Graph 2).
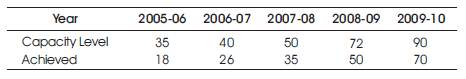
Table 3. Showing Technical Wise Analyses
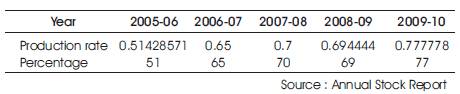
Table 4. Showing Production Rate Percentage
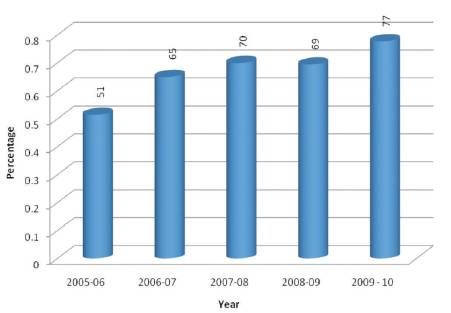
Graph 2. product rate of the Company
Again in technical wise direction, stock level of the company was analyzed. Stock level increased at 2008-09 and it decreased at 2009-10. This decrease implies that the company utilizes the entire inventory properly and reduces the wastage. Thus the company's decreased stock level and increased production rate shows the good profitability performance of the company (Table 5, Graph 3).
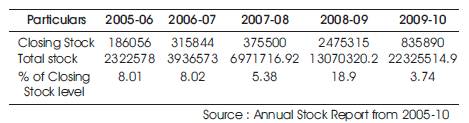
Table 5. Showing Stock Level Details
Graph 3. Percentage of Closing Stock
In expenditure wise analysis, two aspects are considered to analyze which are Operating and Non-operating expenses (Tables 6 &7). Graph 4 shows the percentage of Operating expense increased gradually, it implies positive performance of the company. Non-Operating expense decreased gradually shows the company is reducing the cost of non-operating expenses. Thus the profitability of the company is good as per expenditure wise.
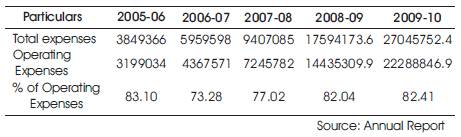
Table 6. Showing Operating Expenses Details
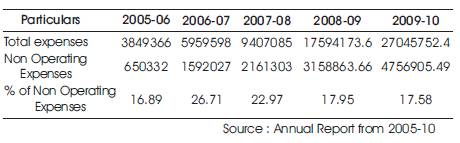
Table 7. Showing Non-Operating Expenses Details
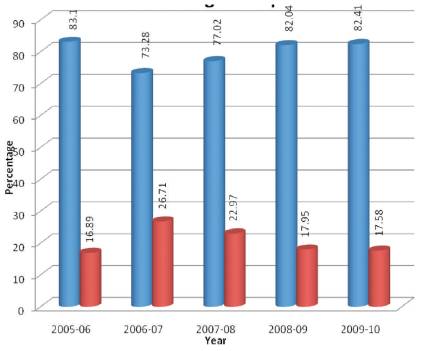
Graph 4. Percentage of Expenses
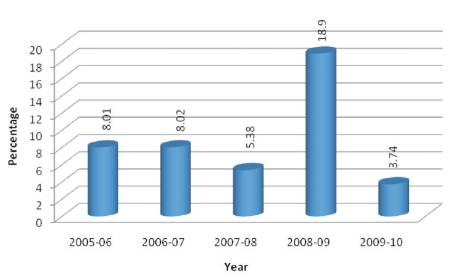
In Cash profit analysis, there was a fluctuation year after year but in the year of 2009-10 there was a good increase in cash profit then before, it refers positive performance of the company (Table 8, Graph 5).
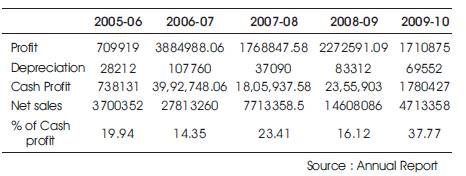
Table 8. Showing Cash Profit
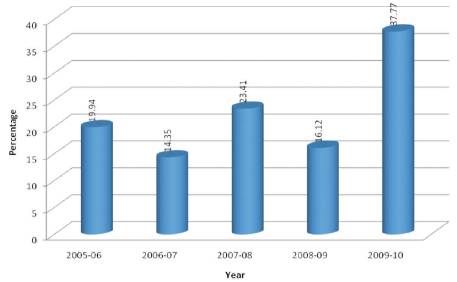
Graph 5. Percentage of Cash Profit
In Income analysis, there was a slight decrease and increase happened year after year but not a big difference in numbers. In the year of 2009-10 percentage of income increased very high shows the good performance and profitability of the company (Table 9). Thus it implies Truck Weigh System was profit gaining company (Graph 6).
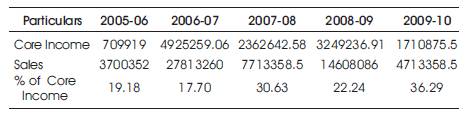
Table 9. Showing Income Details
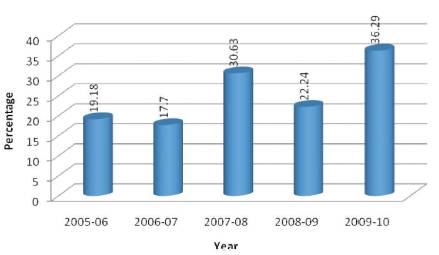
Graph 6. Percentage of Core Income
Partial correlation: Partial correlation is the relationship between two variables while controlling for a third variable. The purpose is to find the unique variance between two variables while eliminating the variance from a third variable. The partial correlation co-efficient varies between -1 and +1. Its calculation is based on the simple correlation co-efficient (Table 10).
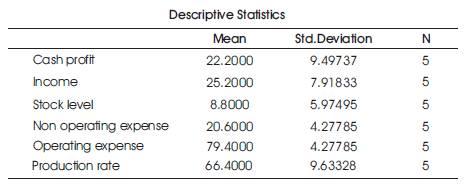
Table 10. Showing Mean and Standard Deviation Analysis
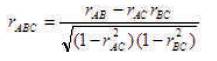
The partial correlation of A and B adjusted for C is:
From Table 11, it was inferred that all variables correlate each other. As per correlation range the values are between -1 to +1. Thus correlation of variables shows the profitability and positive performance of the company.
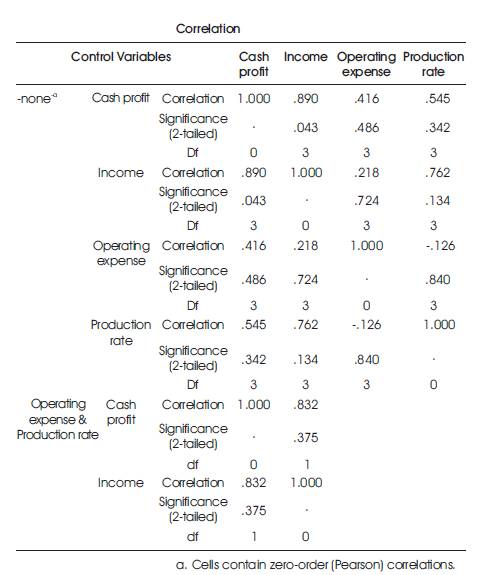
Table 11. Showing The Correlation of Variables
The following are the findings of Study on 360° Financial Appraisal-4 Directional Approach.
In Segment wise analysis, researcher finds that the sales of weighbridge is maximum, Accessories sales increasing every year, weighing scale and load cell sales is normal. This Individual product sales percentage reveals that the company concentrates well in main product and its spares.
In Technical wise analysis, researcher finds that the production rate increasing and closing stock level is decreasing year after year. This finding implies good production capacity and control in closing stock level. In Expenditure wise analysis, researcher finds that the operating expenses are increasing and non operating expenses are decreasing. This finding shows that the company spent more amounts on operations and maintenance and less on non operating Expenses.
In Cash profit and Income analysis, researcher finds the reflection of above three directions. Production rate, sales and operating expenses are good so there is an increasing level of cash profit and income.
Source: http://sloanreview.mit.edu/the-magazine/2011- winter/52216/increasing-profits-sans-pain
In partial correlation analysis, researcher finds the entire variable correlate each other under two tailed significant test in zero order Pearson correlation. From this correlation of variables it is find good performance of the company.
Researcher finds the good performance and profitability of Truck Weigh Systems India Private Limited from the 360° financial appraisal- 4 directional approach.
To conclude from the financial appraisal, researcher had analyzed the perspectives of four directions namely segment wise sales, technical wise, expenditure wise, cash profit and income. Researcher found that the importance given for the main product and accessories for the main product sales in segment wise sales. Researcher came to know the good production capacity and controlled stock level in technical analysis. In expenditure analysis, researcher found the reasonable expense spent for the production which in turn helps to earn good income for the company. These four direction analysis concluded that Truck Weigh Systems India Private Limited is profit producing company and their performance is positive and good going from the financial appraisal.
Thus the topic 360° financial appraisal-4 directional approach helped the researcher to analyze the profitability and performance of the company very easily.