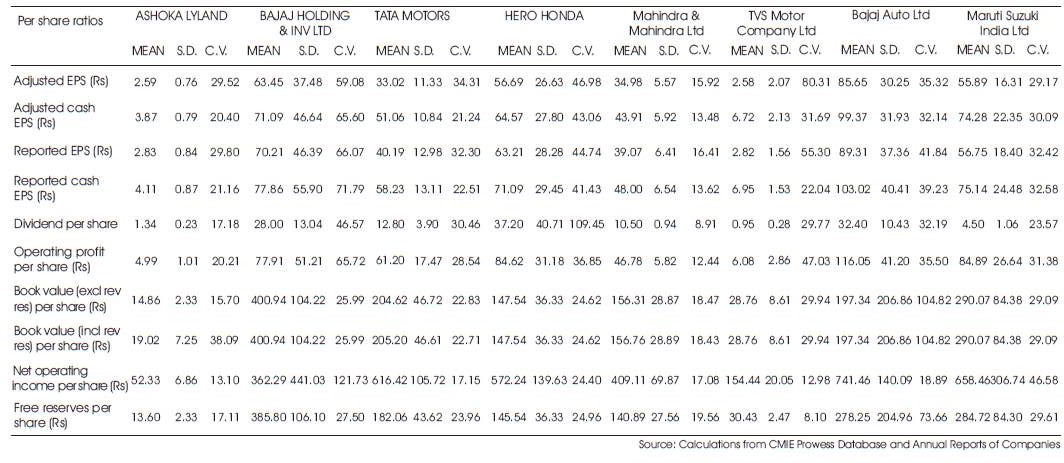
Table 1. Per Share ratios of selected automobiles companies
The present study focuses on operational and financial performance of Indian automobile sector taking into account 8 major auto manufacturing companies. The automotive industry of India rank is the 5th of emerging countries, after Korea, Brazil, Mexico and China. The study also sheds light on the actual economic dynamics of the phenomenon of industrial emergence, especially on how firms and the industry in the country have followed specific technological and competition vs. partnerships strategies, the achievement and outcome of those strategies, the way companies both domestic and foreign in the car business have been able to catch up with the standards set by world leading companies. The study highlights the trajectories of exiting from former centralized models of industrialization in different countries. In that respect, India largely shows a companies-driven trajectory of competition and diversification despite some remaining factors of protection. So far the profitability ratios are concerned, Operating margin, Gross margin, Net margin and Adjusted cash margin found very high in the Bajaj Holding and Investment Co. Ltd. with high volatility as the mean value and CV of these ratios were very high. Moreover, the study concluded that Short-term financial position of Maruti Suzuki India Ltd seems to very good as compared to other selected companies. The study reported highest dividend payout ratio of Ashoka Leyland followed by Hero Honda Ltd. and Bajaj Holding and Investment Ltd. respectively. Whereas this ratio remained more volatile in the companies viz., Hero Honda India Ltd., TVS Motors Ltd. & Bajaj Holding and Investment ltd. The study stated that Maruti Suzuki India Ltd. had remained in the first position to retain the net earning and cash earning. Subsequently Mahindera & Mahindera and Tata Motors were in the second and third place for retaining earning and cash earnings. The auto sector serves as a good illustration of the linkage between the gradual and phased out opening of economies on the one hand, and the companies' objectives and steps of industrial catching-up on the other. This directly relates to the current question of the existence or not of some room for these industries to take significant market shares of the world market. Finally, the study expects that auto industry is bracing for a slowdown in demand with banks saying that they may be forced to increase loan rates due to monetary policy's reviews from time to time since Jan 2010. Auto manufacture industry sales and new purchases might be affected due to fuel prices rising and high inflation coupled with higher interest rates on loans.
The Indian automobile industry is fully equipped to deliver compelling value to the world in design, engineering and component manufacture. The opportunity for India is to plug into all aspects of the global value chain. It has also the opportunity and the potential to dramatically increase its share of global automobile market. There are about 700 million vehicles on the road in the world. It is estimated that this vehicle population would grow to about 1.3 billion in the year 2030. Most of this increase of 600 million will come from developing countries. These markets will look for low-cost automobiles. India has the opportunity to meet this need. And, in the process create a huge export market. Companies like Maruti Suzuki, Tata Automobile and Mahindra & Mahindra have demonstrated their ability to address this opportunity. They have proven India's enormous capabilities in this sector. Maruti Suzuki has revolutionaries the passenger car segment. And Mahindra and Mahindra have transformed the rural vehicle segment. It has also demonstrated that a worldclass utility vehicle can be designed, built and sold for just a few thousand dollars. India can also bridge the growing global divide in personal transportation. And, in this process, it would create the basis for a new wealth creation opportunity. India is among few countries that are showing a growth rate of 30% in demand for passenger cars. Rural markets are on the verge of opening up. India's private vehicle ownership is just 6 per 1000 as against 463 per 1000 in USA. The home market for the automobile industry is also growing. This will sustain India's competitiveness in serving other developing markets. Growth in per capita will power the growth of motor vehicle sales. So would the increasing level of urbanization. In the four metro cities, personalized vehicles already form nearly 83 per cent of all vehicles on the roads. By 2020 more than half of India's population is expected to live in urban areas. All this will bring about a dramatic growth in demand (SIAM-2006) . The automobile industry can play a major role in enabling India to attain global leadership. It is the largest industry in the world with revenues of about 1.8 trillion US dollars. Some call it the 'industry of industries'. The industry is rightfully engaged in building new plants, increasing production from existing plants, bringing out new models, exporting more and captivating users in innovative ways. This is critical for global leadership. Of course, there are several challenges in pursuit of this lofty goal. These include: road infrastructure, transportation fuels, technology infrastructure and societal concerns. The automobile industry must factor these concerns and fashion a strategy of comprehensive social partnership. Instead of blaming one another, there is a need for partnership with government, the transportation fuel industry, and providers of other modes of transportation, society leaders and environmentalists. The automobile industry must position itself as an enhancer of economic growth and development, and not merely an enabler of mobility(O'Brien, Peter,1994) .
The automobile industry lists heavy vehicles like the trucks, buses, tempos, tractors, private or commercial passenger cars and two-wheelers. The automobile sector in India underwent a metamorphosis as a result of the liberalization policies by the government since 1991 which included relaxation of the foreign exchange and equity regulations, reduction of tariffs on imports, and refining the banking policies. After the automobile industry opened to direct investment from foreign countries in 1996, global automobile industry majors moved in. Automobile industry in India also received a boost from stringent government auto emission regulations over the past few years. This ensured that vehicles produced in India conformed to the standards of the developed world(PRLog Press Release, 2009) . Indian automobile industry has also become an out sourcing hub for automobile companies worldwide, as indicated by the zooming automobile exports from the country. Today, GM, Ford, Hyundai, Honda, Mitsubishi and Toyota have set up their manufacturing units in India. Due to rapid economic growth and higher disposable income it is believed that the success story of the Indian automobile industry is just beginning. Factors influencing the growth of the auto industry include sales incentives, introduction of new models as well as variants and easy availability of low cost finance with comfortable repayment options continued to increase demand and sales of automobiles (Swaranjeet, 2009). .
The automobile industry, one of the core sectors, has undergone metamorphosis with the advent of new business and manufacturing practices in the light of liberalization and globalization. The sector seems to be optimistic of posting strong sales in the next couple of years in view of a reasonable surge in demand. The competitiveness of the Indian auto industry, by global comparisons of macro environment, policies and cost structure. This has a detailed account on the evolution of the global auto industry. The United States was the first major player from 1900 to 1960, after which Japan took its place as the cost-efficient leader. Cost efficiency being the only real means in as mature an industry as automobiles to retain or improve market share, global auto manufacturers have been sourcing from the developing countries (ICRA, 2003) . ASEAN economies are globally more integrated than India. The current size of Indian and ASEAN market for automobiles is more or less the same but the Indian market has a larger growth potential than the ASEAN market due to the low level of penetration. The labour cost is low in India but the stringent labour regulations erode this advantage ICRA (2004a). The automobile industry has an enormous opportunity for creating new wealth by delivering value to the world and by delivering value to the domestic user. The automobile industry also has the opportunity to contribute in equitable distribution of the wealth so created. This, the industry can do by developing a new paradigm in employment. It further emphasizes that India cannot become a major economic power unless it wins the employment challenge. Today the Indian automobile industry employs half a million people in the organized sector and about ten million people in the unorganized sector and the potential is several times this number SIAM (2004) . the automobile industry as "the industry of industries"(Peter Drucker). During the last few years, the production and management systems have been revolutionized in the automobile industry (Karmokolias, 1990) . One of the major changes in the industry has been the opening up and growth of several emerging markets. India is one of the most important emerging car economies in the world today. The automobile sector is a key player in the global and Indian economy. The global motor vehicle industry (four-wheelers) contributes 5 per cent directly to the total manufacturing employment, 12.9 per cent to the total manufacturing production value and 8.3 per cent to the total industrial investment (Organisation Internationale des Constructeurs d'Automobiles, 2006) , Piplai (2001) examines the effects of liberalisation on the Indian vehicle industry, in terms of production, marketing, export, technology tie-up, product upgradation and profitability. Till the 1940s, the Indian auto industry was non-existent, since automobile was imported from General Motors and Ford. In early 1940s, Hindustan Motors and Premier Auto started, by importing know-how from General Motors and Fiat respectively.
The scope of the study consists of 8 major players in auto manufacturing sector namely, Ashoka Leyland, Bajaj holding and Investment Ltd., Tata Motors, Hero Honda, Mahindra & Mahindra Ltd, TVS Motor Company Ltd, Bajaj Auto Ltd, Maruti Suzuki India Ltd. The data have been collected through secondary sources for the period starting from March 2006 to March 2010. Further the data have been analyzed on the basis of different financial indicators viz., profitability ratios, Financial Ratios, Efficiency Ratio and Liquidity Ratios. The statistical tools like Mean, Standard Deviation and C.V have also been calculated to investigate any variation in areas of profitability, efficiency and overall financial performance of selected Indian auto companies over the period of time.
In order to study the operating, financial and economic performance of the target companies, the various ratios have been pooled under appropriate different heads. Then mean value, standard deviation and coefficient of variance of different ratios were computed to know overall trends in different automobile companies and volatility in respective ratio. The various ratios studied had been grouped under the following heads:
Per Share ratios i.e., adjusted EPS, adjusted cash EPS, reported EPS, reported cash EPS, operating profit per share, net operating profit per share etc were very high in Bajaj Auto ltd., followed by Maruti Suzuki India Ltd., Bajaj Holding and Investment Ltd. & Tata Motors. While these ratios were minimum in the Ashoka Leyland and TVS Motor Co. Ltd. These ratios had remained much unstable in the companies' viz., Bajaj Holding and Investment Ltd. and more consistent in companies like Mahindra & Mahindra and Ashoka Leyland as compare to other selected automobile companies (Table 1).
Dividend per ratio reveals that this ratio was highest in Hero Honda India Ltd., followed by Bajaj Auto Ltd., Bajaj Holding and Investment Ltd. It was lowest in Ashoka Leyland and Maruti Suzuki India Ltd. Further, it reveals that DPS had remained much inconsistent in Hero Honda India Ltd., Bajaj Holding and Investment Ltd. and TVS Motor Company Ltd. Whereas DPS was much volatile in Mahindra & Mahindra and Ashoka Leyland (Table 1).
Book value (exclusive & inclusive general reserve) was very high in Bajaj Holding & Investment Ltd., and subsequently high in three other companies' viz., Maruti Suzuki India Ltd., Tata Motors and Bajaj Auto Ltd. respectively. Where these ratios were lowest in the companies Viz., Ashoka Leyland and TVS Motor Co Ltd. Moreover, these ratios were more volatile in Bajaj Auto Ltd. and more consistent Hero Honda Ltd, Tata Motors and Ashoka Leyland (Table 1).
Profitability ratios Viz., Operating margin, Gross margin, Net margin and Adjusted cash margin have remained very high in the Bajaj Holding and Investment Co. Ltd. with high volatility as the mean value and CV of these ratios were very high. Similarly these ratios mean value was also quite high in Bajaj Auto Ltd and Hero Honda India Ltd. i.e., operating margin 15.38% & 14.55%, Gross margin 13.55% & 13.16 %, net margin 11.29% & 10.49% and adjusted cash margin 12.80% & 10.89 % respectively (Table 2). Whereas the Maruti Suzuki India ltd. have these ratios on the fourth place (Table 2).
Table 1. Per Share ratios of selected automobiles companies
TVS motor company has poor profitability as revealed from operating margin, gross margin, net margin and adjusted cash margin ratio. While these ratios had remained more volatile in the companies viz., TVS Motor Co. Ltd., Bajaj Holding and Investment Ltd. and Tata Motors. Ratios viz., adjusted return to net worth, reported return on net worth & return on long term funds are very high in the Hero Honda India Ltd. Similarly these ratios are subsequently high in the companies viz., Bajaj Auto Ltd., Mahindera & Mahindera and Maruti Suzuki India Ltd. respectively. While these return ratios are lowest in Bajaj Holding and Investment Ltd. and more volatile in the companies viz., TVS Motor Co. Ltd., Bajaj Holding and Investment Ltd.. These ratios have remained more consistent in Maruti Suzuki India Ltd (Table 2).
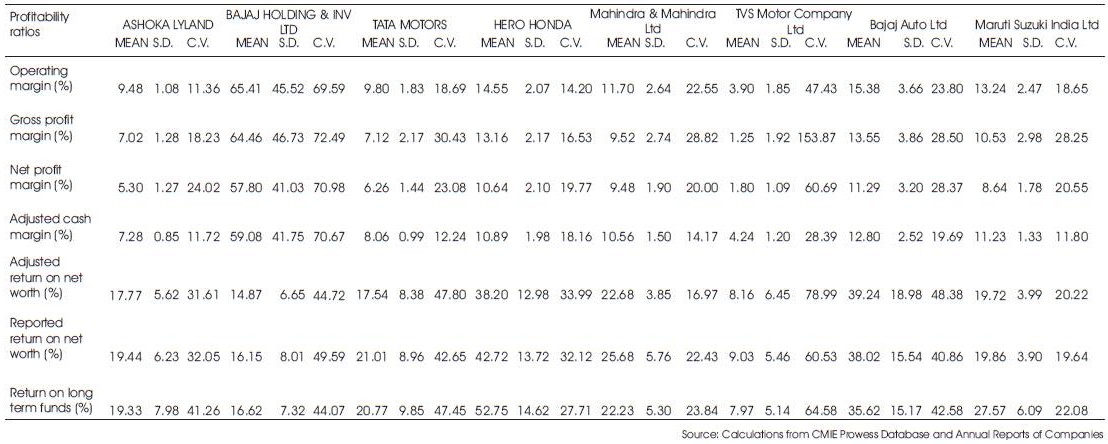
Table 2. Profitability Ratios of selected automobiles companies
Short term financial position of Maruti Suzuki India Ltd seems to very good as compared from other selected companies, as its both average ratios (Current and liquidity) are greater then one with lowest standard deviation and with coefficient of variance between 24 .07 % and 31,63% respectively. Average Current ratio of Ashoka Leyland, Mahindra and Mahindra Ltd and TVS Motor Co. Ltd. is also greater than one, but their quick ratios are less than one. The companies' viz., Ashoka Leyland, TVS Motor Co. Ltd. have minimum Coefficient of variance of current ratio, which shows that these companies have shown consistent performance of short term financial position as measured through current ratio. Whereas quick ratio is highest in Maruti Suzuki India ltd., but the companies Viz., Ashoka Leyland, Mahindra & Mahindra Ltd have lower Coefficient of variance of current ratio and liquidity ratio, which means these ratios, are more consistent in these companies. In overall, we can say that short-term financial position is good in Maruti Suzuki India Ltd, but due to more fluctuation in these ratios risk is higher. Whereas, the companies like Ashoka Leyland and Mahindera and Mahindra, volatility in current and liquidity ratios are lower as their c.v. is smaller from others, which means more consistency in regard to liquidity (Table 3).
Inventory turnover ratio is highest in Hero Honda, followed by Bajaj Auto Ltd. and Maruti Suzuki India Ltd, as their average inventory turnover are 46.26 times, 31.57 times and 26.28 times respectively. Moreover, Hero Honda has shown more consistency after Tata Motors in this ratio as c.v. of this ratio 7.25%. Whereas the c.v. of inventory turnover in Tata motors is 4.83 times respectively. Which means the above three companies, (Bajaj Auto and Maruti Suzuki ) stock much fast as compare to others to convert stock into sales. Whereas Tata Motors and Hero Honda had maintained more consistent sale of their inventory in past as compare to other selected automobile companies (Table 3).
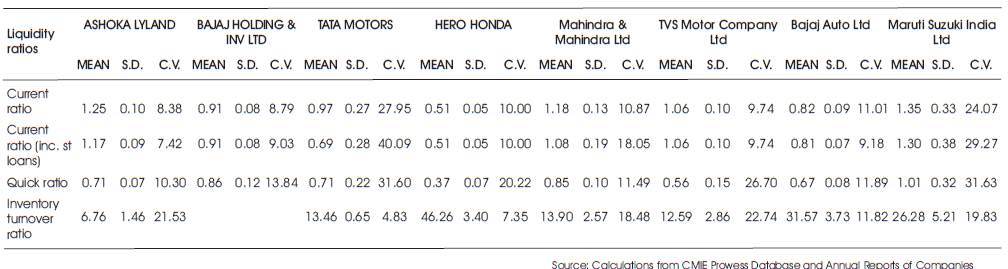
Table 3. Liquidity Ratios of selected automobiles companies
Average Dividend payout ratio as per net profit is highest in Ashoka Leyland (58.72%), followed by Hero Honda Ltd.(58.10%) and Bajaj Holding and Investment ltd. (54.68%). Whereas it is lowest in Maruti Suzuki India Ltd. with 9.40% but more consistent as the coefficient of variance is lowest to 7.78% (Table No1.4) whereas this ratio remained more volatile in the companies viz., Hero Honda India Ltd., TVS Motors ltd. & Bajaj Holding and Investment ltd. as their C.V. are quite higher and more consistent in Maruti Suzuki India ltd., Mahindera & Mahindera and Tata Motors (Table 4).
Average Dividend payout ratio on cash profit is highest in Bajaj Holding and Investment, followed by Hero Honda India ltd. Whereas this ratio is more consistent in the companies viz., Mahindera & Mahindera, Ashoka Leyland and TVS Motors Company Ltd., as their C.V. of this ratio is 5.34 %, 6.35% and 7.56% respectively and more volatile in the companies Hero Honda and Bajaj Holding and Investment ltd (Table 4).
Maruti Suzuki India Ltd. had remained in the first position to retain the net earning and cash earning. Subsequently Mahindera & Mahindera and Tata Motors were in the second and third place for retaining earning and cash earnings (Table 4).
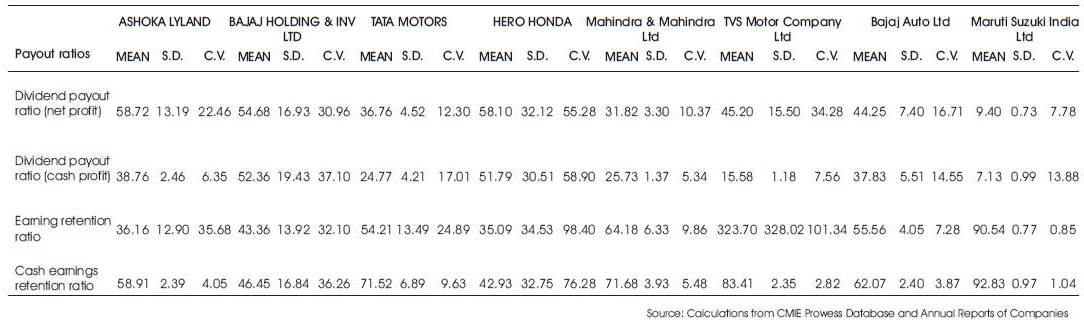
Table 4. Payout ratios of selected automobiles companies
Financial charge coverage ratios before and after tax are very high Bajaj Auto Ltd. i.e., 1185.65 times and 922.09 times. Whereas in the Hero Honda these are second highest with 138.36 times & 112.13 times. In Maruti Suzuki India Ltd., these ratios are third place 80.25 times and 60.31 times. These ratios are lowest in the companies' viz., Tata Motors & TVS Motor Company Ltd. Where these two ratios are more volatile in the companies Mahindera and Mahindera, Ashoka Leyland and TVS Motor Company Ltd & Hero Honda India ltd. as their Coefficient of variance are very high (Table 5).
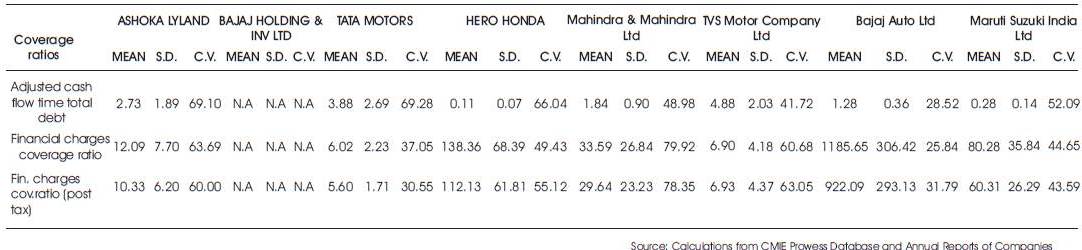
Table 5. Coverage ratios of selected automobiles companies
The ratio adjusted cash flow time total debt is highest in the company TVS Motor Company Ltd with 4.88 times. Tata Motors and Ashoka Leyland have these ratios at second and third place with 3.88 times and 2.73 times. This ratio is minimum in Hero Honda India Ltd. & Maruti Suzuki India Ltd. The coefficients of variances of this ratio are high in the companies' viz., Ashoka Leyland, Tata Motors and Hero Honda India Ltd. It means adjusted cash flow is not consistent throughout the period so it can cover debt payment (Table 5).
Material cost component ratio reveals that in all selected automobile companies, the proportion of material cost of earning had remained between 6 to 7%. The proportion of material cost to earning was highest in Maruti Suzuki India Ltd. and it was subsequently high in Ashoka Leyland and TVS Motor Co. Ltd (Table 6).
In all selected automobile companies except TVS, the proportion of selling cost to earning laid between 3 to 6%. Whereas in TVS motor Co. Ltd., it was highest to 10.70%. Higher coefficient of variance of selling cost component ratio reveals that selling cost was much volatile in Ashoka Leyland, followed by Mahindera & Mahindera. While selling cost was much consistent in Hero Honda ltd. as the C.V was very as compare to other companies. (Table 6).
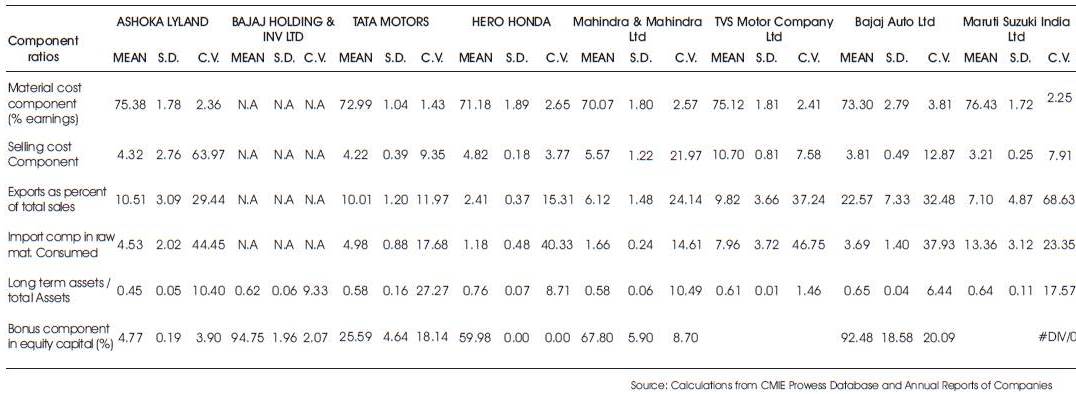
Table 6. Component ratios of selected automobiles companies
Export (in term of percentage) of total sales reflects that Bajaj Auto Ltd.'s export was 20% to 25% of total sales. While export of Ashoka Leyland, a Tata Motors and TVS motor was between 9 % to 11 % of its total sales. An export was lowest in Hero Honda India Ltd.
Export was much volatile in the Maruti Suzuki India Ltd and it was subsequently unstable in TVS Motor Co. Ltd. & Bajaj Auto Ltd. (Table 6).
The proportion of Imported components in total raw material consumption was highest (13.36%) in Maruti Suzuki India Ltd. and subsequently high in TVS Motor Co. Ltd. While in other automobile companies the proportion of import component in total raw material consumption was less than 5%. Proportion of imported raw material in total raw material consumption was minimum in Hero Honda India Ltd. and Mahindra & Mahindra (Table 6).
The proportion of imported raw material in total raw material consumption had remained much fickle in the companies viz., TVS Motors, Ashoka Leyland, Hero Honda Co. Ltd. While this proportion was much consistent in Mahindra & Mahindra & Tata Motors respectively.
Proportion of long-term assets to total assets is highest in Hero Honda India Ltd (0.76), followed by Bajaj Auto ltd. (0.65) and Maruti Suzuki India Ltd. (0.64). This proportion was minimum in the Ashoka Leyland (Table 6).
Coefficient of variance reveals that the proportion of LTA to total assists had remained more volatile in Tata Motors and more consistent in Bajaj Auto Ltd. (Table 6).
Present study was undertaken to know the economic and operational efficiency of the selected companies of automobile industry. The operational and economic efficiency of these companies have been studied through different angles Viz., profitability, return to shareholders, earning on per share, short term and long term financial position, various cost components, their dividend out capacity and earning retention and how they are involved in international financial transaction. The study found high Earning Per Share ratios in Bajaj Auto ltd., followed by Maruti Suzuki India Ltd., Bajaj Holding and Investment Ltd. & Tata Motors and on the other hand these ratios were minimum in case of Ashoka Leyland and TVS Motor Co. Ltd. These ratios had remained much volatile in the companies' viz., Bajaj Holding and Investment Ltd. and more consistent in companies like Mahindra & Mahindra and Ashoka Leyland as compare to other selected automobile companies.
Dividend per share ratio was highest in Hero Honda India Ltd., followed by Bajaj Auto Ltd., Bajaj Holding and Investment Ltd. Book value (exclusive & inclusive general reserve) was very high in Bajaj Holding & Investment Ltd., and subsequently high in three other companies' viz., Maruti Suzuki India Ltd., Tata Motors and Bajaj Auto Ltd. respectively.
So far the profitability ratios are concerned, Operating margin, Gross margin, Net margin and Adjusted cash margin found very high in the Bajaj Holding and Investment Co. Ltd. with high volatility as the mean value and CV of these ratios were very high. Similarly these ratios mean value was also quite high in Bajaj Auto Ltd and Hero Honda India Ltd. Whereas the Maruti Suzuki India ltd. had these ratios on the fourth place.
Furthermore the profitability ratios reported more volatility in the companies' viz., TVS Motor Co. Ltd., Bajaj Holding and Investment Ltd. and Tata Motors.
The study also found that, adjusted return to net worth, reported return on net worth & return on long term funds are very high in the Hero Honda India Ltd. Similarly these ratios are subsequently high in the companies viz., Bajaj Auto Ltd., Mahindra & Mahindra and Maruti Suzuki India Ltd. respectively.
Short-term financial position of Maruti Suzuki India Ltd seems to very good as compared to other selected companies.
Companies like, Hero Honda, Bajaj Auto Ltd. and Maruti Suzuki India Ltd were able to convert inventory into sales much faster. While Tata Motors and Hero Honda had maintained more consistent sale of their inventory in past as compared to other selected automobile companies.
The study reported highest Dividend payout ratio of Ashoka Leyland followed by Hero Honda Ltd. and Bajaj Holding and Investment ltd. respectively. Whereas this ratio remained more volatile in the companies viz., Hero Honda India Ltd., TVS Motors Ltd. & Bajaj Holding and Investment ltd.
The study stated that Maruti Suzuki India Ltd. had remained in the first position to retain the net earning and cash earning. Subsequently Mahindra & Mahindra and Tata Motors were in the second and third place for retaining earning and cash earnings.
Further it is found that financial charge coverage ratios before and after tax were very high in Bajaj Auto Ltd. whereas in the Hero Honda and Maruti Suzuki India Ltd., these were second and third highest. Coverage ratios are more volatile in the companies Mahindera and Mahindera, Ashoka Leyland and TVS Motor Company Ltd. The proportion of Imported components in total raw material consumption was found highest in Maruti Suzuki India Ltd. and subsequently high in TVS Motor Co. Ltd. Proportion of imported raw material in total raw material consumption was minimum in Hero Honda India Ltd. and Mahindra & Mahindra.
The proportion of imported raw material in total raw material consumption had remained much fickle in the companies viz., TVS Motors, Ashoka Leyland, Hero Honda Co. Ltd.
Proportion of long-term assets to total assets is highest in Hero Honda India Ltd., followed by Bajaj Auto ltd. and Maruti Suzuki India Ltd. This proportion was minimum in the Ashoka Leyland. Coefficient of variance reveals that the proportion of Long Term Assets to total assets was remained more volatile in Tata Motors and more consistent in Bajaj Auto Ltd.