Figure 1. Enabler-result model
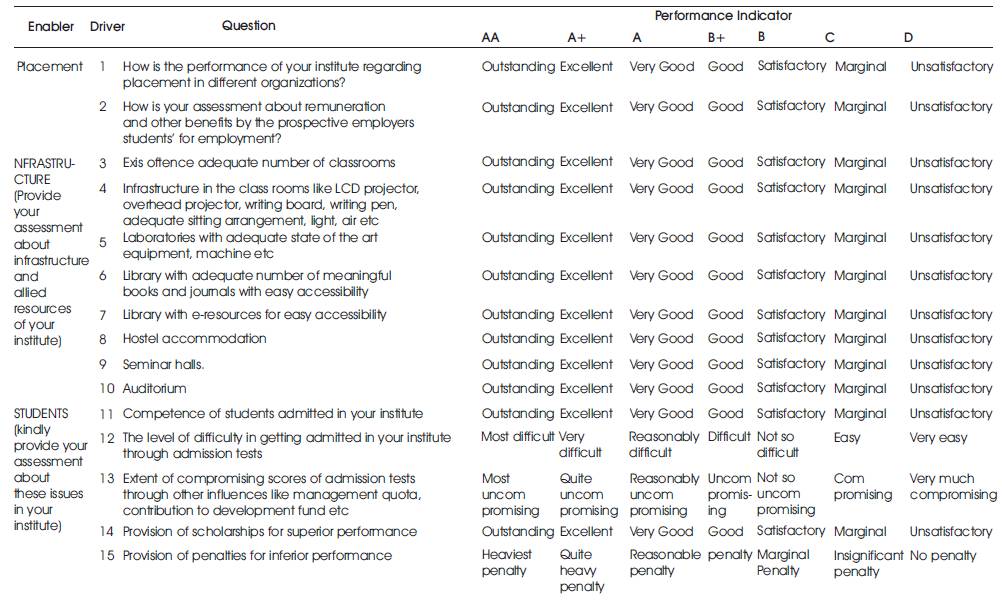
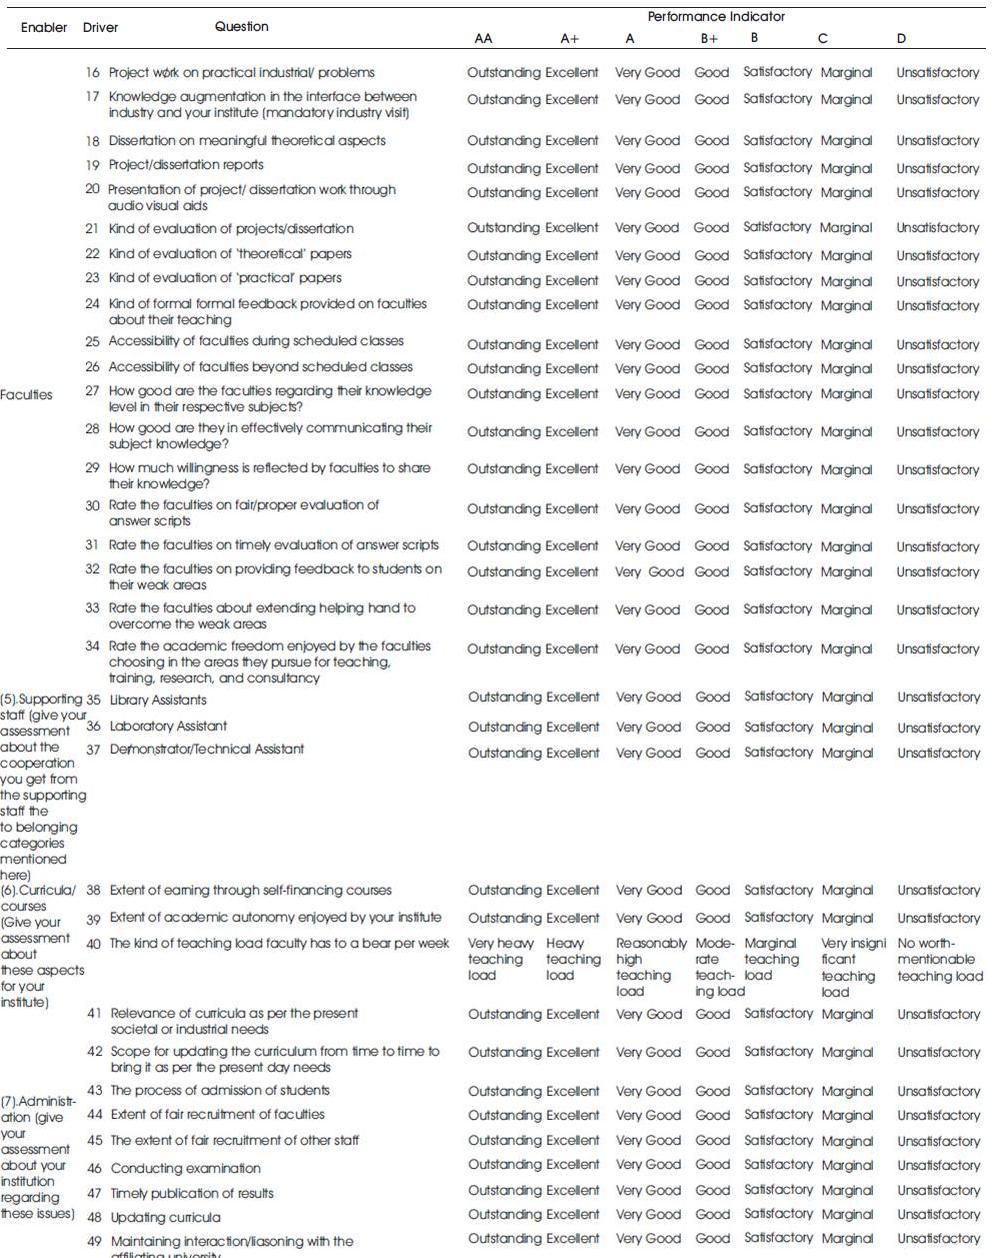
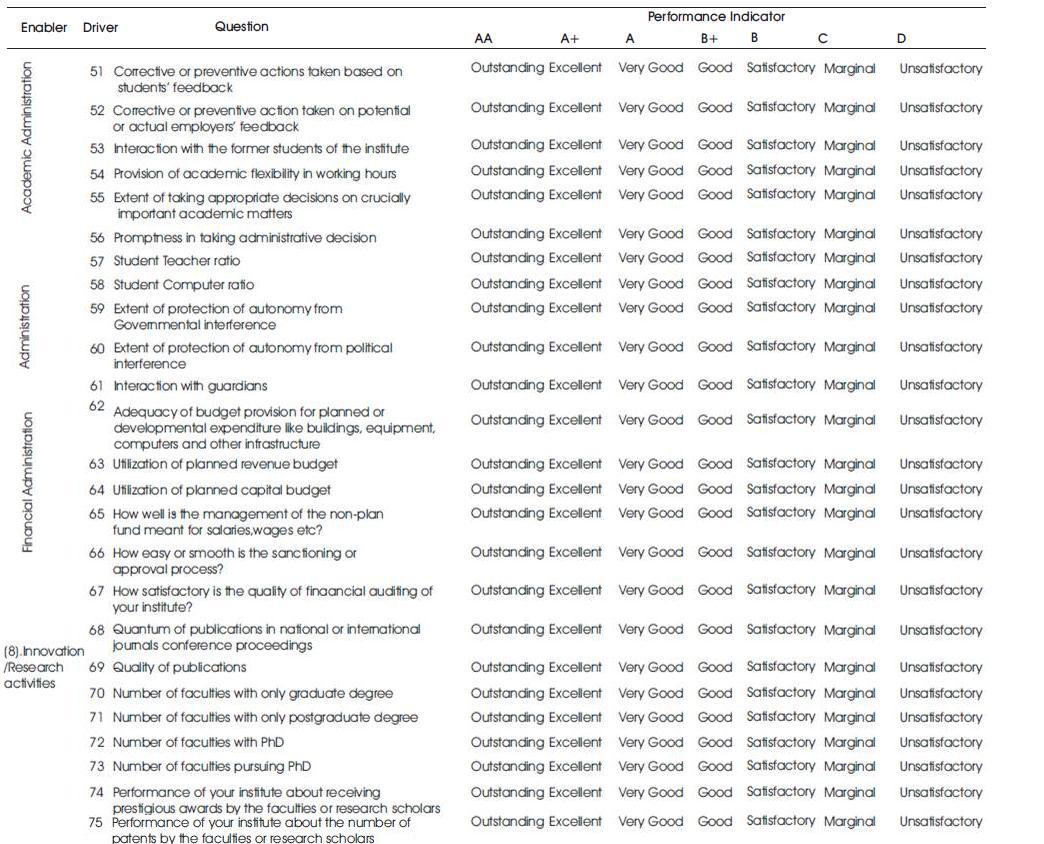
The study has been done on the basis of survey questionnaire in the Engineering departments (under graduate) of Indian Institute of Technology, Kanpur to measure the current or baseline departmental performance level. The feedback for this survey questionnaire has been considered independently for service providers such as administrators, faculties, other supporting staff as well as students who receive these services and are direct customers. A total of 116 persons have been surveyed from the 6 departments. The baseline or current performance level of the departments has been assessed based on the sigma level through quantification of the survey questionnaire consisting of eight enablers. Each enabler contains several questions or drivers. A total of 75 drivers have been arrived for 8 enablers. A seven-point scale has been designed for each driver ranging from “Unsatisfactory” to “Outstanding”. To identify the weak areas for a department, the vital few drivers that correspond to “Unsatisfactory” performance have been found to take necessary remedial measures for attaining the new benchmark sigma level under the present techno-economic set up.
The Indian Institute of Technology, Kanpur has come up in India as the topmost engineering institution. Earlier, the State Government alone patronized Engineering Colleges. However, to meet the growing demand for engineering education, it was a policy decision of the education planners to increase the 'supply' by augmenting the capacity through increasing the number of engineering colleges manifold sponsored by Indian Government. To bridge this gap between demand and supply, one option was to open more Government engineering colleges. But partially due to lack of fund (Chaudhuri, D. et al. 2009, [3]) of State Government constraint and partially due to a tilt toward privatization including, but not restricting to education. Indian Institute of Technology have come up along with a few more Indian Institute of Technology sponsored by Indian Government
The aim of the Institute is to provide meaningful education, to conduct original research of the highest standard and to provide leadership in technological innovation for the industrial growth of the country. The Institute began functioning in 1959 with 100 students and a small faculty. The Institute now has its own sprawling residential campus, about 2255 undergraduate and 1476 postgraduate students, 309 faculties and more than 900 supporting staff. The combined record of its past and present faculty and students along with the alumni spread across the world is awe-inspiring. With the path-breaking innovations in both its curriculum and research, the Institute is rapidly gaining a legendary reputation (http://www.iitk.ac.in/infocell/iitk/newhtml/history.htm) [15].
In this circumstance, it has been decided to undertake this study to assess the 'as is' situation of the departments in Indian Institute of Technology, Kanpur measured through baseline sigma level obtained from survey questionnaire. Side by side, identification of vital few weak areas has been made through application of Pareto Analysis of Defects Per Million Opportunities (DPMO) and benchmark or target sigma levels have been evaluated. It goes without saying that it is possible to achieve the target sigma levels once appropriate remedial measures are taken corresponding to the identified weak areas even under the existing set up. Certainly, breakthrough kind of improvement is possible to achieve, provided much better resources and infrastructure are also brought in.
Unlike other industries, for a given system like a University, themselves may deny students as customers the role of specifying their needs (Chaudhuri, D., et al., 2009,[4]). However, the students have expectations about benefits to be derived from University education (MukherJMGT, S.P., 1996, [10]). Keeping this in mind this study has been undertaken with the following objectives.
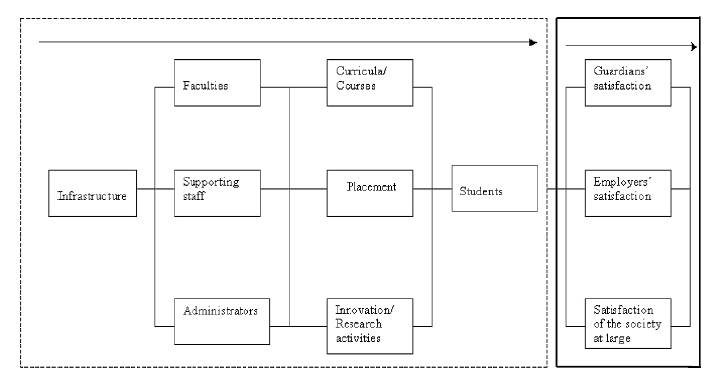
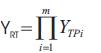
A questionnaire has been designed to survey the perceptions of different stakeholders (faculties, students administrators and other supporting staff) taking cue from the paper (Parasuraman, A., 1988.[13]), [Nigevekar, (1996)] that discussed five dimensions for assessing service quality [SERVQUAL] consisting of tangibles, reliability, responsiveness, assurance, and empathy. The enabler-result model that influences the key performance results of a department for different indirect customers like guardians, employers and the society at large is depicted in Figure 1
Figure 1. Enabler-result model
It can be seen in Annexure 1 that appropriate drivers or questions drive the enablers. For each driver, driving an enabler, a seven-point scale has been developed ranging from 'outstanding' to 'unsatisfactory' in line with the Likert Scale (Helander, M.(2006),[7], (Harry et.al (2010)).
For the sake of convenience in conducting the survey, a scoring scheme has been evolved for mapping the corresponding level of the responses ranging from 'outstanding' to 'unsatisfactory'. The scoring scheme is given in Table 1.
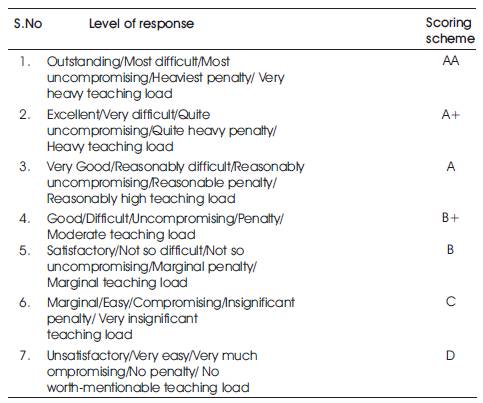
Table 1. Scoring scheme for the responses for drivers
The names of departments, out of 10, falling in different categories –'excellent',' very good', 'good', and 'so so'- are given in Table 5.
The different departments that have been covered for the sample along with the number of persons surveyed are given in Table 2. It can be seen that a total of 116 persons have been surveyed for the 6 randomly selected departments out of a total of 10 engineering departments and administration of Indian Institute of Technology, Kanpur. Table 3 demonstrates that out of these 116 persons surveyed, 53 represent students, 37 represent faculties, 24 represent other supporting staff and 2 represent administrators.
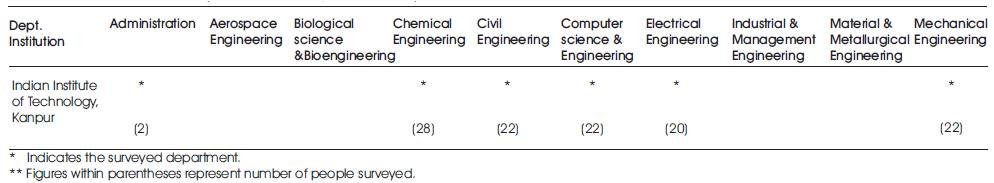
Table 2. Departments and number of persons surveyed.
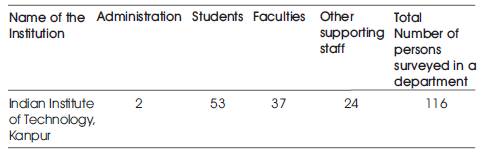
Table 3. Break-up of various persons surveyed
These are the entities that determine how the things are done in a department to have direct bearing on the key performance results.
These are the specific questions framed in a questionnaire corresponding to different 'enablers'. The replies for these drivers are taken in a 7-point scale ranging from 'outstanding' (AA) to 'unsatisfactory' (D).
It is the number of 'D's ('unsatisfactory' tick mark) for an enabler that is responded by different people – faculties, administrator, other supporting staff and students.
It is the number of respondents who have responded in this study for any enabler through survey questionnaires. It can also correspond to the number of filled in questionnaires.
It is the product of number of respondents and number of drivers for an enabler.
Generally speaking, throughput yield is the probability that all defect opportunities produced at a particular step in a process will conform to their respective performance standard. It is the likelihood of doing all things right at a given point in a process (Mukhopadhyay, A.R., & Das, N., 2009,[11]). In the context of this paper, it is the likelihood of not obtaining any 'unsatisfactory' tick mark or 'D's in the survey questionnaire at a given point for any enabler in a particular engineering discipline or department of a college.
Classically speaking, rolled throughput yield is the probability of being able to pass a unit of product through an entire process defect free [Basu, Ron (2004)]. In other words, it is the likelihood of doing all things correct at each step across an entire series of process steps. In the context of this paper, it is the likelihood of not obtaining any 'unsatisfactory' tick mark or 'D's in the survey questionnaire at a given point for all enablers across an entire engineering department of Indian Institute of Technology, Kanpur.
The following summarizes Six Sigma nomenclature, basic relationships, yield relationships, and standardized normal distribution relationships for Z that will be described henceforth:
Basic Relationships

Yield relationships
Standardized Normal Distribution Relationships for Z
Z ST = Z LT +1.5 shift
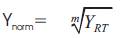
Z Benchmark: Z benchmark = Z Ynorm +1.5
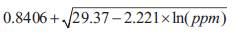
An alternative way to arrive at sigma level is through the following equation.
Sigma quality level with 1.5 sigma shift
It has been found that the sigma level of different departments ranges between 0.885 to 1.915. Accordingly, the categories in which the departments are grouped are given in based on the baseline sigma levels attained by different departments, a ranking of the departments has been made and is furnished in Table 5. Table 5 provides the department-wise ranking, also. In order to identify the root causes for the weak areas or enablers irrespective of any department, Pareto analysis (Juran et al., 1988,[8]) has been carried out for the corresponding drivers. For the sake of convenience, the drivers have been given a serial number irrespective of enablers (see Annexure 1). Based on the Pareto analysis, the “vital few” drivers are found for all the individual departments of Indian Institute of Technology, Kanpur and the corresponding enablers are noted down (Table 6).
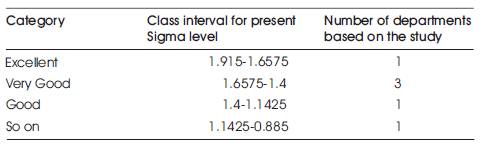
Table 4. Categories of the departments based on the study
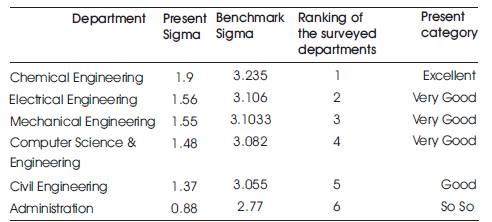
Table 5. Present sigma level and Benchmark Sigma level of engineering departments.
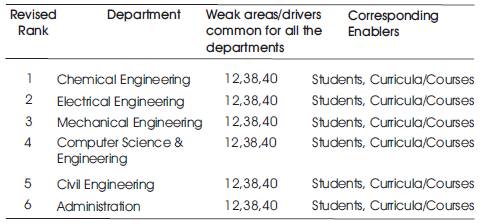
Table 6. Weak Areas or Vital Few drivers of the Engineering departments.
The overall ratings (sigma levels) of the departments in Indian Institute of Technology, Kanpur range from 0.885 to 1.915, which is far away from the sigma level (4) of an average organization in USA (Harry et al., 2010,[6]).
It is possible for a department to attain at least the benchmark sigma level mentioned in Table 5 by adopting appropriate remedial measures with respect to the identified weak areas in Table 6. The possible remedial measures are given in Table 7.
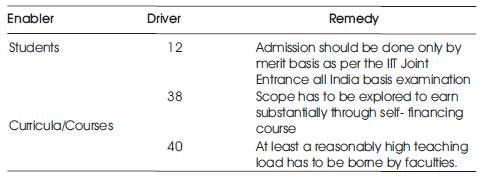
Table 7. The possible remedial measures for identified weak areas
Instead of going by the popular perception of the Indian Institute of Technology, Kanpur, it is much better to categorize the departments based on the class intervals of baseline sigma levels as demonstrated in Table 4.
It is always preferable to evaluate and categorize the departments based on objective criteria like computation of baseline sigma level that has been demonstrated in this paper
It is also recommended that the 'excellent' departments, as per present sigma level, should enhance their intake to give more chance the students for admission in such departments.
Appendix 1