(1)
An index is a significant barometer for the performance of market and an ideal investment tool. This is a market benchmark which gives a sufficient input to the investors to make an investment decision. Commodity Spot market throughout the country is not integrated. Thus spot price varies significantly with geographical location. This way of determination of spot price by various agencies does not justify the price being market representative. Thus index based on spot price cannot be true indicator. Since the commodity future market is running on electronic based online trading system which makes the geographical constraint irrelevant for true price discovery, thus constructing an index on future is more appropriate than on spot commodity market. In this paper the author has constructed a futures index to represent the market view.
To make an investment decision into any asset the primary objective is to know the future performance of that investment. The decision is solely made on the benchmark guiding indicator i.e INDEX. Here is the need for an INDEX. An Index is used to give information about the price movements of products in the financial, commodities or any other markets. Financial indexes are constructed to measure price movements of stocks, bonds, T-bills and other forms of investments. Stock market indexes are meant to capture the overall behavior of equity markets. A stock market index is created by selecting a group of stocks that are representative of the whole market or a specified sector or segment of the market. An Index is calculated with reference to a base period and a base index value.
There is a unique characteristics of commodity trading is that unlike equity where we see the financial performance of the company by looking at there financial reports. But the same is not in the case of commodities. This makes the benchmark index a more investment decision tool than other investment avenues. Unlike financial market, where financial product like index futures, in Indian commodity market regulator(Forward Market Commission) still do not allow commodity index futures. Thus the only purpose of commodity futures is to measure market sentiment and investors expectation. In financial market the cash trading of equity is very prevalent. It provide excellent price discovery of underlying security. Thus equity based indices like Sensex and nifty is good indicator of market movement.
Unlike any other Commodity futures index (like NCDEX futures Indices, MCX futures indices) which Construct indices on the weighted average prices (on some preassumed logic)of the nearest month expiry contracts for some defined basket of commodities, In this paper the author takes an average of all the live contract in that particular month on rolling basis. Example: The data in Table1 presents the future price of Chilli (Guntur LCA 334) at MCX for the month of March 2006. Four column of the table contains the data of four different contracts. The first row of the Table1 contains the name of expiry month of contract.
In the conventional indices only nearest expiry month is taken into account. i.e., for month of the march index only first column data is taken for index construction. In our index we will take the average of all the live contracts which are prevailing in the market currently. i.e. average of all the four columns of Table1.
LogicTaking only near month data do not factor the future expectation of market into the index. Average of the entire four contract price will also include future expectation thus it makes the index more comprehensive to market expectation.
MeaningAs the markets always behaves in the direction of investors, consumers and speculators` investments. Thus by combining future expectations of all the market participants, index will give more appropriate prediction/indication of market movement.
Weight of each component will be taken on the basis of trade value.
Trade Value= Volume X Contract Value
LogicTrade value will indicate the amount of money transaction in particular commodity. Hence this will indicate the degree of interest in the subject.
MeaningTrade value represents total contract value or in other sense trade value for a particular contract helps an investor to identify what are the contracts which are actively traded with respect to total contract amount.
Constituent of Index
Risk is an important consideration in holding any portfolio. The risk in holding commodity is generally associated with the possibility that realized returns will be less than the returns expected.
Risks can be classified as Systematic risks and Unsystematic risks.
Where,
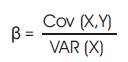
‘Y’ is the returns on your portfolio or stock - DEPENDENT
VARIABLE
‘X’ is the market returns or index - INDEPENDENT VARIABLE
Variance is the square of standard deviation. Covariance is a statistic that measures how two variables co-vary, and is given by:
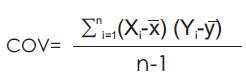
Where, n denotes the total number of observations, and respectively represent the arithmetic averages of x and y. In order to calculate the beta of a portfolio, multiply the weightage of each commodity in the portfolio with its beta value to arrive at the weighted average beta of the portfolio.
Standard Deviation:Standard Deviation is a statistical tool, which measures the variability of returns from the expected value, or volatility. It is denoted by sigma(σ). It is calculated using the formula mentioned below:
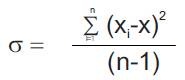
Where, X bar is the sample mean, xi's are the observations (returns), and N is the total number of observations or the sample size.
Beaulieu, Marie-Claude. Journal of Empirical Finance, 1998 in his research report “Time to maturity in the basis of stock market indices: Evidence from the S&P 500 and the MMI” Pages 177-195 focused on the behavior of the basis in stock market index futures contracts over the lifetime of futures contracts. The model in this paper relaxes the cost of carry model assumptions of constant interest rate and known dividend yield over the lifetime of futures contracts. This allows for a test of the presence of time to maturity in the conditional variance of the model using GARCH. The empirical evidence reveals that, consistent with Samuelson's (1995) analysis, time to maturity is a determinant of the conditional variance of the basis. Furthermore, it implies that time to maturity cannot be accounted for by transaction costs or cost of carry. This way this paper says that spot market index even after discounted for transaction cost and cost of carry it do not represent future market. Thus future index would be better representation of future market rather spot index. This above paper explores the necessity of future index. This work is focused into commodity rather equity.
The various research works has been done on correlation between spot and future market indices. Ghosh and Lien (1997) examined the spot and futures index as a cointegrated system. They focused on the short-term dynamic adjustment versus long run equilibrium relationship between these two indexes. They fitted Error Correction Models (ECM) for spot index changes and futures price changes.
Lien and TSE (1999) argue that futures price provides signal for the spot price in the future and Vector Auto regression (VAR) model could incorporate the effects of the futures prices on the spot prices.
Several empirical literatures exist on fractional cointegration. Cheung and Lai (1993) examined the purchasing power parity and found that the deviation from the parity has a long memory, thus may be described by a fractionally integrated process. Baillie and Bollerslev (1994) and Masih and Masih (1996) found similar findings for exchange rate data.
Gulasekaran Rajaguru and Sanja Samirana Pattnayak (1993) found that the evidence of lead and lag (feedback) relationships between spot and futures prices in the short-run while the futures prices are lead by spot prices in the long-run.
From the above papers the necessity of future index is very evident.
There are various commodity indexes that are made to represent the commodity market. The logic of construction of the index is directly related to the purpose of the index.
As per “Wilshire report” published in 2005 by design, the commodity total return indices measure the returns accrued from investing in fully-collateralized nearby commodity futures. Unlike an equity index however, a passive futures index requires regular transactions, which result from the replacement of expiring futures contracts. The weighting method also varies significantly from index to index. Example- the Goldman Sachs Commodity Index (“GSCI”), which is the oldest of the three follow worldwide production as criteria while the Dow-Jones AIG Commodity Index (“DJ-AIG”) keep production secondary while more importance is given to market liquidity. Whereas Deutsche Bank Mean Reversion (“DBLCI-MR”) takes only liquidity in account.
In “COMDEX” The Index used by MCX, Liquidity i.e. number of contracts traded on MCX of individual commodities (including all varieties) in a specified period is taken as eligibility criteria. MCX COMDEX weighting approach is equally relying on factors that are endogenous to the futures market (liquidity on the exchange) and exogenous to the futures market (physical market size). For the purpose of Index computation, only the near month active contract prices are taken for the index computation. The Index base period has been kept as average price of 2001 as it was a normal year.
In this paper the author look at the fractional correlation of the spot and future market and propose the requirement of the future index rather discounting spot index to find future price by various factors.
We will look at the logic of the various indices and their relevance to the decision of the investors. We will further construct an index after taking account of various deficiencies of Indices made.
There are various benchmark indexes in world which has a great significance in making investment strategies of financial planners and corporate. To choose the best suited index for the purpose of planning one should see the logic and mechanism of constituting the index. Here below we are discussing the various commodity indexes and their constitution method to have better understanding of method of construction.
RICI is a composite, USD based, total return index, designed by Jim Rogers on July 31st, 1998. The index was designed to meet the need for consistent investing in a broad-based international vehicle. Index is famous for being one of the most diverse commodity indexes.
It is being calculated from 35 commodities from 11 international exchanges. List of commodities is subject to change by RICI Committee, in general commodity will be considered fit to be included in the index, if it plays a significant role in worldwide (developed and developing countries) consumption. Consumption is measured via tracking international imports/exports pattern. If one particular commodity is being traded on more than one international exchange, the most liquid contract globally, in terms of volume and open interest combined is then aimed to be selected for inclusion in the index.
(Figure 1 –construction of RICI)
Index is divided into 3 sub-indices, which reflect the 3 subsegments of the RICI® - RICI® Agriculture, RICI Energy and RICI Metals.
Sub-indices contributions to main index are
For each commodity most valid (most active traded from committee point of view) expiration is chosen to be included into RICI calculation. Index is being rolled at the end of each month to contracts that are expected to be most active during next month. Generally, if the next calendar month of a futures contract includes a first notice day, a delivery day or historical evidence that liquidity migrates to a next contract month during this period, then the next contract month is intended to be applied to calculate the index – taking legal constraints into account. The Index calculation methodology is reviewed annually by the index committee during its meeting in December and possibly amended thereafter.
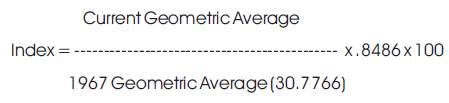
3.1.2 ValuesInitial value of RICI was set at July 31, 1998 to 1000. Since then up to December 2007 index grows up by more than 300% to values of 4000+. Being known as one of the most diversified commodities index, RICI® is known to have very large compound returns.
3.1.3 Total Component Weight calculation during non roll PeriodsThe Total Component Weight (TCW) for any given non-roll date is calculated as the sum of adjusted Daily Contract Prices (DCP), times respective Monthly Contract Weights (MCW). The DCP are adjusted by price scalars reflecting reference currency rates versus the U.S. Dollar such that all DCP adjusted are expressed in U.S. Dollars. For non-roll days we have:

Where

MCWc,t is the Monthly Contract Weight for each Index Component,
DCPc,t is the Daily Contract Price in the local currency,
FXc,t is the Currency exchange rate between the quotation currency of the component instrument and the index reference currency. For official settlement price, the RICI® Index uses a direct or USD cross fixing price.
CRY Factor is +1 or –1.
The Reuters-CRB Index (CCI) was first calculated by Commodity Research Bureau, Inc. in 1957 and made its inaugural appearance in the 1958 CRB Commodity Year Book. The Index was originally comprised of 28 commodities, 26 of which were traded on exchanges in the U.S. and Canada, and two cash markets. In addition to those 26 markets, the Index also included the spot New Orleans cotton and Minneapolis wheat markets which were added to balance some commodities repeated in the Index as by-products of other commodities.
The original base period was 1947-49, the same as the Bureau of Labor Statistics Spot Market Index. This was purposely done to facilitate easy comparison of both spot and futures indexes. The Reuters-CRB Index (CCI) can be viewed as a three-dimensional index. In addition to averaging prices across 17 commodities (two dimensions), the Index also incorporates an average of prices across time, within each commodity.
3.2.1The Reuters-CRB Index (CCI) is computed using a three-step precessa. no contract shall be included in the calculation while in delivery;
b. there shall be a minimum of two contract months for each component commodity (adding contracts beyond the six month window, if necessary);
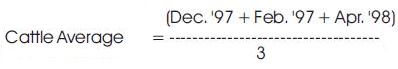
c. There shall be a maximum of five contract months for each commodity (dropping the most deferred contracts to remain at five, if necessary). The result is that the Index extends six to seven months into the future depending on where one is in the current month. For example, live cattle's average price on October 30, 1997 would be computed as follows:
Soybean's average price on October 30, 1997 is:
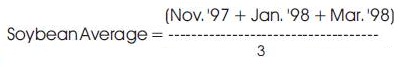

The Reuters-CRB Index (CCI) involves both geometric and arithmetic averaging techniques. Geometric averaging has the statistically attractive property that successive percentage changes in a component's price do not alter that component's relative weight in the Index. Arithmetic averaging, on the other hand, causes the relative weight of a component to increase (or decrease) as that component appreciates (or depreciates) in value.
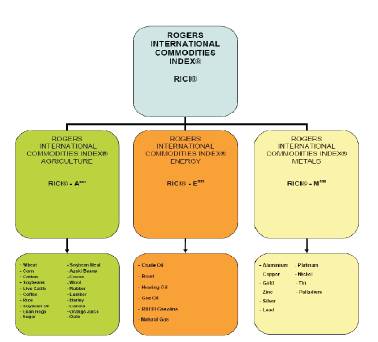
Figure1. Construction of the Rogers International Commodity Index (RICI )
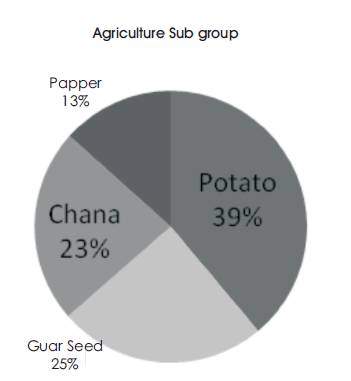
Figure 2. Percentage of Each Commodity in Agriculture Sub group
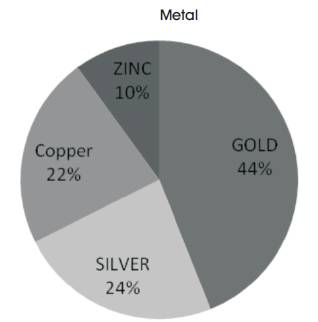
Figure 3. Percentage of Each Commodity in Metals Sub group
The implications of these differences in index computation techniques may be seen in Figure 2 & 3, which reflects four different price scenarios. For convenience, assume that the index is comprised of only three components - X, Y, and Z - and that these components are equally weighted. The base period for each scenario is assumed to be 100.
The S&P GSCI™ (As quoted in Goldman Sachs Group website, 2010 ) is designed to provide investors with a reliable and publicly available benchmark for investment performance in the commodity markets comparable to the S&P 500 or FT equity indices. As such, the S&P GSCI™ is a composite index of commodity sector returns, representing an unleveraged, long-only investment in commodity futures that is broadly diversified across the spectrum of commodities. The returns are calculated on a fully-collateralized basis with full reinvestment. The combination of these attributes provides investors with a representative and realistic picture of realizable returns attainable in the commodities markets.
Individual components qualify for inclusion in the S&P GSCI™ on the basis of liquidity and are weighted by their respective world production quantities. The principles behind the construction of the index are public and designed to allow easy and cost-efficient investment implementation. Possible means of implementation include the purchase of S&P GSCI™ related instruments, such as the S&P GSCI™ futures contract traded on the Chicago Mercantile Exchange (CME) or over-the-counter derivatives, or the direct purchase of the underlying futures.
3.3.1 Economic WeightingThe S&P GSCI™ is world-production weighted; the quantity of each commodity in the index is determined by the average quantity of production in the last five years of available data. Such weighting provides the S&P GSCI™ with significant advantages, both as an economic indicator and as a measure of investment performance.
For use as an economic indicator, the appropriate weight to assign each commodity is in proportion to the amount of that commodity flowing through the economy (i.e., the actual production or consumption of that commodity). For instance, the impact that doubling the price of corn has on inflation and on economic growth depends directly on how much corn is used (or produced) in the economy. From the standpoint of measuring investment per formance, production-weighting is not only appropriate but vital. The key to measuring investment performance in a representative fashion is to weight each asset by the amount of capital dedicated to holding that asset. In equity markets, this representative measurement of investment performance is accomplished through weighting indices by market capitalization. For commodities, there is no direct counterpart to market capitalization. The problem is that commodities, and the related price risks, are held in a variety of ways - long futures positions, over-the-counter investments, long-term fixed-price purchasing contracts, physical inventory at the producer, etc. - making a complete accounting of capital dedicated to holding commodities from the time they are produced to the time they are consumed infeasible. A simple way to achieve a close analogue to true market capitalization, abstracting from differences in inventory patterns, is to note that the net long position of the economy is proportional to the quantity produced - hence, production weighting.
3.3.2 A Broad Spectrum of CommoditiesThe S&P GSCI™ contains as many commodities as possible, with the rules excluding commodities only to retain liquidity and inevitability in the underlying futures markets. Currently, the S&P GSCI™ contains 24 commodities from all commodity sectors: six energy products, five industrial metals, eight agricultural products, three livestock products and two precious metals. This broad range of constituent commodities provides the S&P GSCI™ with a high level of diversification both across subsectors and within each subsector. This diversity minimizes the effects of highly idiosyncratic events, which have large implications for the individual commodity markets, but are muted when aggregated to the level of the S&P GSCI™.
Together, the diversity of its constituent commodities and their economic weighting allow the S&P GSCI™ to respond in a stable way to world economic growth, even as the composition of global growth changes through time. When world growth is dominated by industrialized economies, the metals sector of the S&P GSCI™ generally responds more than the agricultural components. Similarly, when emerging markets dominate world growth, agricultural and petroleum-based commodities generally respond the most. Thus, for example, an index that significantly under weights agriculture would significantly underperform in a global economy with weak OECD and strong emerging markets growth, much like a stock index that only contained industrials would provide a misleading picture of a service-led economy.
As the GSCI transitioned from including Unleaded Gasoline to including RBOB Gasoline, the GSCI contained 25 commodities, seven of which were in the energy sector. This transition period lasted from the August 2006 roll to the October 2006 roll.
Individual commodities are screened by liquidity for inclusion in the S&P GSCI™. The eligibility requirements are designed to promote cost-effective implementation and true investment opportunity. Underlying liquidity eases hedging of derivative products and investing in subsector or individual commodity overlays. Furthermore, liquidity in the underlying futures markets facilitates the discovery of true market prices for the components of the S&P GSCI™.
S&P GSCI™ returns are calculated (discussed in detail in the following section) based on the arithmetic average of stable long positions in futures contracts. This methodology, along with the liquidity in the underlying markets, allows easy implementation of the portfolio of futures contracts that the S&P GSCI™ represents. These characteristics of the GSCI are designed to allow for efficient and relatively inexpensive arbitrage of publicly- traded S&P GSCI™ related instruments such as the CME futures contract.
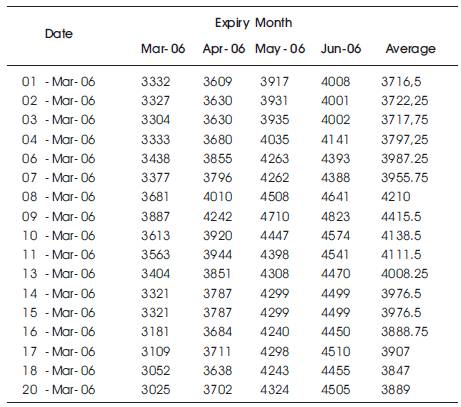
Table 1. Future Price of Chilli (Guntur LCA 334) At MCX for the Month of March 2006
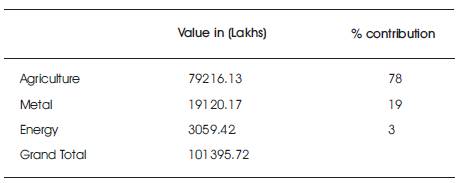
Table 2. Contribution of three sectors on 1st January 2007
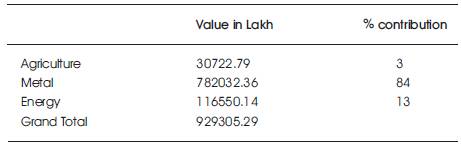
Table 3. Contribution of three sectors on 1st June 2007
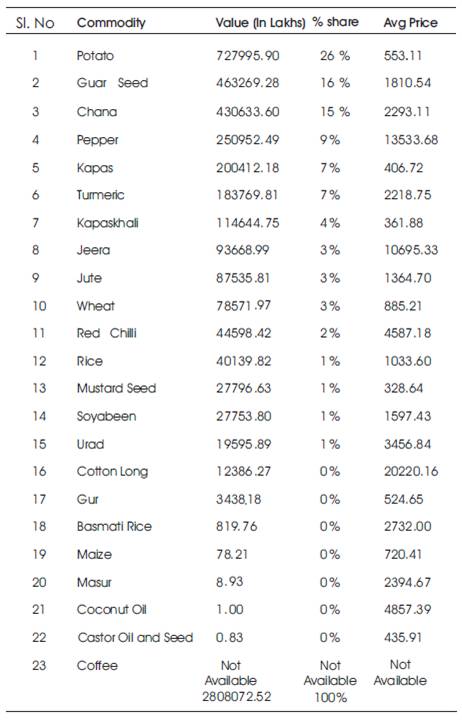
Table 4. Contribution of commodities between 1st Jan to 1st Dec 2007
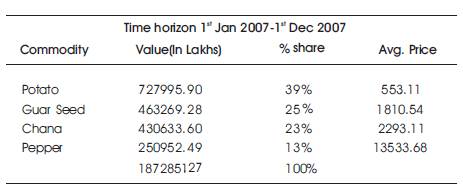
Table 5. Qualifying agri commodities
To construct our own index we are classifying the commodity market into 3 broad sub categories:
Assumption: We are taking the base year as 1 January 2007 and the base value 1000.
We divided the whole spectrum of commodities in three sub group as “RICI “. We took the all the contract on 1st Jan 2007 and on 1st June 2007.
Table 2. gives the details of gross value of each sector when taking all the commodities (even those which were not included in above 10). (Table 2. contribution of three sectors on 1st January 2007). But in contrary on 1st June 2007 the contribution of all the three different sectors are provided in Table 3. (Table 3. contribution of three sectors on 1st Jun 2007). Thus to deal with these kind of dynamics we should take the time horizon rather a cross-section of a day. Thus to determine the constituents and their weight we are taking a time horizon of one year between 1st Jan 2007 to 1st Dec 2007.
The details of contribution Different agri commodities between 1st Jan to 1st Dec 2007 are provided in Table4. (Table 4: contribution of commodities between 1st Jan to 1st Dec 2007).
Taking first four commodities for our index construction on the ground of being value topper in this time horizon. Table 5 provides the details of qualifying agri commodities. (Table 5: qualifying agri commodities).
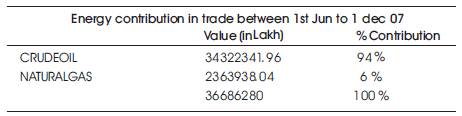
Table 6. Qualifying Energy Commodities
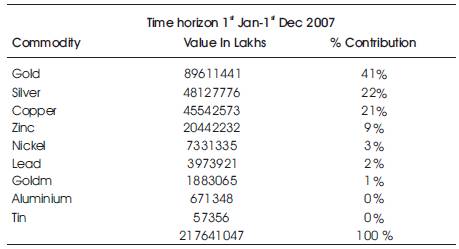
Table 7. Qualifying Metal Commodities
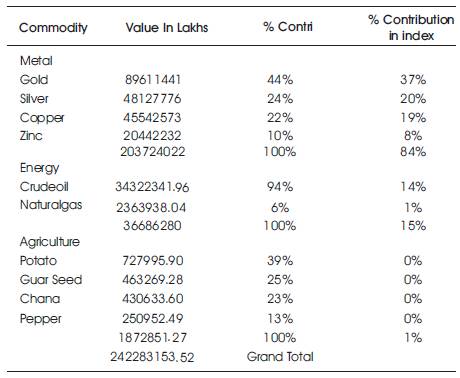
Table 8. Summary of all the three Different sectors
Value topper means those commodities which has being traded in terms of valu. So if we select value toppers (4 commodities) potato has maximum value out of the total values of the selected 4 commodities. Thus its new % share would be 39% among these 4 commodities. We have followed the same thing for both Energy subgroup & Metal Sub groups. Tables 6 & 7 provides the details of Energy and Metal Subgroups respectively.
So here are the members of our Index where we took 4 Agriculture, 4 Metal and 2 energy commodity as our representative commodities in the proportion of their weights (Figure 2).
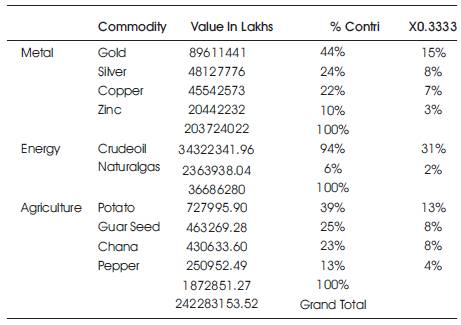
Table 9. Summary of all the three Different sectors After Assigning Equal Weightage of 33.33%
The share of each commodity in agriculture subgroup is represented graphically in Figure 3.
MetalThe share of each commodity in Metals subgroup is represented graphically in Figure 4.
EnergyIn Table8 we can observe that MCX has the contribution of Metal is 84% of total Trade. Energy is 15% of Total Trade, and Agriculture is just 1% of total trade. If the below weightage will be used for constructing the index it would not be represented fairly for all the sectors. So in spite of greater value trade of metal and energy in respect to agriculture, we will give equal weightage to all the three sectors i.e. 33.33% to all sectors. Table 9 provides the details of all the three different after Assigning equal weightage.
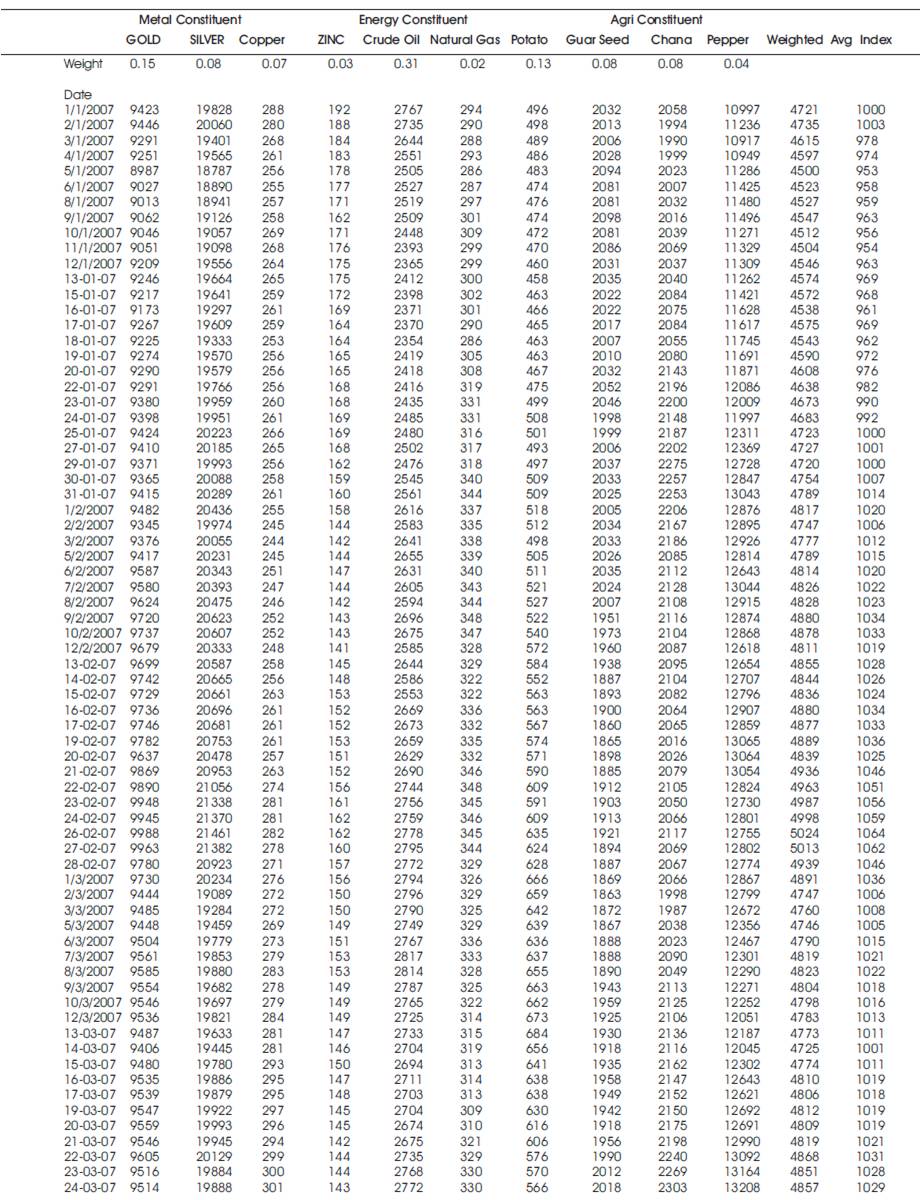
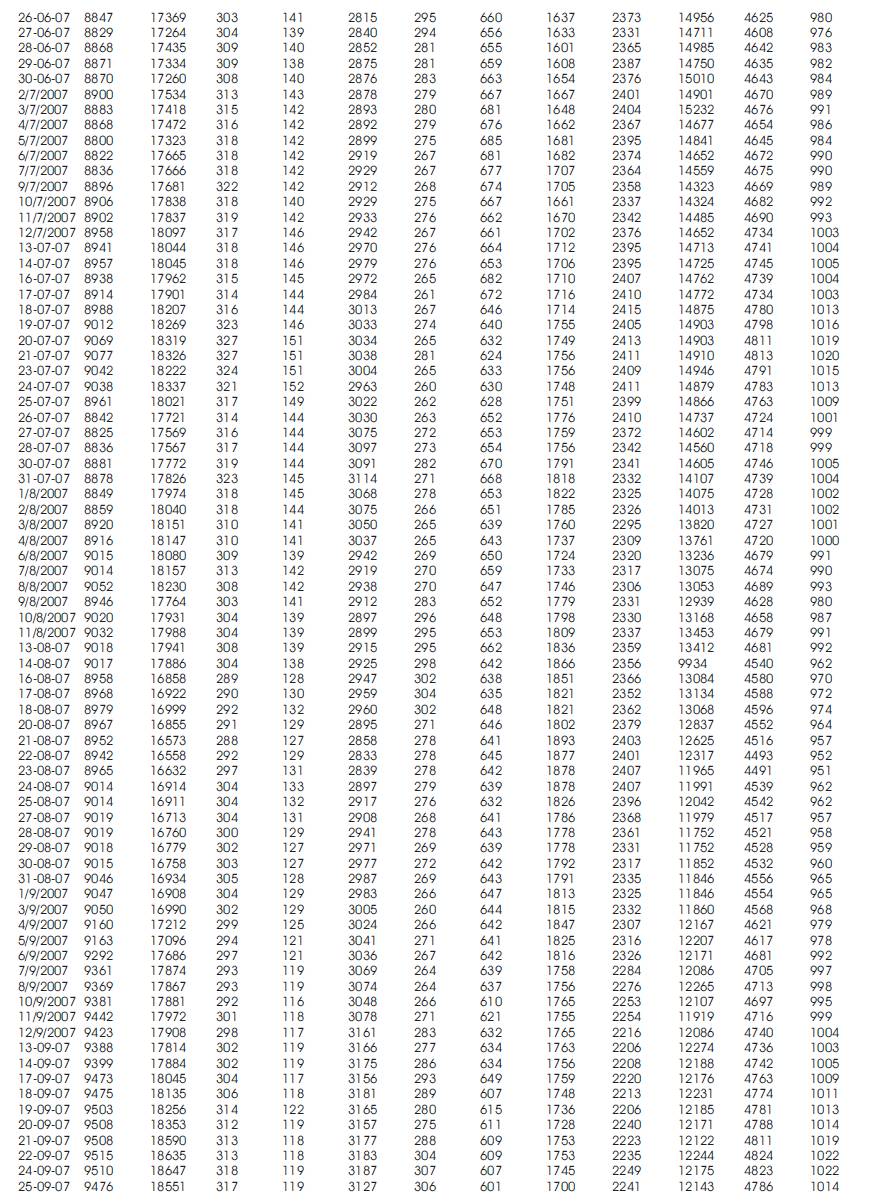
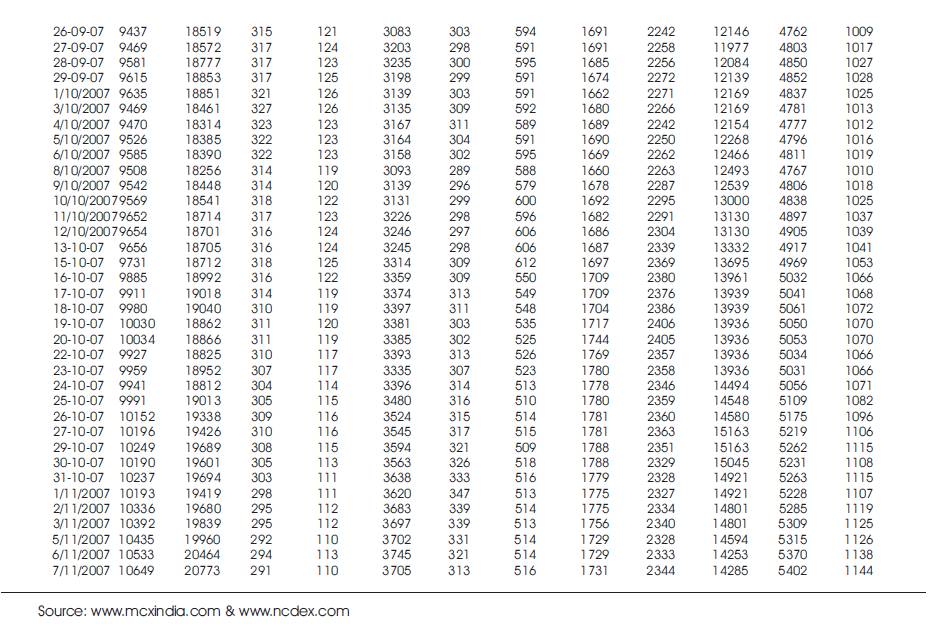
Table10. Calculation of Commodity index
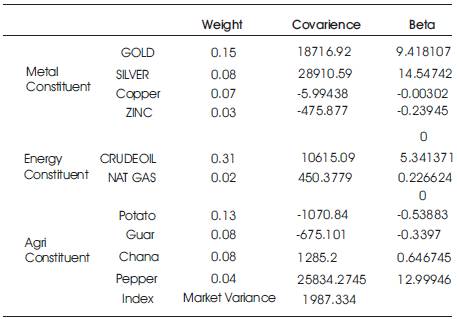
Table11. Calculation of Beta
As we can see now we would like to make it fair index which is proper representative of all the constituents' agri, energy and metals with equal contribution i.e. 33.33%.
We can justify the above with the fact that the use of index is to show the market dynamics.
Even if the value of agricultural product which is traded on the exchange is less, they have significant price dynamics. To capture the price dynamics of each component one should take the component contribution as below:
After making fair distribution of weightage we can identify how much weight particular commodities should contain in their respective groups. Figure 5 gives graphical representation of constituents.
We will take the price of futures for each constituent for all the live contracts and will calculate the average of these prices. This will represent the price of that commodity. Now with keeping the above deduced weightage and determined representative price the index value are calculated.
The value on the date 1st January 2007 will be equated to 1000 and the same multiplying factor will carried till the next re-evaluation of weight of each constituent.
In Table 10 we have calculated index as per above logic and calculation. Last column of Table 10 contains the commodity index value.
Figure 6 shows the commodity average price of the future contract during a time period of first Jan '07 to first Dec'07 including the value of the index.
Figure 7 Graphically shows the constructed commodity Index
Total return of the index over the period between 1st Jan to 1st Dec = (1087-1000)/1000=8.7%
The calculations of Beta Values have been shown in Table 11.
The prices of exchange-traded stocks are available on a continuous basis; hence, construction of index based on this data is simple and possible real-time. Contrarily, prices of commodities (of a particular quality) are not readily available on a continuous basis. To have an index that reflects the fundamentals and is actively tradable, it would be best to construct an index using future, rather than cash, prices in the absence of effective spot exchanges for commodities. However, futures contracts expire on the date of maturity. So in order to have continuous futures prices, commodity indices are constructed such that the futures prices of given maturities are considered and replaced with (rollover to) the subsequent month's contracts.
Since the commodity market is still immature and the volume and value of trade fluctuates very sharply. Sharp contribution change is very much visible in earlier discussion. When we have seen in a time horizon between Jan-Dec, the contribution of agri was just 1%. All this may lead to a very erratic behavior of index.
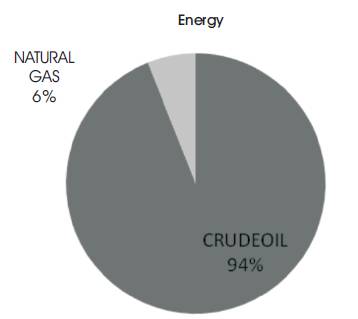
Figure 4. Percentage of Each Commodity in Energy Sub group
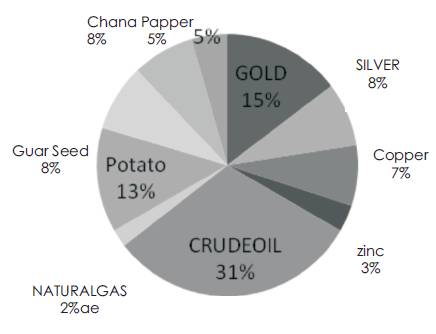
Figure 5. Percentage contribution of Each Commodity in Agri Sub group
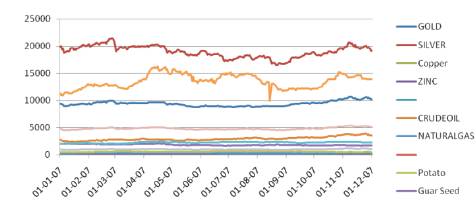
Figure 6. Commodity average price of the future contract
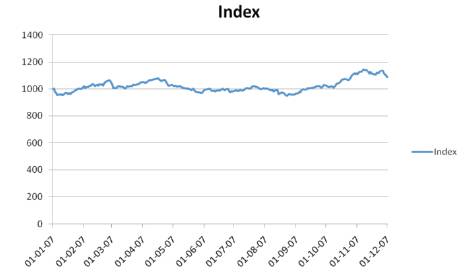
Figure 7. Constructed commodity index
Since the commodity futures market is running on electronic based online trading system which makes the geographical constraint irrelevant for true price discovery. The commodity futures Index which we have developed is more useful to measure market sentiment and investors expectations. This Index will also help analysts to easily trace out the bullish & Bearish Trends of various commodities in Commodity futures Market.
Forward Market Commission : Commodity market
regulator in India
RICI : The Rogers International Commodity Index
RICI-A: The Rogers International Commodity Index
Agriculture
RICI-E : The Rogers International Commodity Index energy
RICI-M :The Rogers International Commodity Index Metal
CCI : Continuous Commodity Index (CCI)
The S&P GSCI™: Goldman sachs Commodity Index.