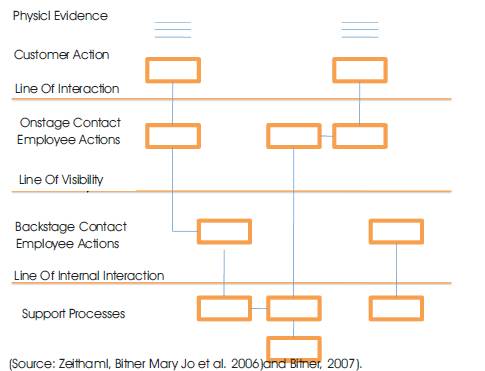
Figure 1. Layers of interaction in service blueprint
“Let not the emphasis of hospitality lie in bed and board; but let truth and love and honor and courtesy flow in all thy deeds” - Ralph Waldo Emerson
Evolution of economies worldwide highlight that the service sector is growing faster than any other sectors. In contrary the productivity and consequently the quality of this sector seems to be declining. Therefore designing the services and its quality is considered as a major challenge in service organizations and especially in those who want to have a customer based design. In this study a new methodology has been proposed to prioritize service process design characteristics (SPDC) based on customer requirements to design a quality service blueprint. Two comprehensive sets of customer requirements and Service Process Design Characteristics were developed, which in turn supports the House of Quality analysis. The proposed methodology was examined at a three star Hotel at Calicut, India. Data was gathered from designed questionnaires and statistically analyzed. After computing the matrix in House of Quality the total values of service process design characteristics was found and prioritized and then after comparing them with the manager's point of view the differences were finally highlighted and a quality service map was developed. The differences between the manager' point of view and the proposed methodology implies that the new methodology is much more effective than the traditional approaches, in which the service process design characteristics were prioritized based on the manager's point of view.
“In order to grow continuously one must act according to customer's needs and desires and not bank on the presumptive longevity of the product”- Theodore Lewitt
Service Sector in India now accounts for more than 50 percent of the gross domestic product. More significant is the growth of the service sector which has been consistently high in India in the last two decades. Average annual growth in services sector in India which was 6.9 percent in the decade of the 1980s (1980-90) rose to 7.9 percent in the next decade (1990-2003). The decadal growth of the Indian service sector in the 1990s is quite high as compared to the world average of 3.2 percent, East Asia and Pacific average of 6.8 percent, and South Asia average of 7 percent. The share of service sector in total GDP in China during the period 1990-2003 moved from 31 percent to 33 percent and in East Asia and Pacific region from 35 percent to 36 percent and in South Asia region from 43percent to 51 percent (Mohana Rao, 2005).
It was said in the 1990's that Globalisation would make the hospitality industry to grow at a faster rate and in India, tourism and hospitality would contribute 10% to the GDP and by the year 2010, it would be 12%. The world tourism organization had made a forecast that globally, international arrivals would reach 1 billion by 2010 and 1.6 billion by 2020 (Nargundkar Rajendra, 2006). India and China were set to become favourite travel destinations. Though the business environment has altered a lot since then, the Indian hotel industry still derives around 65% of its revenues from premium segments which has a share of just 25.82% in terms of number of rooms. The companies operating in the Indian hotel industry are moving up the value chain to management contracts and branding as a part of their de-risking model. Indian hotel industry is fast adopting the technologies such as wireless, online reser vation system and customer relationship management like in the west. In order to mitigate risk due to its seasonality nature and to boost revenues the companies operating in the industry are entering into new emerging areas such as service apartments and Spas (Thakur, et.al 1997). In terms of profitability and occupancy, Bangalore ranks first followed by Delhi and Mumbai. The average room occupancy during 2005-06 is 59.5%. This shows the potential of the industry in the days to come(Shajahan 2009).
Services represent approximately 80 percent of the U.S. GDP and a growing percentage of the GDPs of countries around the world(Kurtz, Clow (2002)). Companies, governments, and universities around the world have recently awakened to the realization that services dominate global economies and economic growth. The fundamental premise is that firms can no longer compete solely on providing superior value through their core products, but rather they must move into the realm of customer experience management, creating long-term, emotional bonds with their customers through the cocreation of memorable experiences potentially involving a constellation of goods and services (Armstrong, 2004). The importance of customer experience management is not only being touted in consumer markets, but also in business-to-business contexts where research shows meaningful customer experiences and the resulting emotional bonds between customers and suppliers are more important than rational motivations in creating customer loyalty( Gilbert and Daun, 2004). The compelling need for service innovation in the world's economies and the current focus of many businesses on creating value through customer experiences suggest a need for innovative methods, techniques, and R&D practices for service(s). This research describes one such technique- service blueprinting a customer-focused approach for ser vice innovation and ser vice improvement. While the rudiments of service blueprinting were introduced two decades ago, the method has evolved significantly as a useful approach for addressing many of the challenges in services design and innovation and is particularly amenable to customer experience design. In comparison to other process-oriented design techniques and tools, service blueprints are first and foremost customer-focused, allowing firms to visualize the service processes, points of customer contact, and the physical evidence associated with their services from their customers' perspective. Blueprints also illuminate and connect the underlying support processes throughout the organization that drive and support customer-focused service execution. To understand the priorities of service process design characteristics, quality function deployment method known as house of quality analysis is used. The house of quality analysis correlates and decided which specific service process design characteristics require improvement and which impede the growth of others, The customer importance ratings multiplied by the Quality function deployment teams significance ratings give the overall weighting, which along with the correlation results determine the priorities of the service process design characteristics(Mitra, 2004). From the priorities the specific processes are taken and from the times gathered for the processes through secondary data collection, their critical path is found out and the blueprint is prepared with the line of visibility, line of invisibility and line of interaction. When the new service process design characteristics priorities are compared with the existing priorities, the study understands the changes needed in the existing service design.
Gronroos (2002) defined it as “A service is an activity or a series of activities, of a more or less intangible nature that normally, but not necessarily, takes place in the interaction between the customer and service employees and/or physical resources or goods and/or systems of the service provider, which are provided as solutions to customer problems”. Service sector is expanding globally. Service quality is a very complex task and it is difficult to measure and design, service quality objectively. The main aim of this paper was to propose a comprehensive and generic approach for quality services design. Shahin (2004) proposed a comprehensive list of Service process design characteristics. The proposed three levels of Service process design characteristics can be applied to any type of service organization.
It has been argued that service quality is the greater differentiator among service providers (Parasuraman et al, 1985; Kandampully et al, 2002 and Warrier S 2009), there has been no agreed definition of service quality. Gronroos divided service quality into three components: technical, functional and image. Juran (1988) stated that the quality of a product or service is determined by its fitness for use by external and internal customers.
Kandampully(2000) has emphasized that quality will be the main driving force of tourism as travel firms strive to meet the competitive challenges of the future. According to the WTO(2003), quality in tourism can be defined as,
“the satisfaction of all legitimate product and service needs, requirements, and expectations of the consumer, at an acceptable price, in conformity with the underlying quality determinants such as safety and security, hygiene, accessibility, transparency, authenticity and harmony of the tourism activity concerned with its human and natural environment”.
Common models for measuring service quality are ServQual model( Parasuraman et al) (the gap model) and the other methods of measuring service quality are the ROQ(return on quality method) and TQM method.
Service blueprinting is a process analysis methodology proposed by Shostack(Shostack, 1982, 1984). Shostack's methodical procedure draws upon time/motions method engineering, PERT/project programming and computer system and software design. The proposed blueprint allows for a quantitative description of critical service elements, such as time, logical sequences of actions and processes, also specifying both actions/events that happen in the time and place of the interaction (front office) and actions/events that are out of the line of visibility for the users, but are fundamental for the service. The layers of interaction in service blueprint is given in Figure 1.
Figure 1. Layers of interaction in service blueprint
Service blueprinting involves the description of all the activities for designing and managing services, including schedule, project plans, detailed representations (such as Use cases) and design plans, or service platforms.
Blueprinting is often supported by methodologies that elicit functional elements of services, as well as their qualitative/implicit characteristics, including TQM techniques, such as Quality Function Deployment(Ramaswamy, 1996), Just in Time, and capacity planning (Hollins, 2006), or IDEF0 (N. Morelli, 2006 and Mundi 2009)
Quality function deployment was developed in Japan between 1965 and 1967 at Matsuhita Electric by Yoji Akao and Shigeru Mizuno. In 1966 Kiyotaka Oshiunil developed the fishbone cause and effect method at the Bridgestone tyre factory in Japan. In 1972 at Kobe shipyard, Mitsubishi Heavy industries, the matrix relationship method was developed. Meanwhile Katsuyoshi Ishihara developed the value engineering principles (Mundi 2009 and Warrier 2009). All these paved way for the incorporation of knowledge about the needs and desires of customers into all stages of the design, manufacture, delivery, and support of products and services and development of QFD. It is an integrated methodology where all relationships and priorities can be understood and reconciled to the benefit of the customer and producer company. It arose out of a need to achieve simultaneously a competitive advantage in quality, cost, and delivery. (QCD)(Dale Barrie “Managing Quality” Chapter 17, Blackwell publishing, 2004, 4th edition, Kundli) Quality function deployment is derived from six Chinese characters with Japanese Kanji pronounciation: Hin Shitsu (Quality), Ki Nou (Function), Ten Kai ( Deployment). The Japanese characters for Hin Shitsu represent quality, attribute or features, Ki Nou represent function or mechanization and Ten Kai represent deployment , diffusion, development or evolution.
Taken together the Japanese characters mean “ How do we understand the quality that our customers expect and make it happen in a dynamic way”( Cohen 1995, Tottie and Lager 1995, Martins and Aspinwall 2001, Chow Chua and Komaran 2002).
Japanese engineer Genichi Taguchi developed new notions about quality engineering. Taguchi's ideas transcend the customary wisdom of tolerance limits, where we implicitly assume that any value for a parameter within the specified range is as good as any other value. Taguchi aims at the ideal optimal value for a parameter in question. (Aczel, Sounderpandyan,“ Complete business statistics” Tata Mc Graw Hill publications, Sixth edition, 2006, New Delhi).
House of quality is a set of matrixes used to relate the voice of the customer to a product's technical requirements, component requirements, process control plans, and manufacturing operations. Building the house of quality consists of six basic steps:
Step 1: Identify customer requirements
Step 2: Identify technical requirements
Step 3: Relate the customer requirements to the technical requirements
Step 4: Conduct an evaluation of competing products or
services
Step 5: Evaluate technical requirements and develop
targets
Step 6: Determine which technical requirements to
deploy in the remainder of the production/ delivery
process.
(Evans James, Lindsay William, “The management and
th control of quality” Thomson publications, 6 edition, 2006,
Chennai). A figure of the House of Quality Analysis in the
above mentioned format is given in Figure 2.
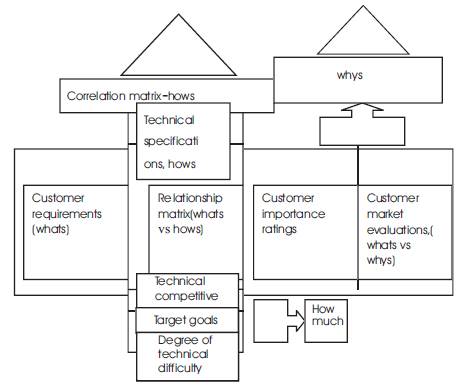
Figure 2. House of Quality
There are a number of service characteristics and related management challenges that underlie the need for an innovation technique like service blueprinting. Before describing them we should be clear as to what we mean by services since the term has so many varied and broad uses. When we use the term “service” or “services” we are referring to service offerings provided for and/or cocreated with customers such as professional services, retail, financial, telecommunication, healthcare, and many others. We also include service(s) that are offered in conjunction with goods such as training and network support services in a technology company and even service that is derived from a tangible product such as the service embedded within an onboard GPS system in a car. What all of these services have in common is an interface with an actual customer whether through technology or interpersonal interactions. (Burton and Thakur 1997)
Developing a deeper understanding of the way customers experience and evaluate service processes is but one of many challenges faced by firms that undertake the design, delivery, and documentation of a service offering. Service blueprinting is a flexible approach that helps managers with the challenges of service process design and analysis. It is a powerful technique that can be used to depict a service at multiple levels of analysis. (Warrier and Shyam 2009). That is, service blueprinting can facilitate the detailed refinement of a single step in the customer process as well as the creation of a comprehensive, visual overview of an entire service process. (Mary Jo Bitner, 2007)
In recent years the business world and trade press have become enamored of the notion of the “customer experience.” Joseph Pine and James Gilmore (2002) advanced the idea that we are in an “experience economy,” in which the orchestration of memorable, even “transformational” events for customers is the key to differentiating one's offering from those of competitors and escaping commoditization in an increasingly crowded competitive marketplace. Although the terms “customer experience,” and “service experience” are frequently mentioned in the business press without explicit definitions, a Harvard Business Review article defines a customer experience as “the internal and subjective response customers have to any direct or indirect contact with a company.” Others have conceptualized a service experience as “the cognitive, affective, and behavioral reactions associated with a specific service event” (Davis Mundi J. 2009). This definition implies a time-bounded progression of related interactions involving the customer and other people and/or technology in the production and consumption of a service.
According to Lewis Carbone (1999), a pioneer in customer experience engineering, customers cannot help but have experiences and all services create experiences. A main issue for managers is whether the company has the capability to systematically manage that experience, or whether it is simply left to chance. Effectively designing and managing the customer experience requires presenting a series of clues that function holistically to meet or exceed customer expectations. The total customer experience as influenced by these clues evokes perceptions of service quality and ultimately value along with perceptions of the overall brand itself, which in turn, influence preferences and loyalty (Warrier Shyam G 2009). Delivering customer value through distinctive, memorable ser vice experiences requires a cross-functional perspective. All parts of the organization should be focused on the common goal of creating an integrated, memorable, and favorable customer experience. Those companies that approach customer experience management with a clear vision of the design and development process are more likely to achieve improved customer and organizational outcomes (Rebortics, P. 2001). Service blueprints allow all members of the organization to visualize an entire service as a whole and its underlying support processes, providing common ground from which critical points of customer contact, physical evidence, and other key functional areas are evaluated. (Pinto and Shyam 2009).
In practice, innovation in services is less disciplined and less creative than in the manufacturing and technology sectors. As anecdotal evidence of this, let us look into a 2007 Business Week cover story featuring the world's most innovative companies. While Business Week's top twenty five most innovative companies includes a number of service businesses (e.g., Google, Walt Disney, Wal-Mart, Starbucks, Target, Amazon and E-Bay), the number of innovators is not nearly reflective of the size of the service sector. There are many reasons for this historic lack of rigorous attention to the unique aspects of service innovation. Some of these reasons are rooted in the remnants of the industrial revolution and the habitual fascination with tangible products and hard technologies as a source of product innovation, and an underlying belief that service(s) have no tangible value. Along with the awakening to the domination of services in the world's economies, there is a growing emphasis in business practice on creating meaningful, memorable customer experiences. Hence this study was conducted under such circumstances to design the services in a hotel based on customer experiences, paying heed to the voice of the customer.
This study was of an inductive-descriptive nature with a research population consisting of the three star hotel managerial staff and Calicut's inbound travelers to this hotel. The various methods of data collection used in this study were survey of concerning literature, experience survey, and analysis of insight along with the use of primary data collection instruments as questionnaire, interview and observation and secondary data collection instruments as journals, e-journals, books and e-books. The sampling method used in this study was stratified systematic sampling proportional to size.
Since this is a business class hotel, the majority of the customers came under the business class segment itself. A very small percentage say about 10% of the total customers belonged to the category of transit customers and a yet smaller percentage of say about 2-3% belonged to the category of tourist customers. Since in our study the research population consisted of the inbound travelers to the hotel along with its managerial staff, to use stratified systematic sampling, two populations were considered, one a finite population consisting of the managerial staff at this Hotel, and secondly, an infinite population consisting of the following strata of people.
Business executives, Mid managerial executives, Senior management executives, Transit customers and Tourist customers.
Since the customer population is infinite, to collect data via stratified sampling, arbitrarily say 20% of people of each strata, were chosen daily from the existing customers in the hotel till check out time i.e., 12 o'clock noon, and on the last day of the research, the total population was calculated along with the no. of people in the various strata who came and stayed at the hotel in this time period. After each individual strata population was obtained the research used the formulae for stratified sampling in the case of finite population. Since at the end of the study we can have a finite number of people in each strata this is possible.
For scaling the questions, in this research an interval scale of item analysis was used. Respondents were asked to respond to a certain number of statements. Reply to each statement was given in terms of 5 degrees of gradation of importance of goodness. Each statement thus became a scale in itself having 5 points on it.
One questionnaire was given to the customers to rate the customer requirements and importance ratings and performance ratings while another was given to the managerial staff to prioritize Service Process Design Characteristics, another was given to the employees to rate the performance and importance from their point of view. Cronbach Alpha value was greater than 0.7 and hence the questionnaire was considered to be reliable.
Cronbach's α is defined as 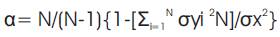 N is the number of components (items or testlets), σx2 is the variance of the observed total test scores, and σyi2 is the
variance of component (Bhattacharya, D.K., 2006).
N is the number of components (items or testlets), σx2 is the variance of the observed total test scores, and σyi2 is the
variance of component (Bhattacharya, D.K., 2006).
A four phases approach is accomplished by using a series of matrixes that guide product team's activities by providing standard documentation during product and process development. Each phase has a matrix consisting of a vertical column of “Whats” and a horizontal row of “Hows”. “Whats” are customer requirements and “Hows” are ways of achieving them. At each stage the “Hows” are carried to the next stage as “Whats” (Cohen 1995, Warrier 2009)
Customer requirements are the “whats” wanted by the customer from the product. They contain customers wishes, expectations, and requirements, for the product. Customer rates these whats on a 1 to 5 importance rating scale (interval scale), and a relationship matrix was used to maintain the relationship between customer requirements and design requirements. In other words the matrix corresponds to the “whats” vs “hows”. A weightage of 1-3-5 was used to represent the relationship 1 being the weakest and 5 being the strongest relationship. Correlation matrix is the roof part in the House of Quality used to identify the “Hows” items that support one another and which are in conflict. Positive correlation help identify items that are closely related and avoid duplication of efforts. Negative correlation helps represent conditions that will probably require trade offs. he positive and negative ratings are quantified as 2, 1, -1, and -2 with 2 being the “hows” items that are strongly supportive to each other and -2 being the conflicting. Technical goals are the “how muchs” of the “how” items. Technical difficulty assessment helps to establish the feasibility and realisability of each “hows” item. A 1 to 5 rating is used to quantify technical difficulty with 5 being the most difficult and 1 being the easiest. Again a 1-5 rating was used with 5 being the fully realized “how” item. Overall importance ratings is the final step in finishing House of quality. For each column, sum the row numbers each of which is equal to the production of relationship rating and customers important rating. The results helped to identify the critical product requirements and assist in trade off decision making process. The house of quality was used to prioritize the Service Process Design Characteristics.
For the purpose of this study a comprehensive set of customer requirements was developed.
Comprehensive set of customer requirements
The comprehensive set of Service Process Design Characteristics used in this study.
Service process design characteristics (SPDC
(a) Restaurants and Bars
(b) Conference and Banquets
(c) Other facilities
There are 63 superior and well appointed rooms and suites, as well as an exclusive business centre with state of the art business facilities. There are a total of 138 employees at this hotel with 15 managerial staff, 29 cooks, 2 drivers, 3 bellboys, 2 front office personnel etc.
In this research, using the house of quality analysis(HOQ) method, the priorities of the service process design characteristics are found out as per the customer requirements. To do this each of the Service Process Design Characteristics are correlated with each other to find out which ones have a +ve and which ones have a –ve correlation on each other. In other words which design characters require improvement, and which characters do not need improvement and will impede the development of the other characters if improved.
The mean value of importance rating of customer requirements are entered on the left side and, Four different signs, 0- no relationship, 1-weak relationship, 3- medium relationship and 5- strong relationship can be used as determined by the customers. Multiplying the customer requirement means by these each column total is found out. Then the service process design characteristics are prioritized based on these totals and the correlations.
Since not more than 15 Service Process Design Characteristics and 10 customer requirements could be accommodated in one HOQ table we had to represent the data here in more than one HOQ or we had to use affinity diagrams to group certain similar characteristics. The HOQ analysis is given in Chart 1. The resulting priorities of the service process design characteristics are given in Table 1. The redesigned service process design characteristics priorities are given in Table 2.
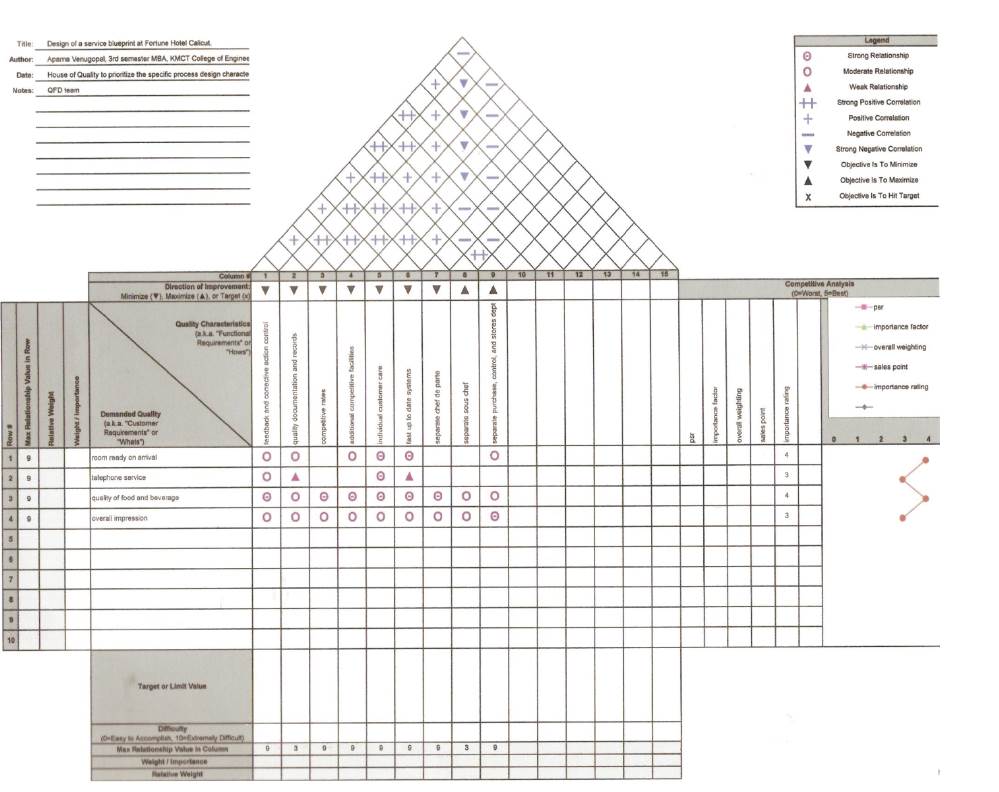
Chart.1 House of Quality Analysis
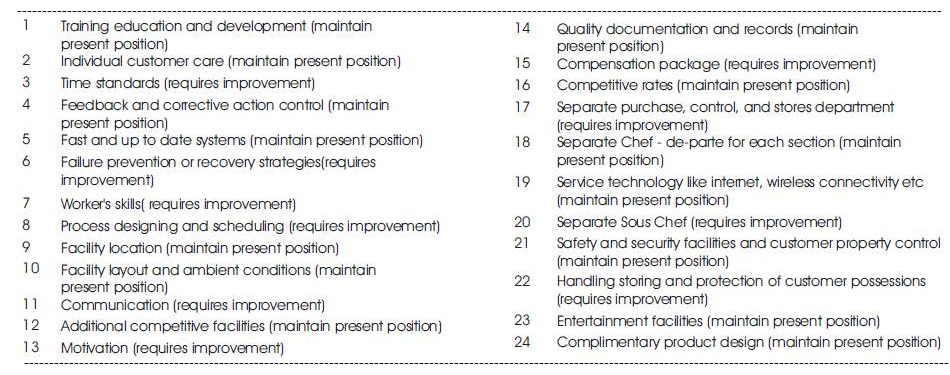
Table 1. The resulting priorities of the Service Process Design Characteristics
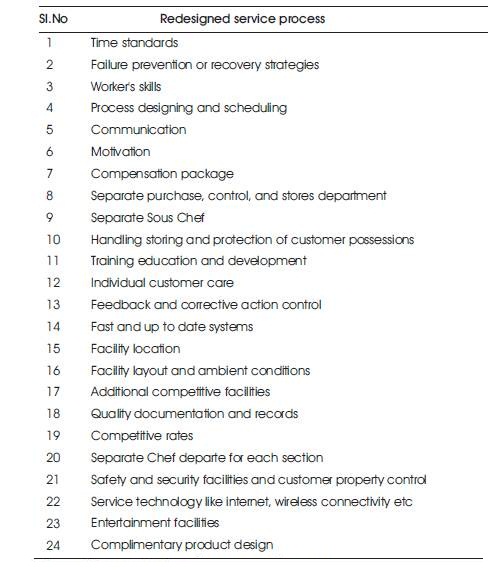
Table 2. The redesigned Service Process Design Characteristics Priorities
Then these were compared with the existing priorities of service process design characteristics as per the manager's view point. The weightings obtained from the HOQ analysis is given in Table 3.
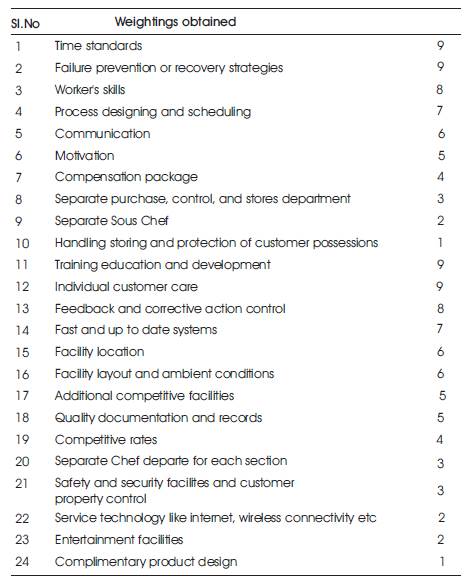
Table 3. The weightings obtained from the HOQ Analysis
The performance parameter from these SPDCs can be considered to be 124 the sum total of all the weightages, calibrating this to 100% efficiency level we understand that the deficiency of time standards reduces the efficiency by 7.25%, similarly absence of workers skills reduces the efficiency level by 6.5%, communication by 4.8%, and motivation by 4%. Lack of individual customer care reduces efficiency level by 7.25%, and lack of feedback and corrective action reduces efficiency level by 6.5%.
In the QFD team the view points of two managerial staff was considered along with 2 other subject experts. Each QFD team member was to give a significance level of 0, 1, 3, and 5 corresponding to the Service Process Design Characteristics in relation to each of the customer requirements.
SPDCs according to the study and as per the managerial view point is given in Table 4. Service blueprinting using the service process design characteristics of HOQ analysis and PERT/CPM methods is given in Table 5 and Chart 2.
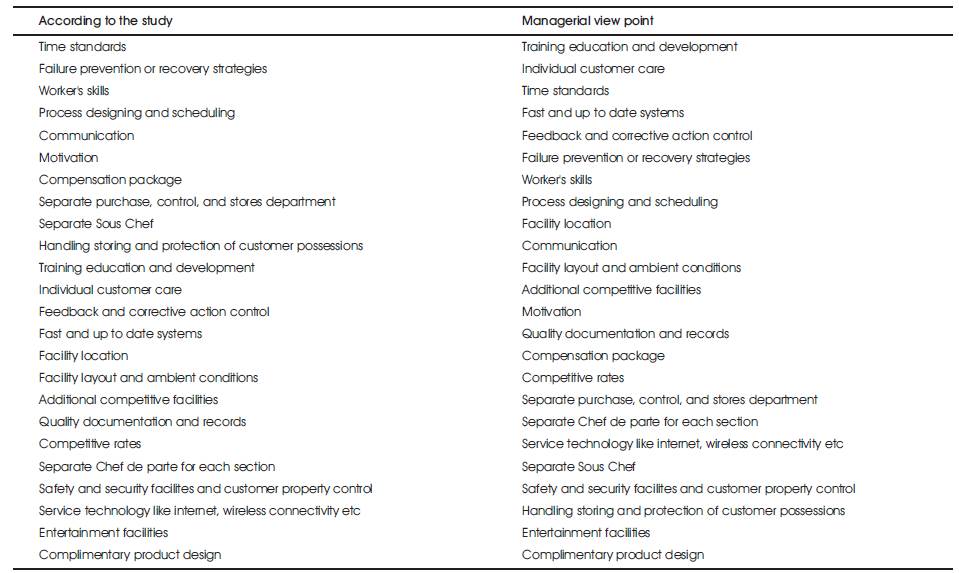
Table 4. SPDCs according to the study and according to the managerial view point
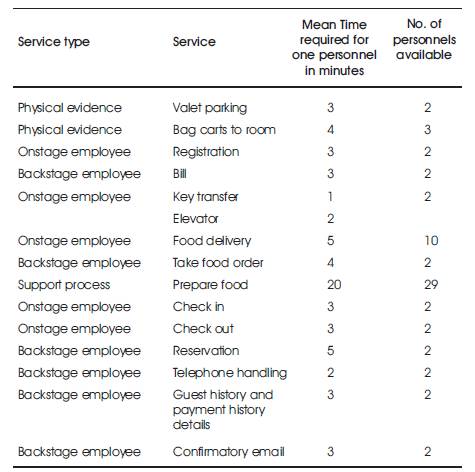
Table 5. Service blueprinting using the service process design characteristics of HOQ analysis and PERT/CPM methods
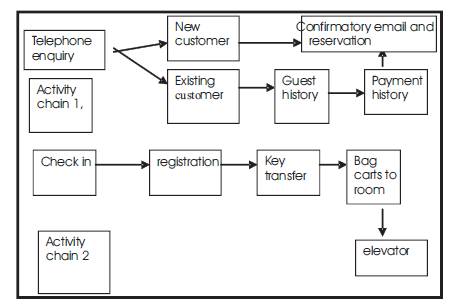
Chart 2. PERT Diagram on activity chain basis
In all the onstage, backstage, and support processes performed at this Hotel, four event chains were seen. The times in all these events were so set that there was to be 0 slack in each path. The % increase in SPDCs is given in Table 6.
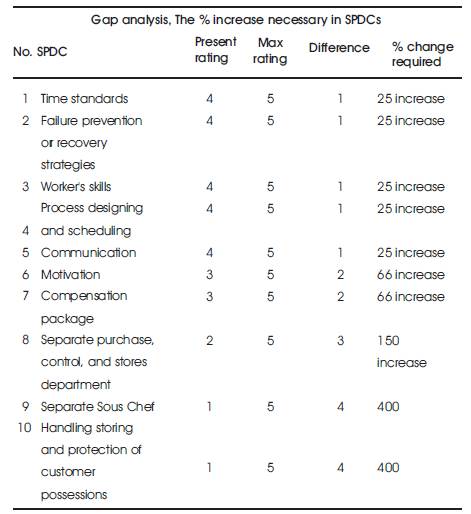
Table 6. Gap Analysis Table
Thus by dividing all these service chains into onstage, backstage, and support processes, the service blueprint was drawn. Table 7 gives the example of a service chain activity. Thus by dividing all these service chains into onstage, backstage, and support processes, the service blueprint was drawn as given in Figure 3.
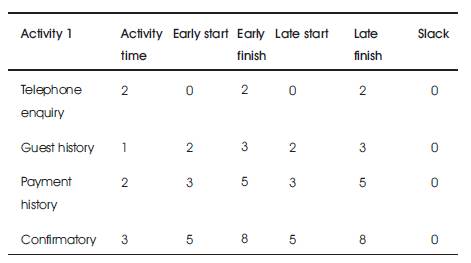
Table 7. An Example of activity chain value process
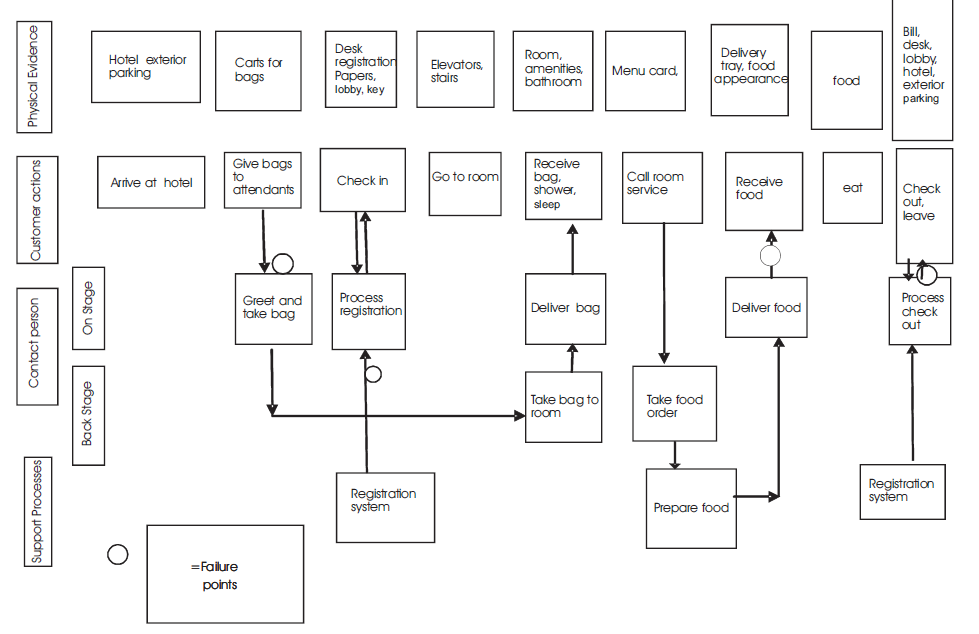
Figure 3. Service Blueprint (Customers view point, one day overnight stay)
From the data analysis done using House of Quality method and project management methods, it was found that there was no slack time in the present schedule of events though the priorities in the service process design characteristics needed to be slightly changed.
It was seen that the managerial view point gave high importance to certain Ser vice Process Design Characteristics like,
i) Training education and development
ii) Individual customer care
iii) Feedback and corrective action control
iv) Fast and up to date systems
v) Facility location
vi) Facility layout and ambient conditions
vii) Additional competitive facilities
viii) Quality documentation and records
ix) Competitive rates
x) Separate Chef de parte for each section
xi) Safety and security facilities and customer property
control
xii) Service technology like internet, wireless connectivity
etc
xiii) Entertainment facilities
xiv) Complimentary product design,
which it turned out by the house of quality analysis would impede the improvement of other Service Process Design Characteristics if improved. Therefore this QFD technique was found to be highly useful in improving the quality standards at this hotel, or any other similar organization, since it could find out not only what needed to be improved, but also what could not be improved due to internal difficulties. If it had not been the correlation analysis used in HOQ (roof), the Service Process Design Characteristics priorities would have somewhat conformed near to the managerial view point. So it was understood that the service blueprint already in use at the hotel needed to be redesigned i.e., the changes seen in between the HOQ analysis and managerial view point needed to be incorporated into the blueprint. The service blueprint designed using HOQ analysis could be used for further developments and research using QFD in the hospitality industry, especially at this particular hotel in Calicut.
While training education and development figures high in the manager's view point we need to realize that the customers lack of obvious interest in it can also be attributed to his ineptness in understanding the rigour and technicalities that go into providing a service. Customers view points are based more or less on the experience level only. The contributory efficiency level of time standards and individual customer care was found to be 7.5%, while that of worker's skills and feedback and corrective action was found to be 6.5%
The study was also able to find out the changes required in the present Service process design characteristic priorities and blueprint and design a new model apt for the situation at this hotel in Calicut. It may be noticed here that such a study is the first of its kind in service sector, especially in a hospitality industry and the researchers therefore had to venture into the intricacies of the hospitality services, many of which are yet to be explored properly. This research work is only the beginning of the proposition of a new model using HOQ in service oriented industries, where possibilities of further research is tremendous.
Knowledge is the free currency of higher education. Global connections, comparisons and assessments; and flows of ideas, process changes and capital inputs are transforming the quality in every activity ”- Simon Marginson