A Comparative Study on Performance of Equity,Debt And Hybrid Mutual Fund Schemes in India
Department of Management Studies, SVU College of Commerce, Management & Computer Science, Venkateswara University, Tirupati, Andhra Pradesh, India.
Abstract
The Indian Mutual Fund Industry is segmented and grounded on asset classes (Debt-Oriented Schemes, Equity-Oriented Schemes, Money Market Funds, ETFs and FoFs) and sources of funds (banks, retail investors, Indian institutional investors, FIIs, insurance companies, and other sources). The Average Assets Under Management (AAUM) of the Indian Mutual Fund Industry for the month of February 2022 lay at 39, 87, 990 crore. The AUM of the Indian MF Industry has raised from 7.20 trillion as on September 30, 2012 to 38.42 trillion as on September 30, 2022 further than 5 fold expansion in a span of 10 years. The MF Industry's AUM has raised from 20.40 trillion as of September 30, 2017 to 38.42 trillion as of September 30, 2022, around a 2-fold expansion in a span of 5 years. The entire number of accounts (or folios, as per mutual fund parlance) as of September 30, 2022, was at 13.81 crore (138.1 million), while the number of folios under equity, hybrid, and solution-oriented schemes, wherein the utmost investment is from the retail segment, stood at around 11.03 crore (110.3 million). The Indian mutual fund industry over the years noted a dramatic improvement in terms of volume as well as quality of the product and service offerings. In this paper, equity, debt, and hybrid mutual fund performance evaluation is measured through statistical ratios like standard deviation, beta, Sharpe's ratio, Jensen's alpha, and Treynor's ratio. All the ratios were calculated based on the daily returns over the last 3 years. The data was taken from the websites, and the yearly return was calculated on the basis of NAV. The results were obtained from a sample of 8 equity funds, 8 debt funds, and 8 hybrid funds. It was found that an investor must take the risk ratios into consideration before investing.
Keywords :
- Investment
- Institutional Investors
- Money Market
- Investors
- Treynor Ratio
- Sharpe Ratio
Introduction
Mutual funds are becoming more popular investment tools nowadays because they offer features like diversification, professional management, liquidity, and affordability. Some of the mutual funds also provide tax deductibility. According to the Association of Mutual Funds in India (AMFI), a mutual fund is "a trust that pools the savings of a group of investors who share a common financial goal." The investor's resources were collected by the asset management company for investment in various avenues. The return for the investors depends on the appreciation in Net Asset Value (NAV) of the mutual fund. Thus, the benefits flowing from fund performance were shared by the investors in proportion to their mutual fund units. The investment in stocks, bonds, and money market instruments provides diversification benefits to the mutual funds. Diversification reduces market risk compared to individual securities. Small investors who are unable to step into the capital market directly can access it through the helping hands of mutual funds. The mutual funds work on the principle of "don't put all your eggs in one basket". So, the investments must be diversified to spread and reduce risk and provide a good return to the investors both in terms of dividends and capital gains. Investors invest in mutual funds rather than lending money. Mutual funds are the most popular investment vehicle among retail Indian investors as they provide long-term risk-adjusted returns through diversification. The awareness level of mutual funds has significantly increased in the past decade as investors are acting rationally towards market fluctuations. Mutual fund investors are using SIP to invest in mutual funds, and they are savvy enough to realize that the returns of the mutual fund schemes are subject to market risks Mutual fund managers sum up the small amounts received from investors and invest a large amount in stocks in mutual funds as per the nature and type of mutual fund. A mutual fund is a collection of different stocks. There are different kinds of mutual funds with different aims. For example, some mutual funds have the aim of getting high returns, some mutual funds are created to earn a slow and steady income, some mutual funds invest in only money market instruments, etc. Any mutual fund invests money in equity, debt, or both. Mutual funds can be of two types from the entering and exit point of view. Investors can buy mutual fund from the fund itself or from the broker of the fund or from the other investors too. Mutual funds are also redeemable, meaning investors can sell their shares to the funds at any time. As with any other business, running a mutual fund also involves costs. The funds pass these expenditures on to the investors in the form of fees and distinct charges. Fees and charges differ from fund to fund. A mutual fund's portfolio is structured and maintained to match the investment objective stated in its prospectus. The valuation of the mutual fund company depends on the performance of the securities an investor decides to purchase. When investors purchase a unit or share of a mutual fund, they are buying the performance of its portfolio or a part of the portfolio's value. A fund's NAV is derived by dividing the total value of the securities in the portfolio by the total number of shares outstanding.
This research paper is arranged as follows, Section 1 deals with the literature review, Section 2 presents the objective of the study, Section 3 shows the methodology, sample size, method of choosing the sample, and tools used for analysis, Section 4 gives a brief overview of the analysis and results and final section concludes the paper.
1. Review of Literature
(Bhansali and Nag (2021) concluded that Axis Mutual Funds as a whole performed relatively better than SBI Mutual Funds. The conclusion has been drawn based on different performance evaluation techniques like NAV, Average return, Standard deviation, and Sharpe ratio. The outcome from the evaluation let the investor invest in the right categories of mutual funds.
CMA Panigrahi et al. (2020) studied an analysis of ten equity-linked savings scheme mutual funds.Using financial ratios and tools for analysis, including the average return, coefficient of determination (R2), S.D., beta, Sharpe ratio, and Jensen alpha. They found a more attractive return in ELSS mutual funds with a tax benefit of 1.5 lakh.
Tripathi and Japee (2020) researched fifteen equity mutual funds of different categories based on the market capitalization of companies using different financial ratios for the evaluation of funds. They found the majority of equity mutual funds are performing well, but a sharp fall in the NIFTY 50 in 2019 is affecting the return of the mutual fund.
Ayaluru (2016) analyzed 10 top-performing schemes offered by Reliance Mutual Funds and selected them for a comparative study on the risk and return offered by these funds. The study concluded that, among the selected funds, the Reliance Small Cap Fund is considered a fund with moderate risk as well as moderate returns, whereas the Reliance Bank Fund is considered a fund with high risk and high returns.
Pandey (2022) carried out research on "Performance evaluation of debt mutual fund schemes in India." The study makes a comparison between the private and public sectors by selecting 44 debt mutual fund schemes based on daily NAV (Sushilkumar, 2010). To examine financial performance, Sharpe, Treynor, and Jensen Alpha are used. R2 is used to measure the correlation of fund return with benchmark index return, and beta is used to measure volatility in fund return. The performance winning ratio of the public sector is more than the private sector (i.e., five times public and three times Private has outperformed). Hence, the public sector is more efficient in debt categories funds.
Rekha and Rajender (2014) analyzed the turns of hybrid growth MFs over a period of 5 years and applied the Sharpe ratio, Treynor's ratio, and Sortino ratio. The findings revealed that the schemes have low unique risk.
Prajapati and Patel (2012) compared the performance of equity diversified mutual fund schemes of five selected Asset Management Companies. This selection was based on AUM. Data of daily closing NAV was taken from Jan. 1, 2007 to Dec. 31, 2011. Evaluation of Indian mutual funds is carried out through relative performance indexing, risk-return analysis, beta, Treynor's ratio, Sharpe ratio, and Jensen's measure (Sharma, 2020). Adhav and Chauhan (2015), have made a comparative analysis of the performance of equity, debt, and hybrid schemes from 2009–10 to 2013–14. The selected equity and debt mutual fund scheme outperformed the benchmark BSE index. Hybrid mutual fund schemes also generated an average return above the benchmark CRISIL balanced fund index.
Sahai and Kumar (2020) carried out their study on the topic "Variation in mutual fund performance: A comparative study of selected equity schemes in India for the period 1995–2020". The paper investigates the performance of 34 open-ended, diversified equity schemes for the 25 years from 1995–2020. The performance has been evaluated in terms of return and risk analysis and risk-adjusted performance measures such as the Sharpe ratio, the Treynor ratio, and Jensen's Alpha. In the study, the Sharpe ratio and Treynor ratio were greater than 1, and Jensen's alpha was positive for most schemes, which showed that the funds were providing higher returns.
Narayanasamy and Rathnamani (2013) evaluated the performance of equity mutual funds in India with special reference to equity large-cap funds. The study extends over a period of three years and considers five MF schemes among the different private-sector MFs. The net asset values and total return of the schemes were analyzed through the values of Alpha, Beta, Standard deviation, R- squared and the Sharpe ratio. The study concluded that the selected funds, except one, performed very well in high-volatile markets and suggested that while evaluating the funds' performance Alpha, Beta, Standard deviation should also be considered separately from net asset value and total return.
2. Objectives of Study
- To study a comparative performance analysis for the selected Equity, Debt and Hybrid funds for three years.
- To examine the risk and return component among these mutual funds.
- To appraise the performance of selected schemes using risk adjusted performance measures namely Sharpe, Treynor and Jenson's Alpha ratios.
3.Research Methodology
3.1 Sampling
To investigate the performance of mutual funds in India, 24 schemes have been selected as sample
3.2 Period of Study
For the purpose of the present study, performances of 24 sample schemes over a period of 3 years from 2019 to 2021 have been proposed to be analyzed.
3.3 Data Sources
This study is based on secondary data, and the relevant sources of data are books, journals, magazines, newspapers, brochures, and websites of selected mutual funds. Monthly NAV data on each sample scheme is collected from www.mutualfundsindia.com and www.moneycontrol.com.
3.4 Tools and Techniques
To analyze the data, simple statistical tools like the arithmetic mean, percentages, and standard deviation have been used. The financial tools like portfolio beta, Sharpe ratio, Treynor ratio and Jensen ratio has been selected.
4. Analysis and Interpretation
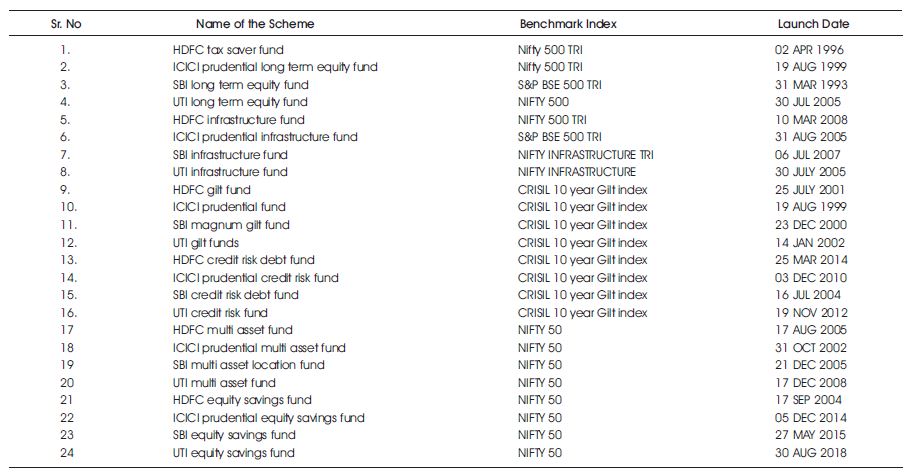
The study measured the performance of 24 public and private MF schemes. The study included eight equity, eight debt, and eight hybrid funds. The study covered a period of three years (from 2019 to 2021). The net asset value of the MF schemes is obtained from the AMFI website, while the benchmark index is obtained from the official websites of the Bombay Stock Exchange (BSE) and the National Stock Exchange (NSE). Table 1 shows the name of the scheme, the benchmark index, and the launch date.
Table1. Name of the Scheme, Bench Mark Index and Launch Date
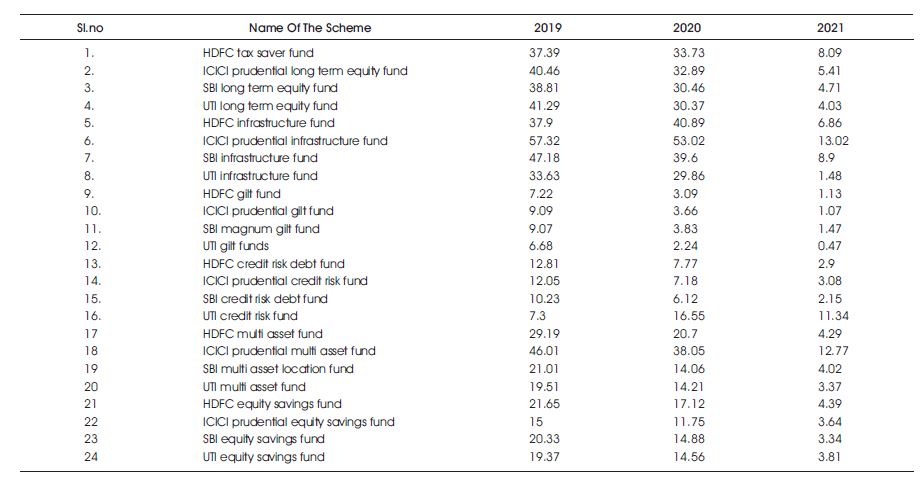
Table 2 shows that the index made the highest return of 57.32% in the year 2019, 40.89% in the year 2020, and 12.77% in the year 2021. The index return showed the lowest return of 6.68% in 2019, 2.24% in 2020 and 0.47% in 2021.
Table 2. Comparison of Sample Mutual Fund Schemes Performance (Absolute Return (%)
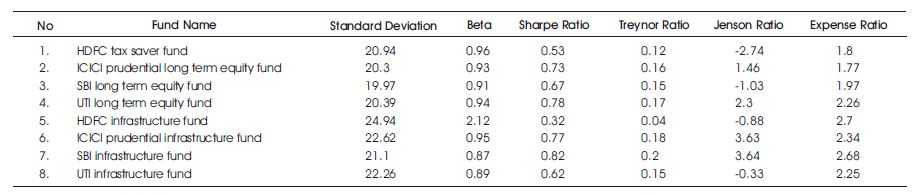
Table 3 shows the statistical parameters used to analyze the performance of the selected equity mutual fund schemes. SBI long-term equity fund has the lowest standard deviation of 19.97%, and the most risky is the HDFC infrastructure fund with a standard deviation of 24.94%. HDFC Infrastructure fund has the highest beta of 2.12. It indicates the sensitivity of a scheme's return in relation to the market return. Because the beta is greater than 1, the scheme responds aggressively to market volatility, making it risky to invest in such a fund. Further, it is clear that the HDFC tax-saving fund, the ICICI prudential long-term equity fund, the SBI long-term equity fund, the UTI long-term equity fund, the ICICI prudential infrastructure fund, the SBI infrastructure fund, and the UTI infrastructure fund have betas less than 1, which indicates that they are safe against some macroeconomic risk that affects the rest of the investment portfolio adversely. The analysis of the sharpe ratio revealed that SBI Infrastructure Fund has the highest sharpe ratio of 0.82. It indicates that this scheme is better at dealing with the total risk attached to the fund as compared to its competitors. HDFC Infrastructure Fund has the lowest Sharpe ratio among all the equity schemes, at 0.32. The higher Treynor ratio is a good performance indicator. Among all the funds, the SBI infrastructure fund has performed better as it has the highest Treynor ratio of 0.2. The HDFC Infrastructure Fund has the best Treynor Ratio. Jension alpha for four mutual fund schemes out of eight sample schemes have come out with positive values, which indicate superior stock selectivity of their fund managers assuming their respective levels of risk. Positive indicates good performance whereas negative indicates poor performance of the funds. SBI infrastructure fund has performed best, ranking first among all the schemes with a Jensen ratio of 3.64, and UTI infrastructure fund ranks last with a 0.33 Jensen ratio. HDFC Infrastructure Fund has the highest expense ratio of 2.7. The ICICI Prudential Long Term Equity Fund has the lowest expense ratio of 1.77. SBI infrastructure fund and ICICI prudential infrastructure fund fall under the "good performance" category. HDFC Infrastructure Fund and HDFC Tax Saver Fund fall under the "below average performance" category. Over the last three years, selected equity mutual fund schemes have underperformed.
Table 3. Risk Ratio (Equity Fund)
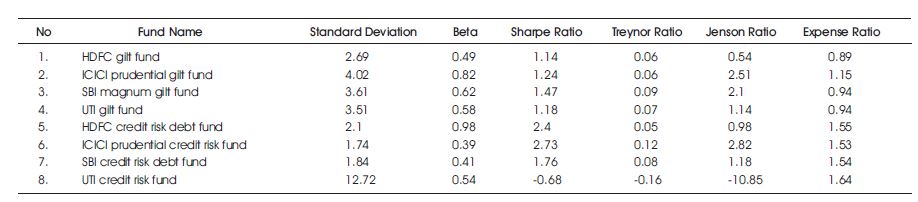
Table 4 shows the risk ratio of the debt fund. From the randomly selected debt mutual fund schemes average return of the last three year is volatile in nature. ICICI Prudential Credit Risk Fund has a comparatively low beta of 0.39. Therefore, it can be said that these funds have low volatility compared to other funds. ICICI prudential credit risk fund and SBI credit risk debt funds have the lowest standard deviation values, which are 1.74 and 1.84, and UTI credit risk fund has the highest standard deviation value of 12.72.
Table 4. Risk Ratio (Debt Fund)
ICICI prudential credit risk fund and SBI credit risk debt funds carries low variance and risk compared to other schemes. The greater the Sharpe ratio, the better the risk adjusted performance. ICICI prudential credit risk fund and HDFC credit risk debt fund have a greater Sharpe ratio. Over three years, these two funds outperformed in terms of risk-adjusted performance, as the Jenson ratio determines, which a portfolio is earning the proper return for its level of risk. In selected debt mutual fund schemes, the ICICI Prudential Credit Risk Fund shows the best performance. Treynor ratio shows that UTI credit risk fund indicating that its performance is worse than risk free security.
UTI Credit Risk Fund has the highest expense ratio of 1.64. The HDFC Gilt Fund has the lowest expense ratio of 0.89. UTI gilt fund and SBI credit risk debt fund fall under the average performance category, and the remaining two funds, ICICI prudential credit risk fund and SBI magnum gilt fund, fall under the good performance category. Overall, selected debt mutual fund schemes have good performance.
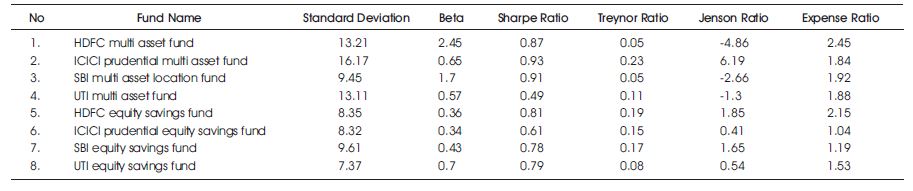
Table 5 shows the statistical parameters used to analyze the performance of the selected hybrid mutual fund schemes. The UTI equity saving fund has the lowest standard deviation of 7.37%, and the most risky is the ICICI prudential multi asset fund with a standard deviation of 16.17%. The HDFC multi-asset fund has the highest beta of 2.45 compared to other funds. It indicates the sensitivity of a scheme's return in relation to the market return. Because the beta is greater than 1, the scheme responds aggressively to market volatility, making it risky to invest in such a fund. Further, it is clear that HDFC multi-asset fund, ICICI prudential multi-asset fund, UTI multi-asset fund, HDFC equity savings fund, ICICI prudential equity savings fund, SBI equity savings fund, and UTI equity savings fund have betas less than 1, which indicates that they are safe against some macroeconomic risk that affects the rest of the investment portfolio adversely. The analysis of the Sharpe ratio revealed that the ICICI Prudential Multi Asset Fund has the highest Sharpe ratio of 0.93. It indicates that this scheme is better at dealing with the total risk attached to the fund as compared to its competitors. UTI multi asset fund has lowest sharpe ratio among all the equity schemes with 0.49 sharpe ratio. A higher Treynor Ratio is a good performance indicator. Among all the funds, the ICICI Prudential Multi Asset Fund has performed better as it has the highest Treynor Ratio of 0.23. HDFC multi asset fund and SBI multi asset location funds has performed lowest treynor ratio. Jension alpha of five mutual fund schemes out of 8 sample schemes have come out with positive Jensen's values, which indicate superior stock selectivity of their fund managers assuming their respective levels of risk. Positive alpha (α) indicates good performance whereas negative alpha (α) indicates poor performance of the funds. ICICI Prudential Multi Asset Fund has performed best, ranking first among all the schemes with a Jensen Ratio of 6.19. HDFC Multi Asset Fund has the highest expense ratio of 2.45. The ICICI Prudential Equity Savings Fund has the lowest expense ratio of 1.04.
Table 5. Risk Ratio (Debt Fund)
Conclusion and Suggestions
This study analyzed the 24 mutual fund schemes, 8 of each type, Equity Mutual Fund scheme, Debt Mutual Fund scheme and Hybrid mutual fund scheme. This study concluded that Equity Mutual fund schemes carry the topmost standard deviation in valuation as they are also largely volatile in nature, which shows the high risk and high return associated with these fund schemes. Whereas Debt mutual fund schemes are of low risk and low return nature and Hybrid Mutual fund schemes are of average risk and average return. As per the computed beta value, Equity and Hybrid Mutual fund schemes are unpredictable in nature, and Debt Mutual fund schemes are ideal as they are less volatile in nature. The Sharpe ratio of 24 schemes out of 23 is higher, which means it provides better risk-acclimated performance in the selected time period. The Treynor value shows that out of 24 schemes, 23 indicate better performance than risk-free securities. Jensen value determines that out of 24 selected schemes, 16 mutual fund schemes revealed a positive Jenson measure, which shows superior performance, and 8 mutual fund schemes revealed a negative Jenson measure, which shows underperformance. The performance ratios like the Sharpe ratio, Treynor ratio, and Jenson ratio are very useful for the performance evaluator to know the fund's performance. In Expense ratio of 24 schemes, 6 schemes indicate a high expense ratio, which is high and not acceptable, while the remaining 18 schemes indicate a low expense ratio, which is low and acceptable. From the study, it is indicated that Equity and Hybrid Funds are highly unpredictable in nature. Investors who are risk takers can elect these portfolios. Investors who are risk averts can go for debt mutual fund schemes. Moreover, if investors hold long-term investment objectives, they can elect equity and hybrid funds. If investors have short-term investment objectives or goals, they can choose debt funds.
References
[1]. Adhav, M. S. M., & Chauhan, P. M. (2015). Comparative study of mutual funds of selected Indian companies. International Journal of Science, Technology & Management, 4(2), 44-51.
[2]. Ayaluru, M. P. (2016). Performance analysis of mutual funds: Selected reliance mutual fund schemes. Parikalpana: KIIT Journal of Management, 12(1), 52-62.
[3]. Bhansali, S., & Nag, R. (2021, February). A comparative study on performance analysis of mutual fund schemes with reference to axis mutual funds and SBI mutual funds. International Journal of All Research Education and Scientific Methods (IJARESM), 9(2), 746-772.
[4]. Narayanasamy, R., & Rathnamani, V. (2013). Performance evaluation of equity mutual funds (on selected equity large cap funds). International Journal of Business and Management Invention, 2(4), 18-24.
[5]. Pandey, S. (2022). Performance evaluation of debt mutual fund schemes in India. Indian Journal of Accounting (IJA), 54(1), 118-138.
[6]. Panigrahi, C. M. A., Mistry, M., Shukla, R., & Gupta, A. (2020). A study on performance evaluation of equity linked saving schemes (ELSS) of mutual funds. NMIMS Journal of Economics and Public Policy, 5(1), 48-68.
[7]. Prajapati, K. P., & Patel, M. K. (2012). Comparative study on performance evaluation of mutual fund schemes of Indian companies. Researchers World, 3(3), 47-59.
[8]. Rekha, C. U., & Rajender, K. (2014). Portfolio performance evaluation of mutual funds in India - A study of hybrid growth funds. Global Journal of Management and Business Research, 14(4), 42-52.
[9]. Sahai, A., & Kumar, D. (2020, August). Variation in mutual fund performance: a comparative study of selected equity schemes in India for the period 1995-2020. Pacific Business Review International, 13(2), 18-30.
[10]. Sharma, K. B. (2020). Performance analysis of mutual fund: A comparative study of the selected debt mutual fund scheme in India. GAP Inter disciplinarities- A Global Journal of Interdisciplinary Studies, 3(2), 5-8.
[11]. Sushilkumar, M. (2010). Compared to private company–public company scheme is better to invest. Financial Research, 32(2), 34-39.
[12]. Tripathi, S., & Japee, D. G. P. (2020). Performance evaluation of selected equity mutual funds in India. Gap Gyan-A Global Journal of Social Sciences, 3(1), 65-71.