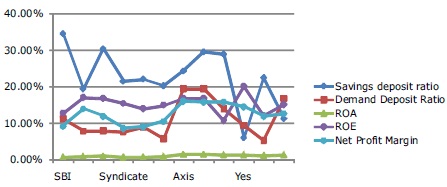
Figure 1.Comparison of Savings and demand deposits, ROA, ROE and Net Profit Margin
Banks play a crucial role in the economic prosperity of every nation. As per RBI guidelines, they exercise control over the supply of money in circulation. Banks act as financial intermediaries, which accept deposits and channelize the same to lending activities. Hence they can be considered as a vital source for helping the other industries and firms in money matters. The fate of other industries depends on the performance of banks. In any country if the banking industry is in turmoil, it affects the other sectors which in turn it will have a downbeat impact on the economy. Moreover, increased competition, new information technologies, and less government restrictions led the banks to face more problems (Chaudhary & Sharma, 2011). Hence it is essential to analyse how the banking sector performance is influenced by other factors. Hence this article presents the performance of banking industry in terms of growth in deposits, advances and total assets, and also the impact of total deposits on bank's profitability. This kind of study helps the management of banks to take corrective action and improves banking performance (Abara, 2015).
Banking industry is the heart and integral part of the economy in any country (Naidu, 2012) with an obligation to improve the economic conditions of the common people in every possible manner. In fact, Banking is the lifeblood of Modern Commerce (Mustafa & Taqi, 2017). Banks act as intermediaries between the savers and needy people. They emphasize on connecting the people who have capital (such as investors) to those who seek the money (loan applicants) (Dhanabhakyam & Kavitha, 2012). Banks are the vital source for the economic progress of any country, because the resource mobilization from surplus to needy places for investment purpose leads to increase the efficiency and productivity of various sectors like trade, agriculture, and industry. Hence they became integral to the economic activities in India.
Banking sector performance will be an indicator to measure the strength of financial system in any economy as it is the replica of economic activities performed in an economy. Sound financial health of a bank provides assurance not only to its depositors, but also for stakeholders and the economy as a whole. Therefore, efforts have been made by financial analysts and economists at regular intervals to analyze the financial strength and performance of the banks and manage it accordingly (Aspal & Dhawan, 2014). Banks are the key financial intermediaries or institutions that serve as “middle man” in the transfer of fund from savers to those who invest in real assets as house, equipment and factories. The banking sector is considered to be an important source of financing for most businesses. There is a common assumption stressed that increasing financial performance will lead to improve productivity of the organizations. Nationalized banks could not sustain competition from new-generation tech-savvy private banks. Despite attempts of the government to revive the banking industry, public sector banks continued to show deficient per formance and accumulating Non Performing Assets (Parveen & Sameera, 2016). Although a lot of reforms have been made in the public sector banks, still there is a need to modify the policies of public sector banks (Koundal, 2012). In the last decade, policy makers, includes Reserve Bank of India (RBI), Ministry of Finance and other regulatory entities, have made several reforms which led a positive growth in Indian banking industry. This study attempts to measure the relative performance of Indian banks (Goel & Rekhi,2013)
Palamalai and Britto (2017) have made an attempt to evaluate the performance of selected banks for the period from 2012 to 2017. They found that the Private Banks performed better than other banks during the study period. Besides, it also examined the impact of liquidity, solvency, and efficiency on the profitability of the selected banks by employing the panel data estimations.
Gupta and Sikarwar (2017) have compared the financial performance of all types of banks. They have examined the performance of Indian banks based on the CAMEL variables and found out whether the average performance of banks differs significantly across the two bank groups during the study period. They concluded that private and public sector banks do not differ significantly in terms of capital adequacy and liquidity, however in terms of assets, management and earnings, private banks have a competitive edge over public sector banks.
Srinivas and Saroja (2015) have compared and analyzed the Financial Performance of two banks namely Bank of Baroda and Punjab National Bank in India and offered suggestions for the improvement of efficiency in selected banks. They have used CAMEL model with t-test for comparing the financial performance of the select banks. The CAMEL analysis and t-test has shown no significance difference between the bank's financial performance.
Sharma (2014) has compared the performance of both Public and Private Banks in India based on CAMEL framework. He found that private banks are better than public sector banks in availing the existing resources like assets and employees. They also found that banks whose investment ratios in Government Securities were more tended to have less Gross Non- Performing Assets and Net Non-Performing Assets. This shows that overall banks are performing better than private sector banks.
Goel and Rekhi (2013) analyzed the performance of three banks from each sector in India for a period of three years from 2009-2012. For this study, they selected three major public sector and three private sector banks based on their total assets from the year 2009 to 2012. Their analysis revealed that new banks efficiency level is high than old ones. They also found that public sector banks are not having growth in profits like other sectors. It indicates there is a relation between profitability and efficiency.
Azhagaiah and Gejalakshmi (2012) have analyzed the performance of thirty-six banks from both sectors and they used simple regression model to estimate the impact of different variables on the performance of banks. It was concluded that the productivity of public sector banks is high than the private sector banks during the study period.
Hoa - There is no relationship between total deposits and ROA in public sector banks.
Hob - There is no relationship between total deposits and return on equity in public sector banks.
Hoc - There is no relationship between total deposits and net profit in public sector banks.
Hod - There is no relationship between total deposits and return on assets in private sector banks.
Hoe - There is no relationship between total deposits and return on equity in private sector banks.
Hof – There is no relationship between total deposits and net profit margin in private sector banks.
In this present study, data have been collected from the secondary sources. The secondary sources consist of readily available financial statements and reports from different Journals, Magazines, and official websites such as, Yahoo Finance.com and selected sample Banks Websites.
The sample size taken for the study is six from public sector and six from private sector banks.
The sampling method used in this study was convenient sampling.
In this study, multiple regression method is used for testing the Hypothesis- Ratio analysis on capital adequacy, asset quality, efficiency of management, earnings, liquidity have been taken for comparison (Chaudhary, 2014) and growth analysis was also applied to find out the growth in profitability and deposits. Bar charts and Trend lines were also used to present the data.
Growth in deposits savings, net profit margin, ROA, and ROE (Kaur, 2012) are considered for the selected banks during study period for assessing the performance of banking sector
Interpretation: Figure 1 and Table 1 show that demand deposit ratio of HDFC is high (19.46) followed by Axis (19.36). In public sector banks, the demand deposit ratio was high in SBI (11.23) followed by Union bank (8.93). When compared to all other banks, Federal bank has lowest demand deposit ratio. However, Demand Deposit Ratio in HDFC and AXIS banks was high when compared to other selected banks.
Figure 1.Comparison of Savings and demand deposits, ROA, ROE and Net Profit Margin
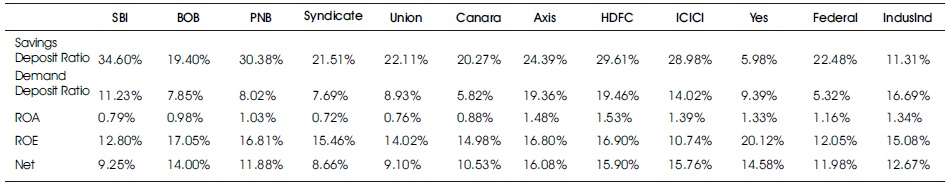
Table 1. Comparison of Savings and Demand Deposits, ROA, ROE, and Net Profit Margin
Savings deposit ratio of public sector banks was high in SBI (34.60) followed by PNB (30.38). It is 29.61 in HDFC followed by ICICI (28.98). When compared to all other banks, Yes Bank shows the lowest savings deposit ratio.
Return on Assets provide about how a bank may be efficiently running . (Nagamani & Abhirami, 2017). Here, Private sector banks was high in HDFC (1.53) followed by AXIS (1.48). In Public sector banks, Return on Assets was high in PNB (1.03) followed by BOB (0.98). However, Return on Assets in private sector banks was high when compared to public sector banks.
Return on equity is an important measure to measure successful investment (Kumar & Gulati, 2009) of private sector banks was high in Yes bank (20.12) followed by HDFC Bank (16.90). This was high in Bank of Baroda (17.05) followed by Punjab National Bank (16.81). When compared to all other banks, ICICI Bank shows the lowest return on equity.
Net profit margin ratio of private sector banks was high in Axis (16.08) followed by HDFC (15.90). In public sector banks, net profit margin ratio was high in BOB (14.00) followed by PNB (11.88). When compared to all other banks, Syndicate bank shows the least Net Profit Margin.
Interpretation: In Table 2, performance between ROA and Total Deposits is measured and the significance value is greater than 0.005. At 95% level of confidence, the significance value is greater than 0.05 so the null hypothesis (Hoa) is accepted
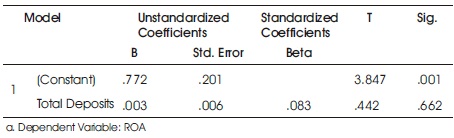
Table 2. Total Deposits and ROA
Interpretation: In Table 3, performance between Return on Equity and Total Deposits is measured and the significance value is greater than 0.005. At 95% level of confidence, the significance value greater than 0.05 so null hypothesis (Hob) is accepted.
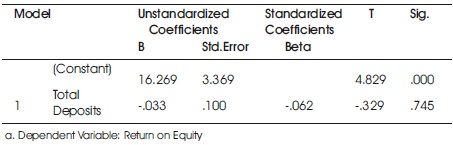
Table 3. Total Deposits and Return on Equity
Interpretation: In Table 4, performance between Net Profit and Total Deposits is measured and the significance value is greater than 0.005. At 95% level of confidence, the significance value greater than 0.05 so the null hypothesis (Hoc) is accepted.
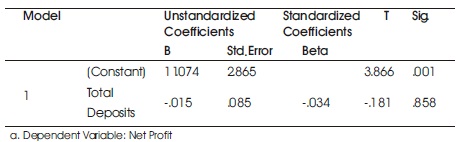
Table 4. Total Deposits and Net Profit
Interpretation: In Table 5, performance between return on assets and total deposits is measured and the significance value is greater than 0.005. At 95% level of confidence, the significance value is greater than 0.05 so the null hypothesis (Hod) is accepted.

Table 5. Total Deposits and Return on Assets
Interpretation: In Table 6, performance between ROA and total deposits is measured and the significance value is greater than 0.005. At 95% level of confidence, the significance value is greater than 0.05 so the null hypothesis (Hoe) is accepted.
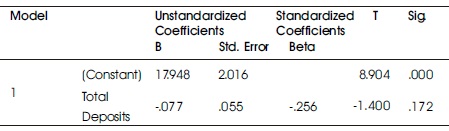
Table 6. Total Deposits and Return on Equity
In Table 7, relationship between net profit margin and total deposits is measured and the significance value greater than 0.005 shows that there is no relationship between total deposits and net profit margin. At 95% level of confidence, the significance value is greater than 0.05 so the null hypothesis (Hof) is accepted.
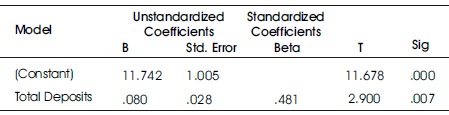
Table 7. Total Deposits and Net Profit Margin
Interpretation: Table 8 shows that the percentage change in net worth was high in Indus Ind Bank (277.11) followed by Axis (138.22). There is a percentage change in other banks, which was high in BOB (138.22) followed by Syndicate (110.49). ICICI had lowest growth when compared to all other banks. However, the Growth of Net worth in private sector banks was high as compared to public sector banks.
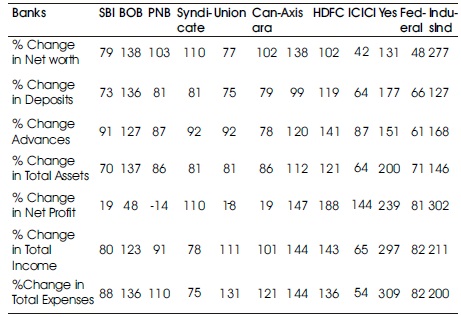
Table 8. Growth in Net Worth, Deposits, Advances, Assets, Income and Expenses
Growth in deposits was high in Yes bank (177) followed by IndusInd bank (126.51) in private sector banks. In public sector banks, the growth in deposits was high in Bank of Baroda (135.79) followed by Syndicate Bank (81.45). ICICI had lowest growth in deposits when compared to all other banks. However, the growth in deposits of Yes bank is better when compared to public sector banks.
Growth in advances was high in Indus Ind (168.13) followed by Yes (150.68) in private sector banks. In public sector banks, the growth in advances was high in BOB (127) followed by Union (92.37). Federal Bank had lowest growth in advances when compared to all other banks. However, growth in advances of Private sector banks was performed well as compared to public sector banks.
Growth in Size of Total Assets was high in Yes (199.64) followed by Indus Ind (146.05). In public sector banks, the size of total assets was high in BOB (136.96) followed by Canara (85.81). ICICI Bank had lowest growth as compared to all other banks. When compared to public sector banks, the size of total assets of private sector banks was performed well.
Growth in net profit was high in Indus Ind (301.93) followed by Yes (238.63) and Syndicate (110.43). There is a negative growth in PNB, Union, and Canara banks.
Growth in Total Income was high in Yes (297) followed by IndusInd (211.12). The growth in total income was high in BOB (122.52) followed by Union (110.58). ICICI Bank had lowest growth in total income as compared to all other banks. The growth in total income of private sector banks was performed well as compared to public sector banks. The total expenses reveal the proportionate share of total expenditure spent on the development of staff, interest expended, and other overheads. The higher value of total expenditure represents higher level of expenditure made by the banks. Growth in Total Expenses was high in Yes (309) followed by IndusInd (200.19) in private sector banks. The growth in total expenses was high in BOB (136.29) followed by Union (130.82) in public sector banks. ICICI Bank had lowest growth in total expenses as compared to all other banks.
It is suggested that further research can be done for a long period on new issues. This study can be extended by adding more banks or by conducting a study on global level with inclusion of all banks around the world. Further research could add more variables like taxation. There is a possibility to do a comparative study to check the financial performance of international banks with domestic banks.
Banking Sector is the backbone of any country. The results of the study imply that it might be necessary for a management to take all the required decision to improve the financial performance, which is the base for operational efficiency of any bank. Overall, the performance of banks is better over the course of the study period. Even though private sector banks came later into the market, due to their customer servicing and easy banking features, they are also competing equally with already existing public sector banks (Vadivel & Ayyappan, 2013). But in these days, private sector banks are giving a very tough competition to public sector banks to struggle for profits by offering advance and best customer services to the public. It is suggested that public sector banks should make some arrangements to keep their performance better. The evaluation of execution of old private segment banks in India, establishes an imperative segment of Indian financial framework. (Sharma, Goswami, & Kumar, 2014) It means that efficiency and profitability are interrelated. It is true that productivity is not the sole factor, but is an important one which influences profitability. The key to increased profitability is more efficient productivity.