 23,000 crore (US$ 3.57 billion) has been made for Pradhan Mantri Awaas Yojana – Gramin, with a target to complete 10 million houses by 2019 in rural areas. All these will go long way in stimulating the growth of real sector of india in time to come.
Sensex is an indicator of the performance of the stock market of a country as well as its economic development. Stock market index reflects the movement of share prices. But, what determines the share prices of a company has always been a matter of debate among the investors. An investor aims to buy stocks at low and sell at high and thereby earn returns. But once an investor decides to buy a share, it will be very difficult to predict whether the price will go up or down. Stock prices perform well if the fundamental of the firms are strong. The study aims to assess the stock market performance of real estate companies in India and examine the performance of the sector which in turn will affect share prices. The data is compiled from the annual reports of real estate companies for last five years 2011-12 to 2016-17. The article aims to assess the stock market performance of the sector as against that of sensex and to understand and compare the performance of the sector based on five sample companies.
According to Bank of America-Merrill Lynch report of 2017, the Indian economy would soon be on the path of growth with service-led growth as against the export-led of China and will become the third largest economy after the US and China by 2028 as a result of rising financial maturity and emergence of a mass market riding demographic dividend. It is further forecasted that India will leave France and the UK behind by 2019. One of the important sectors in the process of growth will undoubtedly be real estate sector which is going through lot of ups and downs at the moment. The Gross Domestic Product (GDP) growth of India had slowed to 5.7 percent in first quarter of current financial year, as demonetisation and the new Goods and Services Tax (GST) seems to have impacted economic activities and demand in the economy. The growth projections has been revised downward by the Reserve Bank of India (RBI) in its October Bi-Monthly monetary from 7.3 percent to 6.7 percent. However, the latest economic indicators and the second quarter corporate results show positive signals indicating that the worst is behind us and the economy is ready to be in recovery mode. Investors need not worry as gloomy days are over for Indian economy. Sensex has reached the records heights at over 33,000 points. With private consumption continuing to be robust, expectations of private capex recovery along with various initiatives of the government, Indian economy is ready for a strong recovery in the coming quarters.
The period between 2003 and 2008 was a boom time for real estate with prices increasing, almost doubling in some cases. After a two-year slowdown arising from the global economic recession, the period between 2010 and 2014 again saw huge supply and prices increasing again. But after that the three year, we have witnessed a dip in the business cycle, with sales slowing down to half, unsold inventory increasing, and prices remaining constant. Now, the question arise how this sector is going to perform in time to come. India's real estate market is forecasted to reach US$ 180 billion by 2020 from US$ 126 billion in 2015. The key variables responsible for the growth of the section are emergence of nuclear families, rapid urbanization, and rising household income. More than 70 per cent of India's GDP will be contributed by the urban areas by 2020. The private equity investments in Indian real estate is estimated to have crossed US$ 3.2 billion till September 2017 and it is further anticipated to reach US$ 4 billion by 2017 end.
The 100 smart city projects have been approved by the government of India in the year 2015. FDI limits for townships and settlements development projects have been increased to 100 per cent. Real estate projects within the Special Economic Zone (SEZ) have also been allowed to 100 per cent FDI. In current Union Budget 2017- 18, allocation of 23,000 crore (US$ 3.57 billion) has been made for Pradhan Mantri Awaas Yojana – Gramin, with a target to complete 10 million houses by 2019 in rural areas. All these will go long way in stimulating the growth of real sector of india in time to come.
In the midst of positive outlook of the industry, it makes lot of sense to see how has been the performance of the stock prices of real estate companies and compare them with the overall market performance. An attempt has been made in the article to understand stock performance of real estate companies and examine their financial soundness on the basis of some key financial variables.
Again, Sathye (2003) has observed that the mean efficiency score of Indian banks compares well with the world mean efficiency score. He also observed that the efficiency of private sector banks as a group is paradoxically lower than that of public sector banks in India.
Similarly, Cheema and Agarwal (2002) found that commercial banks operating in India are below the average level of efficiency.
Sen and Ray (2003) analyzed the key determinants of stock price in India. Their study was based upon the stocks compromising the BSE index over a period 1988-2000. The empirical study found out that dividend payout was an important factor affecting stock prices. Further, they found earning per share was found to have a very weak impact on the share prices. The study explored one of the crucial factor dividend payout ratios having impact on Indian stock price. Hartono (2004) analyzed the impact of dividend and earnings on stock prices and found significant positive impact on equity prices if positive earnings information occurs after negative dividend information. Also, a significantly negative impact occurs in equity pricing if positive dividend information is followed by negative earning information. Al-Deehani (2003) analyzed the determinants of share price for companies listed on the Kuwait stock exchange. The study showed that variables previous earnings per share, cash dividends per share, previous cash dividends per share, return on equity, price to book value ratio, previous cash flow per share, and cash flow per share are all highly correlated with the share price.
Ramudu and Rao (2006) analyzed the profitability of the three major banks in India: SBI, ICICI, and HDFC for the period 2000-2005 and brought out the comparative efficiency of SBI, ICICI, and HDFC.
Agrawalla and Tuteja (2008) examined association between share price index and economic growth for India by using multi-variate Granger causality test within an error correction framework and found the causality running from economic growth proxied by industrial production to share price index and not the other way round which shows that stock markets in India are still demand driven and industry led. Singh (2010) attempted to explore the causal relation between stock market index, that is, BSE Sensex and macroeconomic variables of Indian economy using Granger causality test. He found that the IIP is the only variable having bilateral causal relationship with BSE Sensex. WPI had strong correlation with Sensex, but it had unilateral causality with BSE Sensex.
Somoye et al. (2009) analyzed the factors influencing equity prices in the Nigerian stock market for the period 2005-2007. They employed simple linear regression model to examine the impact of earning per share, GDP, interest rate, dividend per share, and oil price on equity price. The empirical results pointed out that the variable dividend per share, earning per share and GDP exerts a positive correlation to stock prices but are not significant determinants of share price.
Nirmala et al. (2011) examined the determinants of share prices in the Indian stock market. The study focuses on three sectors, viz., auto, health care, and public sector undertakings over the period 2000-2009. They employed panel co-integration test and fully modified least squares to examine the effect of dividend, profitability, price earnings ratio, and leverage on share prices. The results showed that the dividends per share and price earnings ratio have positively influenced the share price of all three sectors. The results further indicated that debt equity ratio is a significant factor influencing share prices for all the three sectors and that it exerts a negative relation with share price.
Sharma (2011) analyzed the empirical relationship between equity share prices of different industry groups and explanatory variables, such as book value per share, dividend per share, earning per share, price earnings ratio, dividend yield, dividend payout, size in terms of sale, and net worth for the period 1993-2008. The results showed that earning per share, dividend per share, and book value per share has significant impact on the equity price of different industry groups in India.
Sahoo and Mandal (2011) in their study of the performance of the Indian banking sector during the post transition period (1997-2005) suggested that the nationalized banks are yet to exercise their cost minimizing principles compared to the other banks.
Gogia and Gupta (2013) conducted a study on liquidity position and impact on profitability of Tata Steel and steel authority of India. They found that liquidity position can be improved with the help of low average collection period and average collection can be reduced by proper coordination between sale, production and finance department. They concluded that there was a positive impact of liquidity position on profitability with the help of various techniques.
Amsaveni and Gomathi (2013) conducted the fundamental analysis of BSE listed FMCG companies for a period 2006-07 to 2011-2012. They did a economic, industry and company analysis and observed that from economic analysis, GNP, Inflation, Interest rates, Exchange rate foreign exchange reserves, Agricultural Production, Government Receipts, and expenditure has a positive growth rate during the study period and gross domestic product, gross domestic capital formation savings, and balance of payments has negative growth rate during the study period.
Saravanan and Abarna (2014) studied liquidity position of selected automobile companies in India using Anova and found that there is significant difference among the absolute liquid ratios of the selected automobile companies.
The objectives of the study are as below:
The study collected the data on S&P BSE REALTY index and S&P BSE SENSEX for a period of 24 from October 1, 2015 to September 31 2017 as a sample data and compares the performance of the both using descriptive statistics like mean, standard deviation, etc. Further t test is used to test whether there is any significance difference in their performance over the study period. In order to understand the performance of real estate companies in India, the following methodology is used:
Sample: The present study is analytical in nature using the historical data. The sample consists of five top real estate companies included in S&P BSE Reality Index, namely DLF, Godrej Properties Ltd, Indiabulls Real Estate Ltd, Housing Development & Infrastructure Ltd, Oberoi Realty Ltd.
Key Variable: The variables which have been considered in the study are
Time Period: The period of study is from 2012-13 to 2016- 17.
Source of Data: The data on key variables is compiled from the annual reports of the respective banks.
H01 : There is no significant difference in Current Ratio between the Sample Units and within the sample units during the study period.
H02 : There is no significant difference in Quick Ratio between the Sample Units and within the sample units during the study period.
H03: There is no significant difference in Net Profit Margin between the Sample Units and within the sample units during the study period.
H04 : There is no significant difference in return on capital employed between the Sample Units and within the sample units during the study period.
H05 : There is no significant difference in assets turnover ratio between the Sample Units and within the sample units during the study period.
H06: There is no significant difference in Inventory turnover ratio between the Sample Units and within the sample units during the study period.
Statistical Tools: The statistical tools that have been used in this study, include arithmetic mean, standard deviation, Compounded Annual Growth Rate (CAGR), and one-way analysis of variance.
Limitations of the study: The following are some of the limitations of the study:
The average value of sensex increased from 26500 points in October, 2015 to 31,526 points in September, 2017, whereas the realty index increased from 1389 points to 2103 points during the same period. The monthly growth rates in these values are given in Table 1.
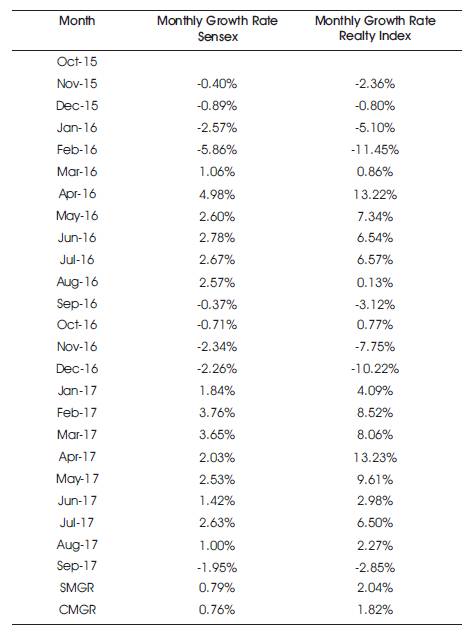
Table 1. Monthly Growth Rates in Sensex and Realty Index
From the above table, it can be seen that both Simple Monthly Growth Rate (SMGR) and Compounded Monthly Growth Rate (CMGR) are higher for realty index as compared to sensex. This is based on the data of 24 months. But the question arise whether the same can be generalized. For this, following hypothesis is formulated and test.
H0: There is no significant difference between the average growth rate of realty index and sensex.
H1: There is no significant difference between the average growth rate of realty index and sensex.
This is a problem of test of equality of two means for small sample when population variance is unknown. For this, ttest is conducted, the results of which are summarized in Table 2.
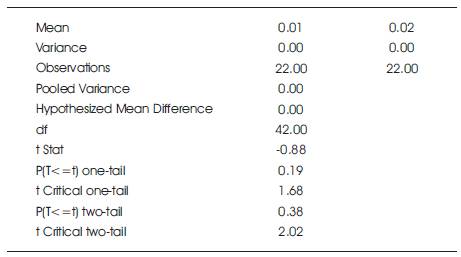
Table 2. t-Test: Two-Sample Assuming Equal Variances
From the above, it can be seen that t Stat (-0.88) is less than t Critical two-tail (2.02), and hence null hypothesis is accepted and it can be concluded that there is no significant difference between the growth rate of Sensex and realty index.
It shows the relationship between the current assets and the current liabilities. It is a financial ratio that measures whether or not a company has enough resources to pay its debt over the next business cycle (usually 12 months) by comparing firm's current assets to its current liabilities. A high ratio is an indicator of "safe" liquidity, but also it can be a signal that the company may be facing problems in getting paid its receivable or have long inventory turnover, both indicates that the company may not be efficiently using its current assets. Table 3 gives us an idea about the current ratios of the sample companies:
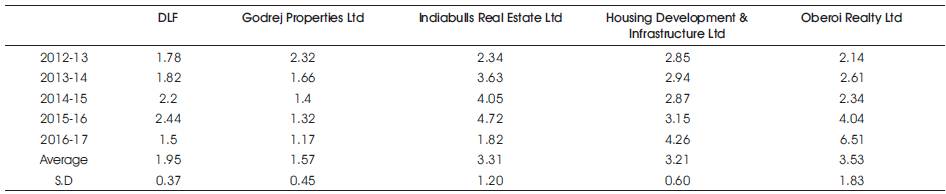
Table 3. Current Ratio
It can be seen that Oberoi Realty Ltd. has the highest average current ratio, whereas the least is found in case of Godrej Properties Ltd. However, the highest variability is also observed in case of Oberoi Realty Ltd. Godrej Properties Ltd has least variability in its current ratio implying that it is very much centered around its average of 1.57. Now it can be tested whether there is significant difference between the current ratio of sample companies on the basis of following ANOVA Table 4:
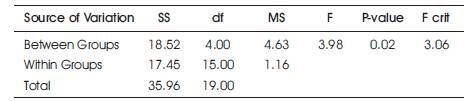
Table 4. One Way - ANOVA for Current Ratio
Interpretation: As the calculated value (3.94) is greater than the critical value (3.06) at 5% level of significance in Table 2, null hypothesis (H01) is rejected and hence it can be concluded that there is significant difference in current ratio between the sample companies. Hence, it can be noted that Oberoi Realty Ltd. has best liquidity position among the sample companies. Godrej Properties Ltd has to improve its liquidity position as it has least average current ratio.
The quick ratio or acid test ratio is a liquidity ratio which is used to measure the ability of a company to pay its immediate obligation when they become due with only quick assets. Quick assets refer to the current assets that can be converted to cash within 90 days or in the short-term. Cash, cash equivalents, short-term investments, or marketable securities, and current accounts receivable are considered quick assets. It is measured as quick assets divided by current liabilities. The following Table 5 gives us an idea about the quick ratios of the sample companies:
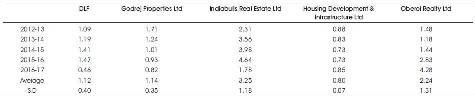
Table 5. Quick Ratio
From the above table, it can be seen that the average QR is best for Indiabulls Real Estate Ltd followed by Oberoi Realty Ltd. It is Housing Development & Infrastructure Ltd which has least QR ratio with least variability. Highest variability was observed in case of Indiabulls Real Estate Ltd. But whether these differences are significant or not, it can be seen from the following ANOVA Table 6.
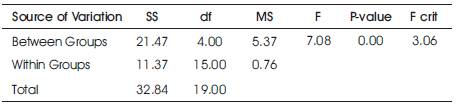
Table 6. One Way - ANOVA for Quick Ratio
Interpretation: As the calculated value (7.08) is greater than the critical value (2.312741) at 5% level of significance in Table 2, null hypothesis (H02) is rejected and hence it can be concluded that there is significant difference in the quick ratio between the sample companies. Hence, it can be said that Indiabulls Real Estate Ltd has better liquidity position compared to other sample companies based on quick ratio.
Net profit margin gives an idea about how much a company earns (after interest and taxes) on each rupee of sales. In other words, the higher a company's operating profit margin is, the better off the company is. If a company's margin is increasing, it is earning more per rupee of sales. The following Table 7 gives us an idea about the net profit margin of sample companies under study:
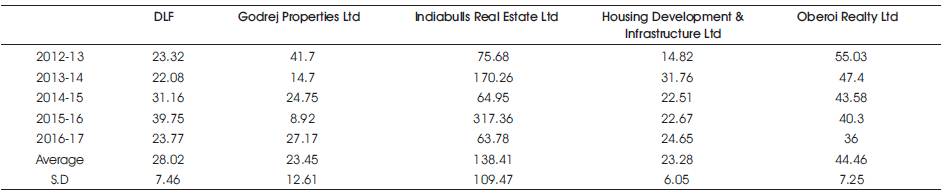
Table 7. Net Profit Margin
From the Table 7, it can be seen that the average net profit margin of Indiabulls Real Estate Ltd is highest with very high degree of variability. It is in fact abnormally very high. Least net profit margin is observed in case of Housing Development & Infrastructure Ltd. Now, whether these differences can be treated significant or not, it can be observed by referring the following Table 8.
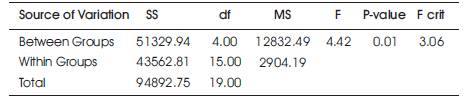
Table 8. One Way - ANOVA for NPM
Interpretation: As the calculated value (4.42) is greater than the critical value (2.312741) at 5% level of significance in Table 2, null hypothesis (H03) is rejected and hence it can be concluded that there is significant difference in the operating margin between the sample companies. Hence, it is observed that India bulls Real Estate Ltd has the best profitability position among the sample companies on the basis of Net profit margin.
Return on Capital Employed (ROCE) is a financial ratio which measures a company's profitability and the efficiency with which its capital is employed. A higher ROCE indicates that capital is used more efficiently. ROCE must be higher than the cost of capital of the company; otherwise it implies that the company is not employing its capital effectively and is not generating shareholder any value. The following Table 9 gives an idea about the ROCE of the sample companies in real estate in India:
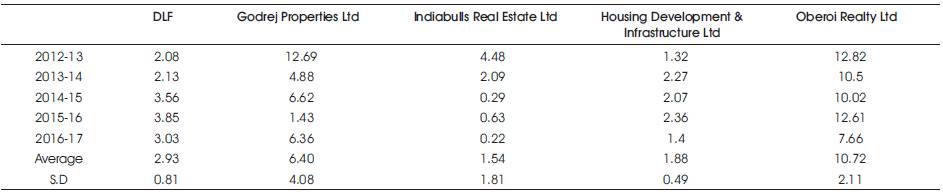
Table 9. Return on Capital Employed
From the above table, it is observed that return on capital employed is highest for Oberoi Realty Ltd and least is found in case of Indiabulls Real Estate Ltd. The maximum variability was noticed in case of Godrej Properties Ltd and least deviation was observed in case of Housing Development & Infrastructure Ltd. Now, whether this difference can be taken significantly or not can be observed by looking at the ANOVA Table 10.
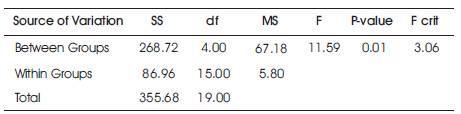
Table 10. One Way - ANOVA for RoCE
Interpretation: As the calculated value (11.59) is greater than the critical value (3.06) at 5% level of significance in Table 2, null hypothesis (H04) is rejected and hence it can be concluded that there is significant difference in the Return on capital employed between the sample companies. Hence, it is observed that Oberoi Realty Ltd has the best returns on capital employed and least is for Indiabulls Real Estate Ltd.
The asset turnover ratio simply compares the turnover with the assets which the business has used to generate that turnover. It measures how much turnover a firm is able to generate for each rupee invested in the form of assets. It is measured as sales divided by average total assets. The Assets Turnover Ratio is shown in Table 11.
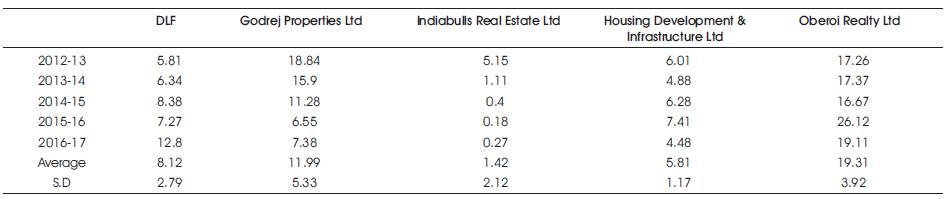
Table 11. Assets Turnover Ratio
From the above table, it can be observed that it is Oberoi Realty Ltd which has best assets turnover ratio, followed by Godrej Properties Ltd and DLF. That means these companies are generating highest turnover using their assets. The Indiabulls Real Estate Ltd has got least activity ratio which indicates that it generates only 1.42 for every 100 rupee invested in the form of assets on an average. To see whether there is significance difference in the assets turnover ratio of the firm, the following ANOVA Table 12 is referred:
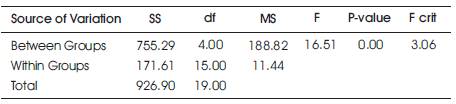
Table 12. One Way - ANOVA for ATR
Interpretation: As the calculated value (16.51) is greater than the critical value (3.06) at 5% level of significance in Table 2, null hypothesis (H08) is rejected and hence it can be concluded that there is significant difference in the asset turnover ratio between the sample companies. Hence, it can be said that Oberoi Realty Ltd and Godrej Properties Ltd are making best use of their assets by generating maximum turnover. But the same cannot be said for the companies like Indiabulls Real Estate Ltd and Housing Development & Infrastructure Ltd.
The inventory turnover ratio is an efficiency ratio which shows how effectively inventory is managed by comparing cost of goods sold with average inventory for a given period. This measure how many times, on an average, inventory is “turned” or sold during a year. Higher the inventory turnover, better is the efficiency of the firm. The Inventory Turnover Ratio is shown in Table 13.
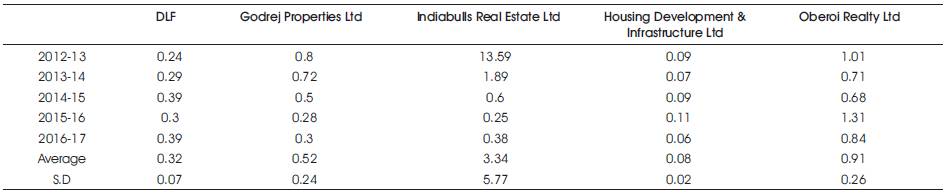
Table 13. Inventory Turnover Ratio
From the above table, it can be observed that it is Indiabulls Real Estate Ltd, which has best average assets turnover ratio with maximum variability, followed by Oberoi Realty Ltd and Godrej Properties Ltd. The Housing Development & Infrastructure Ltd has got least inventory turnover ratio. To see whether there is significance difference in the assets turnover ratio of the firm, the following ANOVA Table 14 is referred:
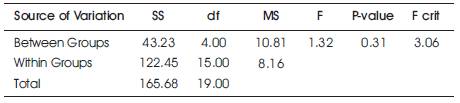
Table 14. One Way - ANOVA for ITR
Interpretation: As the calculated value (1.32) is lesser than the critical value (3.06) at 5% level of significance in Table 2, null hypothesis (H08) is accepted and hence it can be concluded that there is no significant difference in the inventory turnover ratio between the sample companies.
From the above analysis, following important findings may be summarized:
Stock market performance depends on number of micro and macro factors. Realty stocks are not exception to this. As the real estate sector is poised for higher growth rates in the years to come, it is not surprising that this stock of this sector is going to yield higher returns for the investors. The BSE Realty index, which is an indicator of the performance of the top-listed real estate players, was at its peak until 2008. After that, the index fell due to weak macroeconomic conditions, rising unemployment, and declining demand of real estate. But the recent measures of reforms like DeMo, RERA, and GST have helped the market conditions improve due to increased transparency and accountability. With this, the realty index has also started to be heading north now. The recent data on IPO shows that around 16 private realty players and two Government-owned real estate companies have opened their shares to the public. Of this, DLF (issued in 2010) has the highest issue size of 9,000 crore. In the consecutive five year period, from 2011-16, there were no large-scale public issues by big real estate players. The recent IPO filing by the Government-owned Housing and Urban Development Corporation (HUDCO) in May 2017 and National Buildings Construction Corporation Limited (NBCC) in April 2018 received overwhelming response due to their diverse businesses. While HUDCO focuses on financing urban infrastructure and housing, NBCC emphasizes on civil construction projects, civil infrastructure for the power sector, and real estate development.