Figure 1. Journey Touch/ Interaction Points
The aim of this research is to present by case study, journey mapping as a primary user research method into understanding the habits and needs of end-users and how this may lead to the design of improved services. Key factors of a journey were identified as journey time, convenience, reliability, and cost. Current transport options in rural areas have led to a perception, by users, of an increased pressure on them needing to be able to drive. The main conclusions drawn from this research were that current public transport options in at least certain rural areas are leading to a dependence on car travel. The journey mapping process, identified opportunities which acted well as catalysts for a proposal creation process. Upon conclusion, this work proposes a demand response 'taxi-bus' service aimed at providing a future userorientated transport option capable of relieving the current dependence on car travel.
The aim of this research is to evaluate journey mapping as a primary user research method into fully understanding the behaviours and needs of the end-user and how this can lead to the design of better products and services. This report will evaluate and add to existing theses and research in the topic by conducting a piece of primary research. Utilising a literature review and the primary data gained, a design proposal for a Demand Responsive Service or 'taxi-bus' system for use in rural areas shall be presented. For this to be possible, the research aims to answer the following research questions: What are the different styles or techniques of journey mapping and which are the most successful for feeding into a design process? How can user journey mapping directly affect a products'/services' design? What are the problems associated with current transport options in rural areas? Can a purpose-designed service ease the pressure on people to feel the need to drive?
Some researchers believe that more focussed user-research is the best way forward in designing better suited products for users. Chayutsahakij and Poggenpohl (2002) suggested that traditional marketing research approaches emphasise existing experiences and technologies which stifle innovation. Instead, they proposed social science research methods that allow human behaviour to be better understood, explained, and predicted. From this, design directions can be uncovered for previously unarticulated or newly emerging user needs. Milton and Rodgers (2013) support the view that design research differs from other research types through the fact that it, “is not concerned with what exists but with what ought to be”.
Fichter and Wisniewski (2015) considered the application of journey mapping in improving user's experiences of libraries. They discussed many positives of using journey mapping as a technique and suggested that, due to its nature, it is especially suited to community services and that it provides clear and focussed evidence and persuasive arguments for where improvement is needed. Further to this, they considered how meaningful results can be obtained and are easy to communicate between staff.
Crosier and Handford (2012) stated that journey mapping originated as a market research tool to help commercial businesses understand their consumers' motivations and behaviours. They suggested how more recently, 'customer' journey mapping has been used by the public sector to identify ways of understanding citizens' experiences of public services. The aim of such journey mapping is again stated to be to improve the quality of the service or product, but it also draws attention to how this method enables ordinary people to engage with the process.
Other techniques which share some similarities with the journey mapping technique are service blueprinting and Critical Incident Technique (CIT). Service blueprinting (Shostack, 1984) visualises service processes and interactions in a flow chart. This process has some disadvantages though, one being its simplicity. For example, it looks at only the observable actions or events, with no interviews or alternative means of gaining additional data. Further to this, this approach typically looks at the interactions from company's perspectives rather than the users' (Nenonen et al., 2008). Critical incident technique approaches the problem from a different angle, asking the user to describe the moments in the service process that were in some way exceptional, whether good or bad (Bitner et al., 1990). The main drawback of this method is that 'normal' incidents are excluded from the analysis. Within these moments which the user considers to be normal may be some interesting touch points or interactions, these are therefore missed (Nenonen et al., 2008).
Ultimately, journey mapping is a visual process for envisaging and structuring people's experiences. The aim is to understand what customers typically do, the flow of interactions, their possible touch points and fundamentally how they would like the customer experience to be. Interestingly, it is also suggested here that throughout the journey the value of customers will change (Nenonen et al., 2008). Risdon (2011) defined this experience mapping as “an artefact that serves to illuminate the complete experience a person may have with a product or service” and stated that for an experience map to be useful it must meet two key objectives; it must stand on its own without the need for explanation and it must be a means to something else, a catalyst to design around. Using a Rail Europe example, Risdon talks in relative depth about the processes required to create a successful journey map. He says how due to the usual number of touch points it becomes hard to highlight every touch point in the journey map itself, suggesting that the map would start to lose focus and meaning. He proposes the use of a 'touch point inventory', which is a record containing all of the touch points a user has with the product or service.
For the journey map itself, the use of an overriding filter, named “the lens” is suggested, taking the form of key points relating to a persona of the target users. This, however, could be difficult to implement and use without inadvertently making assumptions about the target user's views. Risdon illustrates the two types of insights which should also make up part of the map; qualitative and quantitative information. Qualitative insights are developed using the framework; doing, thinking, and feeling. This information is gained primarily from observations and interviews. Quantitative information is suggested to share importance, with a survey as part of the research suggested method (Risdon, 2011).
Westbrook et al. (2007) chose to apply both the CIT and journey mapping technique to assess the integration of an online evidence system into everyday clinical practice. To discover 'incidents', semi-structured interviews were conducted. This also looked at how their experiences had changed over time, further reinforcing the theory shared by Nenonen et al. (2008). These interviews were then mapped and scored using a journey mapping technique. This scoring method is an alternative to gaining quantitative data via a survey where the user's experiences were scored in relation to the desired, perfect outcome. This method was found to be inconclusive however, as individuals with the same scores were often found to have had very different journeys.
The use of personas is included in the overview of journey mapping by Howard (2014) who investigated the usefulness of personas to allow clear communication of a demographic across disciplines. This could be used to build upon “the lens” used in the technique described by Risdon (2011). This further development or inclusion could be argued to aid the need mentioned by Risdon for a successful journey map to be a standalone document.
Journey mapping can take the form of created, predicted paths that users or customers take, this is claimed to be still very company-centric. This has also been argued to have a possible negative impact; being a, “waste of time and money” (Kolsky, 2015). It is also claimed that often companies build a map with a path, or paths, for the customer to do the same thing each time. The argument is this; what happens if and when the user deviates from one of these paths? The point is made that; if you map out the users’ experiences and therefore build paths for them, but miss the one the customer wants to use, you are missing out on their expectations (Kolsky, 2015). The suggested method to prevent this issue is to allow the user or customer to create their own journeys and ensure that they have the necessary information and resources available at all times to access and use. This itself would therefore seem to be Kolsky's definition of a full and successful journey map (Kolsky, 2015; Fichter & Wisniewski, 2015).
Following on from the literature review, a journey mapping technique was devised and applied to address the proposed research questions. To begin, a target, or champion user was identified namely Participant A, who lives in the small, rural village of Monyash in the Peak District in England. Participant A is employed at a local leisure centre approximately thirteen miles away from home and can drive. Participant A was briefed and asked to undertake two journeys as part of the study. They were asked to make their usual journey to work, usually by car, driving them self. They were then asked to complete this journey a second way, utilising local bus services. Due to participant A's rural location, a taxi would be prohibitively expensive to use for travel to work and cycling or walking are not a viable options due to the distance. Both journeys were also undertaken by the investigator, who recorded the journeys and as many touch points and interaction points as seen.
This data was recorded through a log of the journeys, including the participant's views, feelings, and thoughts throughout. Photographs were also taken of any points of interest identified by the investigator and these have been used in support of this research. A combination of the above has then been used to generate three overriding documents. The first of these documents was a touch point inventory, based on the method described by Risdon (Risdon, 2011). This was used to document all possible touchpoints the user may encounter in both journeys on different occasions; as the journey maps themselves will be focused on a singular journey. By producing the touchpoint inventor y, it shows understanding of other possible variations of the journey or path users may take. This is intended to cover the issue raised by Kolsky (2015) of a user deviating from the path which has been mapped. Further observation and mapping of a much higher number of journeys, with more participants, may be needed to see which of these touchpoints become truly relevant.
The two journeys were then mapped and summarised in two visual journey maps. Again using the methods prescribed by Risdon, these aim to be standalone documents, showing the path the user took, their thoughts and feelings, and concluding 'opportunities'. This particular method of journey mapping was also chosen for being seen as a catalyst for further work and design. The use of a 'lens' proposed by Risdon was however omitted from the method. This was due to the conclusion that it wouldn't be appropriate to make such judgments or assumptions about a whole target audience with this mapping being completed on a singular participant (Risdon, 2011).
Further following Risdon's methodology, the use of both qualitative and quantitative data was seen to be important (Risdon, 2011). Therefore following the completion of the above, a pilot survey was designed and distributed. Due to the nature of the journey mapping completed; comparing two journeys rather than evaluating a service, this survey was used to gain data on questions highlighted from the completion of both maps instead. These questions were used to gain quantitative data and answers to issues found or suggested by participant A. The aim of this was see whether such opinions and issues raised by this user were shared by a larger audience, as within the time frame and resources available for this research it wasn't possible to undertake the journey mapping method with a larger number of people.
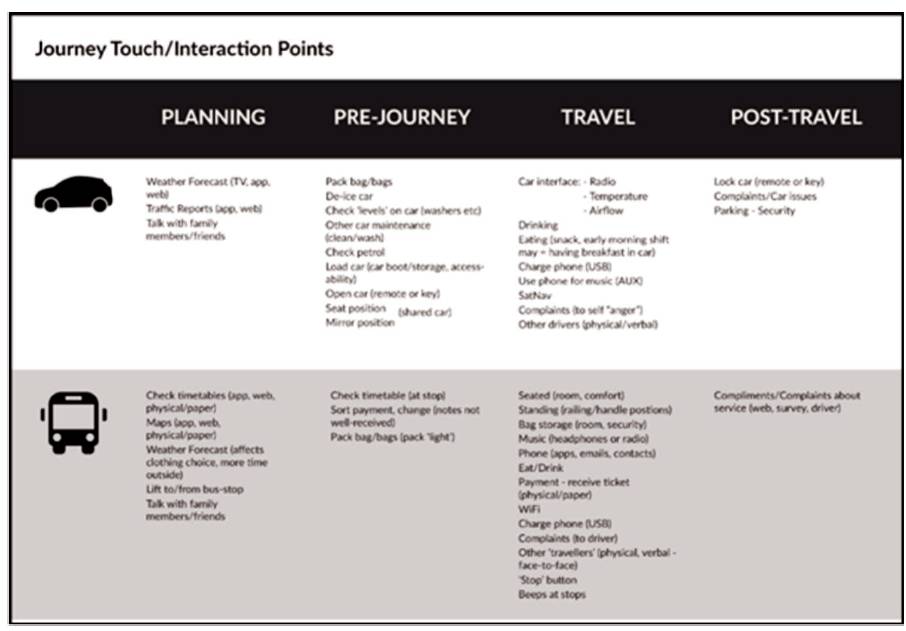
The following touchpoint inventory as shown in Figure 1 was created as a log of any possible interaction points participants may encounter.
Figure 1. Journey Touch/ Interaction Points
The inventory was split into the four subsections; planning, pre-journey, travel, and post-travel. These were adapted from the more 'online service' nature of the headings in the Rail Europe example. Further to this, this research was to focus more on the physical world than the Rail Europe example. Starting with the car as the method of travel, the planning section is fairly small. It is limited to checking weather and road conditions ahead of travelling, for example, if it forecasts a heavy frost, the user may need to allow more time to defrost the car. These touchpoints are digitally based with weather and traffic apps or websites being used; television and radio broadcasts may also be used. The only other planning may revolve around discussions with family members, especially if cars are shared between members such as with participant A.
The possible pre-journey points are more substantial. Apart from the self-preparation of packing a bag for the day, the majority at this stage revolve around preparing and checking the car before commencing travel. Although many of these do not have to be completed before every journey, the fact that they could become part of any journey or 'path' leads to their inclusion. Further to this, points such as seat and mirror position are linked to personalisation and comfort, this could be argued as important to people who own their own car. Whether this is as important to users who share car use, it is hard to say. In terms of travel, the touchpoints identified revolve largely around the in-car interface and environment. Again there is a focus on personalisation and comfort with the car radio, temperature, and airflow as identified areas. In the modern world, the interaction with mobile phone use is also important. The same applies here, with charging and using a mobile phone for music or other means another touchpoint. On top of this, people may choose to eat or drink in the car, this could be especially apparent if they are starting work early in the morning. Complaints at this stage and with this method are limited to what is referred to as 'self-anger'. This could also be called road rage, or just being frustrated behind the wheel, and venting it personally.
In this method the interaction points which make up the post-travel section are those relating to exiting the car, finishing the journey, and parking the car. This area can be embellished through features, such as parking sensors or cameras, or self-locking cars, which would ease feelings of anxiety in both cases. This is dependent on the user's car though and was not appropriate for this journey with participant A. Looking at the bus journey, the planning section was more extensive. Again, digitally, checking the weather was a touchpoint, more in terms of clothing choice in this instance however. Further to this, checking bus timetables and route maps are two major touchpoints. These are also seen as mainly digital touchpoints now, but there is still the option of paper or physical timetables. Lifts to and from bus stops were considered another interaction point here. In terms of prejourney, the number of identified touchpoints was small. Secondary timetable checking, at the bus stop was considered a possibility. Packing bags and such selfpreparation will again occur. It was also identified that at this stage, users would ensure that they have money to pay for the bus ticket; sorting coin payment if possible as this is known to be preferred.
During the travel section of this method, the user would come into contact with a large number of different touchpoints. Some of these could again be categorised as comfort-related, such as sitting or standing. Whether seated or forced to stand, the design of the bus can still significantly affect the user's level of comfort within the journey. Railing and handle positions and design along with seat room, materials, and cleanliness can all have an effect. The same applies to the storage of baggage. Often users do not like to leave their bag unattended, or there is no dedicated area for this; they therefore choose to keep it on their person whilst standing or seated. Again, there is the link between mobile phone use whilst travelling; in a world where people fear not staying 'connected'. These touchpoints were in the form of charging, Wi-Fi connectivity and phone use including music. Eating and drinking were again seen as possibilities with the undertaking of these being safer here, but they could however cause discomforts and annoyances for other passengers. After paying, receiving a physical paper ticket is still the norm. This could be seen as irritating if for example buying a return ticket, as this ticket then has to be retained until the return journey. Perhaps there is a more semantic reason and feeling associated with having and receiving a physical item as part of the transaction though.
Further significant touchpoints are those related to stopping the journey, as with a bus this responsibility lies with the passenger to inform the driver of when they want to stop. This is most commonly achieved through the use of stop buttons located throughout the bus. Once pressed, a sign is illuminated and a 'beep' sound is also fed back through the cabin. Finally for this stage, complaints of the service, including of other passengers, can be taken to the driver, or perhaps directly to other passengers. Post-travel for this method is limited just to this feedback about the service. This can be both compliments and complaints and at this stage and can be the form of website or email reviews, survey replies or again, directly to the driver.
The first journey the participant was asked to take was their usual method of transport to work, by driving them self in the car they share with their mother. The created journey map for this method can be seen in Figure 2.
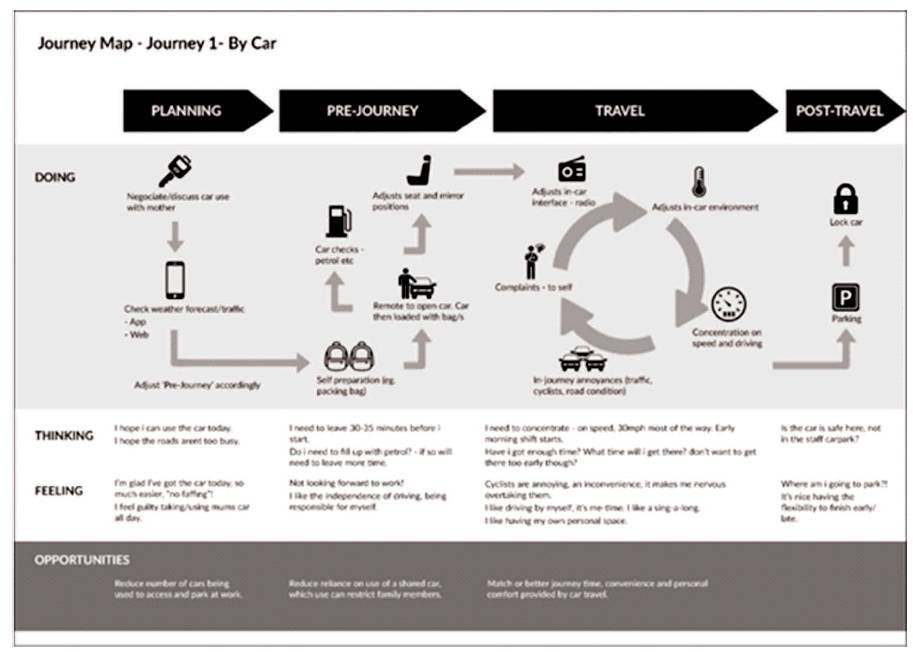
Figure 2. Journey Map - Journey 1 - by Car
As can be seen in Figure 2, this journey began before the investigator got there on the day. The participant had previously 'negotiated' being able to use the car that day; ensuring their mother did not need it. At this stage, the participant spoke of feelings of guilt for taking the car away from their mother; meaning if their father was busy their mother would be effectively 'stuck' in the village for the time they were at work. Opposing this were thoughts of relief, stating how knowing they had the use of the car was much easier. There were no adverse weather conditions; therefore the participant decided they would need to allow 30 to 35 minutes for the journey. They spoke of how the journey can take just 20 minutes on a good day, but due uncontrollable conditions, such as traffic in towns they have to pass through and general farming traffic 'hold-ups', more time had to be allowed. They also raised the point that due to the nature of the nearby market towns, traffic can be significantly increased at certain times of day on market days. This was also linked to a personal characteristic of the participant. They stated their dislike of being late, and the anxiety caused by feelings of running late. However, contrastingly, they mentioned how they also did not like arriving at work too early. As if this was the case they would be expected to still start as soon as they arrive, time which they did not get paid for. This highlighted a fine balance between allowing enough journey time for unforeseen delays, and not allowing too much time. The participant had also prepacked their bags for work.
In the early stages of the pre-journey, an immediate issue was raised here of a difficulty to get out of the drive due to other parked cars. Participant A spoke of how they enjoyed the independence of driving and being responsible for themself. During the travel phase of the journey, the touchpoints seen in the map largely relate to the in-car environment; with the participant altering the radio, temperature, and airflow to suit. This links to comfort and personalisation. The participant stated at this time how they enjoy having their own personal space, calling driving on their own “me time”, with one of their favourite things being, having a sing-a-long to the radio.
At this point they pointed out how one of the hardest things about making this journey was the concentration required, especially with shifts often starting early in the morning or finishing late at night. Despite the journey being short geographically, it features mainly 30 mph roads another aspect which requires concentration. At this stage in the journey, complaints were limited mainly to traffic frustrations, issues with poor road condition, and issues associated with cyclists. One of the many cyclist encounters can be seen on the right hand side. The participant's concerns were related to the inconvenience of overtaking them and the associated nervousness this caused them. With this journey method, all complaints were internal or what was referred to in the touchpoint inventory as 'self-anger'. Throughout the travel stage of the journey, there were time-related checks made by participant A, with the anxiety of their arrival time apparent.
Approaching the final aspect of the journey and arrival at the participant's place of work, it was apparent that the venue was hosting an event on the day of the journey. It did however highlight an issue already raised by the participant about a lack of parking at the leisure centre. Furthermore, due to the part-time nature of the job shifts of different lengths start and finish throughout the day. Therefore, if the participants shift does not start early in the morning, the staff carpark is often full upon arrival. Participant A suggested that this can lead to insecurity about the safety of where the car is parked. This feeling is heightened due to the car being owned and used by their family too. The flexibility offered by driving to and from work is also enjoyed by the participant. It allows them the freedom to finish earlier or later depending on their manager's wishes. Although this would be possible sometimes when not driving, the participant again expressed the feeling of preferring being self-dependent. Journey 1 was completed, door to door, in 23 minutes.
Journey 2 required participant A to take their journey to work via bus. As can be seen in Figure 3, this journey began with a larger planning phase. The starting point involved participant A checking bus timetables and planning which bus was best suited for their journey requirements. Here they found the time of the only bus out of the village to the larger nearby town, Bakewell; where they would need to catch a connecting bus to Matlock. It was discovered however that this bus service ran 5 minutes after the connecting bus from Bakewell, therefore meaning they would be stranded in Bakewell for around 50 minutes until the bus the following hour.
At this stage, the participant decided to speak with their family and managed to negotiate a lift to the connecting bus top in Bakewell, essentially skipping the bus out of the village step of the journey. The participant expressed their annoyance at the limited and regimented bus service in the area, stating how this singular bus out of the village in the morning would rarely fit in with their work shifts. They again drew attention to their feelings of a lack of independence and guilt towards relying on family members. At this stage of the journey, it can be seen in Figure 3 that the participant would again usually check the weather forecast, with a mobile application being the touchpoint.
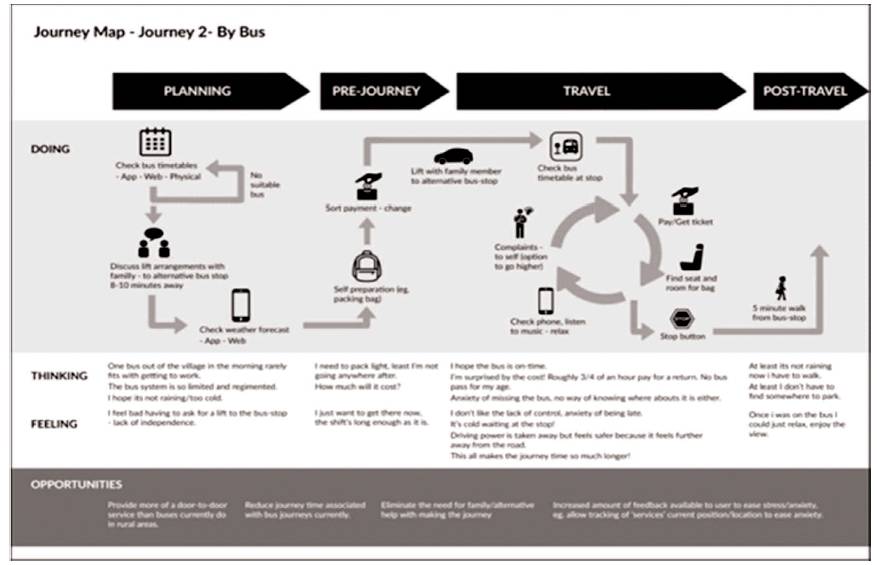
Figure 3. Journey Map - Journey 2 - by Bus
A short pre-journey phase is apparent in this second journey. This again involves the user packing their bag for work, which in this case was seen to have to be packed 'lighter' due to the method of transport. This is symbolised in the journey map by a singular bag icon rather than the two seen in the first map. The participant noted that this could be an issue if they were planning to go anywhere directly from work. At this time, the participant was said to be wondering how much the bus would cost and used this time to ensure they had what they deemed sufficient payment in coins. They had the perception that bus drivers disliked receiving notes as payment. The participant already conveyed negative feelings towards the journey at this point, stating that it felt like an inconvenience which extended the effort and time of what will be an already draining work shift.
The journey itself now truly began with the participant and investigator getting a lift with the participant's mother to the 'connecting' bus stop in nearby Bakewell. This short sub-journey took 8 minutes, with the participant allowing 15 minutes, a 7 minute wait would ensue until the scheduled bus time. It was made apparent already that the participant was anxious waiting for the bus, with concerns and wonder as to whether it would be on time. This was construed to be more down to not knowing where the bus currently was. This lack of control was the main cause of the participant's anxiety at this stage and seemed to exasperate the pre-discovered dislike of being late of the participant. During this wait, the participant stated how cold they were, but did express relief that the weather was not worse. Interestingly, despite checking and planning the chosen route and timings pre-journey using digital touchpoints, upon arriving at the stop, the participant pictured to the left of Figure 8, is to allow people to view timetables if the main board, featured as part of the shelter, is inaccessible. However, this only seemed to cause confusion and increased difficulty in finding the correct service timetable.
Arrival of the bus, on time, led to a short queue. Rails could be found on either side of the entrance door along with a moveable floor section to aid less mobile passengers. A raised curb at the bus stop and fully able passengers entering the bus meant that neither to these were used on this occasion. A further support rail ran along the front of the driver's pay station. A single ticket to Matlock cost the participant £2.70 as the participant had to pay adult fare. This price somewhat surprised the participant, who stated that due to the short length of the journey, they had presumed it would cost close to £2. They also at this stage bemoaned how there are no bus passes for young people, who after leaving school, are forced to pay adult fares. They raised the point of this lack of subsidisation perhaps discouraging young people from using public transport. It can be assumed that a return ticket would be approximately £4, this was approximately two thirds of an hours pay for participant A and could be an even higher percentage for many young people with part-time jobs. This included the first leg of the journey having been completed by getting a 'free' lift with family members, therefore the overall cost could have been higher.
The bus was fairly quiet meaning seats were easily found. Despite this amount of space though, without anywhere dedicated to keep baggage, the participant chose to keep it on their lap, within the profile of their seat. Other than placing it on a spare seat, which they felt was impolite, they felt that this was the only option. During the travelling phase, the participant would choose to listen to music using their phone, stating how they would always be wary of having this too loud though despite other people not always being so considerate. As well as this, they would use mobile applications and complete tasks such as checking emails. These processes could be supported on the bus via free USB charging sockets located under the seats. Further to this free Wi-Fi was available on board. The participant was not aware of these features before travelling, therefore could not use the USB option this time. Features like these can make the passenger's journeys more comfortable and enjoyable. It was also commented that this comfort factor was enhanced by the standard of seating. A new look leather style covering added a more luxurious feeling as well as a stronger look of cleanliness compared to fabric counterparts. As the journey continued, the participant spoke of how they again liked the thinking time of travelling, with being able to sit and enjoy the view, and added benefit of travelling via this method. They also revealed that despite having the driving power taken away, they in fact felt safer, as they felt further away from the road. They added that they were not the most confident of drivers, this may have been a contributing factor.
Due to the fairly pleasant nature of this journey, the participant had few complaints. 'Self-directed' mutters revolving around the number of stops and occasional loud passengers were the only real grievances. Therefore, there was no need for any complaints to be made to the driver; an available avenue. The final touchpoint the participant would come into contact with on the bus was on approaching the destination. Here the 'stop' button is pressed to signal to the driver that they would like to exit the service at the upcoming stop. This is where the only real time of concentration is required from passengers; to keep aware of where they are along the journey and signal when they are approaching their exit stop. The passenger experienced no problems with this system, as it was a well-known journey route they were undertaking. Perhaps when making journeys where the destination is not as well known to the passenger this could be an issue. Participant A also stated at this point that on occasion when they have travelled on very busy services it can be difficult accessing a stop button without feeling rude towards other passengers. It may be suggested that this could be a result of the participant's personality traits, perhaps being shyer than other passengers may be in a similar situation. However, it could be said that the service could be designed so that no passenger is faced with uncertainty or is uncomfortable with an integral part of the process. The participant exited the bus at the stop in Matlock, thanking the driver. From here was a 5 minute walk to complete the journey. Journey 2 was completed, door-to-door, in 49 minutes. This was over twice the length of journey 1, completed by car. This was seen to be the single most frustrating factor about the journey for participant A. They stated that to them, journey length is the most important thing.
During the journey, participant A also spoke about pressures of learning to drive. They defined how as a 17 year old they wanted to pass as soon as possible. This was largely down to their desire for independence and freedom, stating they sometimes felt trapped in their village. It was mentioned that they wanted to drive for quickness, for jobs, and to see friends; all of which they disliked having to rely on their parents for. They continued to talk about how they had the opinion that their location definitely increased the pressure and need to learn to drive. Further saying how if they lived in a city they believed this would not be the case, comparing it to university, where they could utilise bus services and cycle much more. They expressed a feeling of isolation in their rural location before they could drive.
Following the journey mapping process, the follow up survey designed to target people who also live in rural locations, was released. Question 1 aimed to gather an overview as to whether the unsatisfied view of participant A with regards to the public transport options in their area was shared by a larger number of people. As can be seen in Figure 4, over two thirds of the 25 respondents agreed and were also unhappy. This was however a fairly broad question without any background knowledge or previous questions of the participants into areas such as how often they actually use 'their' public transport system.
Figure 4 shows question 2 of the survey, which asked participants to rank the six suggested methods of transport in order of how frequently they use them. As it can be seen, the most used method of transport was car, with participants driving themselves being the most frequent response. This was found to be the clear favourite, taking 68% of the 1st place rankings. This draws attention to the overall reliance on cars that many people have for travelling. For this piece of research however, the remaining answers are perhaps more interesting. Falling in 2nd place overall, with 20% of the 1st place rankings and 52% of the 2nd , the results show the fairly large reliance many participants have on lifts from other people.
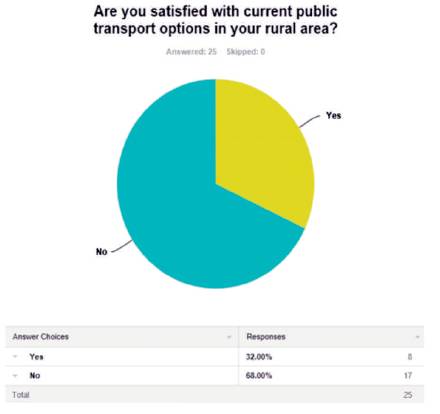
Figure 4. Survey Question 1 Results
It is curious that the two forms of public transport, fall in 4th and 5th place. Bus use was in fact the 2nd most frequent second placed method of transport however, perhaps suggesting that bus use is predominately used as a 'back-up' method of transport. Participant A earlier in the research stated how it was not possible for them to make many journeys via cycling or walking due to distance issues; judging from these results, however it would seem that this is not the case with a larger audience, as shown in Figure 5. On reflection, the question does not make any reference to journey length though. Therefore, participants may be referring to walking or cycling very short distances, for example to other places within the village. It could be assumed that the definitive lowest ranked position for taxis as method of transport is down to the high cost of such services.
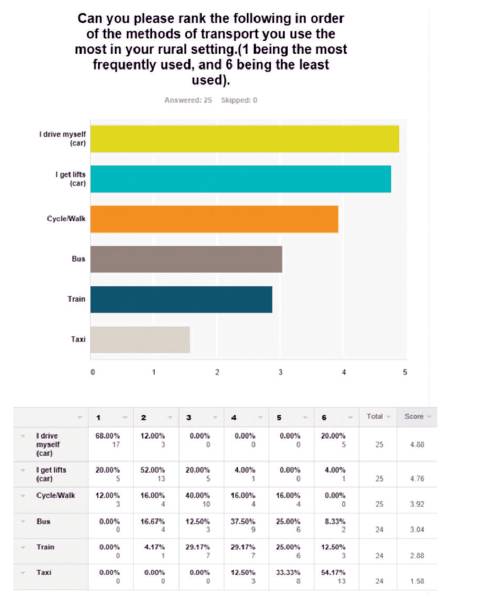
Figure 5. Survey Question 2 Results
The results of question 3 can be seen in Figure 6. This question aimed to verify or compare the views of participant A about what were the most important things to them about a journey. The survey participants largely agreed with 72% of the respondents also stating journey time, this was one of the most important things to them. The only factor to score a higher percentage of votes was 'ease/convenience'. This was seen as the most important factor to the survey respondents, with 76% selecting it. There were four clear characteristics which the respondents considered to be of highest importance. Reliability and cost are the remaining two of these factors both of which Participant A raised during the journey mapping process. It could be said that reliability could be linked to the worries participant A shared with regards to the service being on time. In addition to this, the survey respondents could have considered this in terms of the service not breaking down or having technical issues also. Features were raised throughout the journey mapping process associated with improving the comfort of the journey. Interestingly however, this factor was not considered to be as important by the respondents.
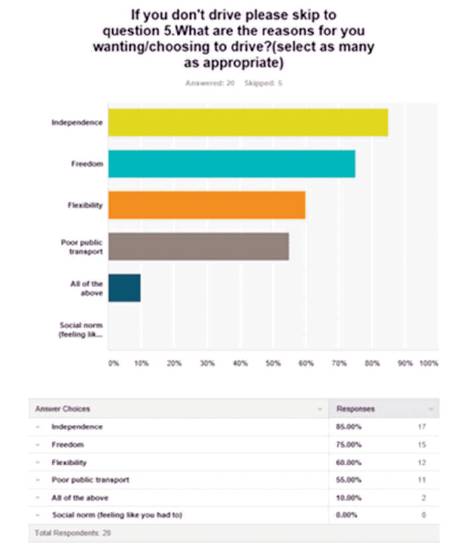
Figure 6. Survey Question 3 Results
Question 4 and its results can be seen in Figure 7. Through this question it was intended that a better understanding could be gained into why people choose to drive so much. It was thought that from this, characteristics would be discovered which the investigator could aim to evoke in the concluding taxi-bus service proposal. If these favoured characteristics of driving could be transferred to the proposed service in some capacity, it could create a more desirable service.
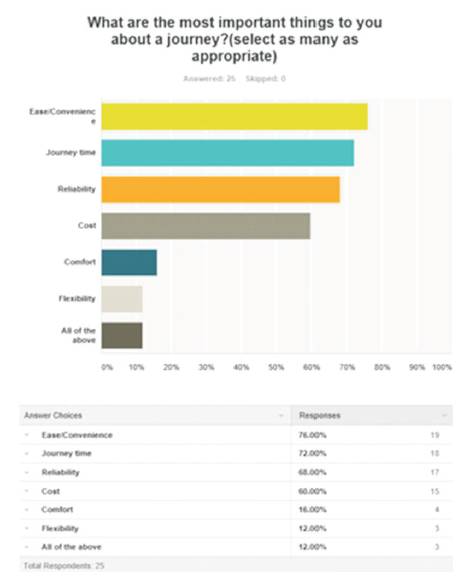
Figure 7. Survey Question 4 Results
As can be seen, the most frequently selected reason for participants wanting to drive was the independence it gave them. This was a feeling heavily featured in the information gained from participant A also. Freedom was another emotion participant A gained from being able to drive, a view shared by three quarters of the survey respondents. Both of these characteristics can be felt by individuals given the opportunity to travel on their own, without reliance on other people or family members. The flexibility of being able to drive is seen to also be one of the key factors with 60% of participants selecting this. The proposed service will therefore be best suited to aim to meet and provide this characteristic. Interestingly, poor public transport was specified by over half of the respondents to also be a reason for them to choose to drive. This builds on the findings from question 1. Interestingly none of the participants selected the fact they felt it was a social norm to learn to drive, as a reason that they do.
The final question in the survey aimed to gain insight into the initial research question regarding whether the location that people live can affect the pressure on them to learn to drive. This is an opinion that was most definitely shared by participant A during the journey mapping process. As can be seen in Figure 8, the vast majority of survey respondents also had this view. All but one of the participants said that they thought where people lived can affect the pressure on them to learn to drive. Out of the 96% which agreed, half of these 'strongly agreed'.
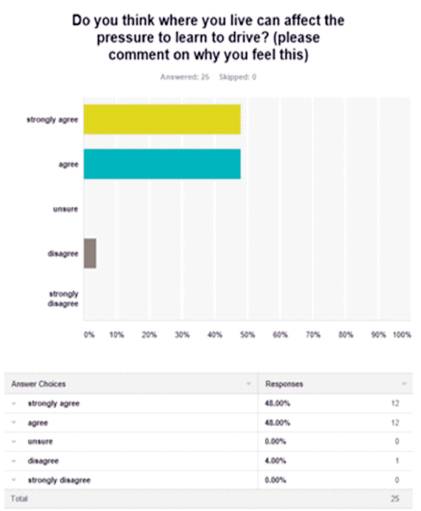
Figure 8. Survey Question 5 Results
As part of this question, participants were also asked to comment on the reason or reasons for the answer they gave. Of the 25 respondents, almost a third of these commented on why. The reasons given can largely be categorised into three sections; public transport, cost, and the ability to go and do things. With regards to public transport, the comments were complaints about the current services in the participant's local area. One participant specified how local buses did not run regularly enough in their rural location; others referred to their local services as “erratic”, “limited”, and “not reliable”. One suggested that this left them no option, but to learn to drive. Two of the contributors revealed how they felt that driving was the cheapest option available to them in their area. The remaining reasons given by participants revolved around the idea that driving gave them the ability to be able to go and do things; for freedom. In addition to this, one respondent mentioned how pressure from their parents was a contributing factor to them learning to drive. They stated how this was due to them previously relying on family members for lifts.
The visual documents created in support of this research can be used to generate some initial conclusions. From the touchpoint inventory it can be assumed that the pre-journey and post-travel phases are more complex if travelling by car than by bus due to the larger number of touchpoints encountered. Concurrently, the planning and travelling phases appear to be more in depth if travelling by bus. The size of the sub-sections in the two journey maps can also be used in a similar way. The 'size' of such sub-sections, or phases of the journey, should be considered to create the most streamlined service possible as part of the proposal.
Preliminary conclusions were drawn upon creation of the two journey maps and were used to form 'opportunities'; catalysts for the design proposal. It was concluded that reducing the reliance on, and the number of, cars being used to make such journeys should be an aim for the service. Further to this, it was determined that there was currently a reliance on car sharing and receiving lifts in rural areas as a replacement for poor public transport options. This was validated by the survey findings. It was also found that journey time, convenience, personal comfort, and cost were considered by the participant to be the key factors regarding a journey. Overall however, the length of the journey was of upmost importance to this user. The survey findings largely substantiated the conclusions drawn from the journey mapping process. Comfort was however not considered to be as important, with reliability taking its place. This is perhaps due to it being thought of as more of a luxury by a larger audience. It could for example, enhance a customer's journey and may help differentiate a service from its competitors and lead to repeat custom; but is not in fact seen as crucial to the success of the journey to the customer.
It can be concluded that there are current feelings that where people live, can lead to an increased level of pressure to learn to drive. Perhaps with better alternative transport options in rural areas, this would not be the case. There are, however, also other factors which could affect the amount of pressure people feel with regards to this, which have not been considered as part of this research.
One of these, pressure from parents, was mentioned in one survey respondent's answer.
Furthermore, it was found that current rural public transport systems can cause users feelings of anxiety and stress. It can be said that there is an underlying lack of trust between users and the reliability of the available services. Another interesting point to take from the journey mapping process is the desire from the participant to have 'me time' whilst making journeys on their own. Finally, it could be concluded that there is a place in the market for such a service as to which is being proposed. The findings suggested that despite favouring travelling by car, users stated some of the main reasons for this were poor public transport and a lack of other options.
Despite many of these conclusions sharing solid foundations in terms of the research undertaken here; this research was fairly limited in scale due to the time and resources available. To gain a more complete understanding repeat journeys need mapping with different participants and different types of journeys also need to be evaluated using this method. In addition to this, the survey responses need to come from a much larger number of people, from a wider demographic, to gain further validation.
The proposal is for a Demand Responsive Service for use in rural areas. This service would be accessed through a supporting app and would allow users to select vehicles making journeys in their area and 'book in' their addition to the journey. Journeys could be booked months in advance or on the day of their travel using a calendar style system. The vehicle profiles, costs, and routes are determined and affected by the end user. The app will help the user create and book their journey; offering the user opportunities to create the cheapest and most personal available journey option. User profiles can allow for specific needs to be catered for when selecting a vehicle and creating a journey. The proposed Demand Response Service or taxi-bus must aim to meet the following criteria: