Evaluation of Profitability Performance of Private Life Insurance Companies
Abstract
In this fundamental development of service in India, insurance service sector is additionally contributing altogether with an extremely normal development rate. Insurance is financial intermediation function through which one can expose to specified contingencies. A business organization is always established with the aim of earning profit from its operations. It is the profit, which act as a backbone for survival of every organization. Without earning profit, growth and stability of a business firm is not possible. As per IMF- Background paper (2003), indicators for measuring financial soundness of insurance Industry is CARAMEL framework. These indicators involve those quantitative factors which significantly affect the financial position of Life Insurance Companies. To analyze the 'earning and profitability', five leading private life Insurance Companies were taken up for the study. These companies were selected on the basis of their gross direct premium of 2017-18. The study is basically based on secondary data. The period of the study was 2013-2014 to 2017- 2018.
Keywords :
- Service Sector,
- Life Insurance Sector,
- Profitability,
- CARAMEL,
- IMF
Introduction
An all around created Insurance part is basic for financial improvement as it gives long haul assets to framework improvement in the meantime reinforcing the risk taking capacity of the nation (Charumathi, 2012). The risk taking job of Insurance providers advances budgetary soundness in the money related markets gives a "feeling of harmony" to monetary substances. The business world without Insurance is unsustainable since dangerous business might not have the ability to hold a wide range of dangers in this regularly changing and indeterminate worldwide economy (Anjor, Ali, Kumar, & Verma, 2014). Life Insurance plans are overseers and chiefs of generous speculations of people; and policyholders should be sure that their Insurance provider will have the capacity to meet its guaranteed liabilities if claims are made under an approach. The study recommended that because of unverifiable prospects for investments results, to achieve great profitability, the insurer must focus on accomplishing greater profitability (Rudolf , 2001).
Without profit no Insurance provider can pull in outside funding to meet its set destinations in this consistently changing and aggressive globalized condition. In this way, one of the goals of the board of Insurance organizations is to accomplish profit as a hidden prerequisite for directing any Insurance business. The gainfulness of insurance agencies can likewise be evaluated both at the miniaturized scale, and full scale dimensions of the economy.
Life Insurance overwhelms the worldwide protection advertise, representing 59.7% of the business sectors esteem. Life coverage industry in India was positioned ninth among the 156 nations, amid 2010-11. The aggregate sum of net premium of the entire life coverage industry expanded from  1, 55,863.59 crore in 2006- 07 to 290979.19 crore in 2010-11. During 2011-12 and 2015- 16, the position the measure of net premium enhanced a ton since a similar rose from 2, 86,308.48 crore to 3, 65, 440.10 crore in this duration. As of 2016, Life protection area has 29 private players in contrast with as it were four in FY02. With 70.4 percent share piece of the pie in FY16, LIC keeps on being the market chief, trailed by SBI (5.1 per penny), ICICI (4.9 percent), and HDFC (4.1 per cent). The disaster protection showcase developed from US $ 10.5 billion in FY02 to US $ 27.5 billion in FY16. Over FY02– FY16, life protection premiums extended at a CAGR of 7.5 per cent. The extra security industry has the possibility to grow 2-2.5 occasions by 2020 in disdain of various difficulties.
1. Review of Literature
The rising situation has implanted more noteworthy focused instability in the framework, in light of the fact that the Insurance part has now gone into a focused stage because of passage of more players in the protection field. Therefore there has been extension and development of Insurance both in the life and non-life business. Consequently, the bigger opportunity is currently being shared by the current and new players. Further industry will turn out to be progressively proficient (Shehbagramam, 2001).
Bajtelsmit and Bouzouita (1998) inspected the automobile industry and found the connection amongst profitability and market arrangement. The outcomes demonstrated that in private passenger automobile Insurance concentration has positive significant influence on physical damage lines as well as on productivity of combined lines.
Lai and Limpaphayom (2003) studied the Japanese life Insurance industry and inspected the relationship between organizational structure and firm performance. The study period was from 1983-1994. The outcomes show that lower expenses have been accounted by stock companies of Keiretsu group. Higher profitability has been registered by Keiretsu insurers. As compared to independent stock companies and mutual fund companies, these stock companies have reduced stage of free cash flow.
Dhanda (2004) observed the performance of LIC Business by utilizing both primary and secondary data. It was discovered that consistency in growth was not observed in individual business during the year 1957-1990. 60 percent of aggregate income was gotten by premium income and the rest of the pay was earned by investing funds. Training program organized by life Insurance workplaces influence the performance emphatically.
Chen and Wong (2004) analyzed the solvency of Asian general and life Insurance organization utilizing firm information and large scale data independently. Financial health of general Insurance is influenced by various factors like liquidity ratio, firm size, operating margin, combined ratio, Surplus growth, and investment performance. It was found that Asian financial rises badly affect the financial performance of Singapore insurers.
Deloittie and Touche (2004) focused on profitability and viability of the federal Multiple Peril Crop Insurance. Data of 1992-2002 have been used for analyzing the performance of both MPCI property and casualty Insurance business. Risk return advantage was not observed in MPCI business in respect to P&C business. Cummins and Zi (1998) showed that cash flow simulation variables add explanatory power to solvency prediction models.
The essential capacity of Insurance is risk pooling, i.e., the accumulation of assets from the policyholder pool and the redistribution of assets to those pool individuals who cause misfortunes. Claims are likewise a decent intermediary for "genuine administrations" given by backup plans, for example, inclusion structure and giving lawful protection in risk suits (Cummins and Zi, 1998). Notwithstanding, it is hard to comprehend why the board of insurance agencies would look to augment the estimation of protection claims. In this way, damages the chief trademark that more output ought to be wanted to less (Diacon, Starkey, & O'Brien, 2002).
The consolidated proportion is a proportion of acquired misfortunes to earned premiums in addition to caused costs to composed premiums (Rejda, 2001). In the divided administrative US life Insurance industry, McShane, Cox, and Butler (2010) discovered that the productivity measure, viz., working profit for value is emphatically identified with administrative challenge.
Utilizing overview strategy, Klumpes (2005) found that the senior administration of UK life coverage organizations utilized an incentive key for the executives arranging and control purposes. Taking both stock and shared life Insurance plans in New York State amid 1952-1966, (Spiller,1972) found that there is a distinction in size and item blend because of possession structure.
In this present situation of developing client base, one of the central concerns is for the control of insurance agencies that need to ensure the enthusiasm of and secure reasonable treatment to policyholders (Charumathi, 2012). Neelaveni (2012) assessed the execution of five extra security organizations at the time of 2002-03 for different plans and approaches based on yearly development rate. The examination presumed that Life Insurance Corporation being general society area was lacking behind because of rivalry looked by private Insurance providers while private non-life organizations had performed well regarding monetary assets.
Kasturi (2006) focused on the Insurance sector in terms of performance management. Financial performance of any Insurance company is generally expressed in terms of return on investment, profit earned, Return on equity, etc. Similarly, Uppal (2004) identified the factors influencing the profitability of five noteworthy bank groups. Period of study was 1997-2001. Mean standard deviation and variation have been ascertained for every factor and each bank. Sangmi (2002) in his study, analyzed the profitability and identified the factors which are responsible for profitability performance of 10 selected public sector commercial banks in India.
Savitha and Chaitra (2014) recognize the significance and performance of General Insurance Corporation (GIC) of India over the five years (2008-09 to 2013-14). Performance of GIC is also analyzed after discharging its hold on four subsidiary companies.
Literature shows that various studies have been conducted on performance analysis of insurance companies, but not many studies are conducted which particularly pinpoint the performance of private life insurance companies, especially in the current years.
2. Objectives
1. To assess the profitability ratios of selected private players of life insurance companies.
2. To identify the difference between ratios of selected companies.
3. Hypothesis
H0: There is no significant difference found in all the ratios of selected companies.
4. Research Methods
This study is based on secondary data. Five private life Insurance companies were selected on the basis of Gross Direct Premium of the financial year 2017-18. They are ICICI Prudential, SBI Life, HDFC Standard, Max Life, and Bajaj Allianz.
Data of last five years from 2013-14 to 2017-18 were taken for the study. To analyze the financial performance of the Life Insurance companies, CARAMEL framework has been used. It is suggested by a paper of (2003) IMF report that CARAMEL is a good indicator of measuring financial performance of any financial services. CARAMEL has different indicators, but only earning and profitability indicator is used for the study. For computing the profitability and analyses of the financial performance, seven variables were extracted, namely net premium income, underwriting income, return on assets, profit after tax, solvency ratio, etc. (Bodla & Bodla, 2017). Further, ANOVA has been used to analyze the difference between the ratios of selected companies.
Secondary data is used as a base for the study that has been gathered from annual report of IRDA, annual report of selected life insurance companies, published data websites, and so on.
5. Analysis and Interpretation
Profitability performance has been analyzed by calculating different ratios.
5.1 Return on Equity Ratio
Return on Equity ratio shows how efficiently the resources of the owners have been used (Anthony & Reece, 1995). It calculated the return accruing to owners' capital. It is computed by dividing profit after tax to Net Worth.
Table 1 reflects Return on equity ratio of private life insurance companies of private sector from the years 2013-14 to 2017-18. Among the life insurers, ICICI Prudential has shown the highest Return on equity ratio of 29.47 percent followed by HDFC Standard having 27.89 percent, Max Life with a percentage of 21.83, SBI Life with a percentage of 19.08, and Bajaj Allianz with a percentage of 9.70. ICICI Prudential registered highest Return on equity ratio for the selected years. The year wise analysis of net retention of private life insurance companies has registered a downward trend. Return on equity ratio in the year 2013-2014 was 26.02 percent, which was decreased with a percentage of 21.89 in the year 2014-2015, but again slightly decreased in the year 2015-2016 with a percentage of 21.07 percent. In 2017- 18, the companies registered a ratio of 18.3 percent.
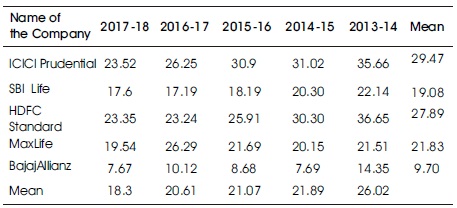
Table 1. Return on Equity Ratio of Selected Companies
5.1.1 Testing of Hypothesis: One Way ANOVA
H01: There is no significant difference found in Profit after tax to net worth ratio of selected companies during the study period.
Table 2 shows that p value is .413, which is more than 0.05 hence the null hypothesis is accepted. Thus there is significant difference found in Profit after tax to net worth ratio of selected companies during the study period.
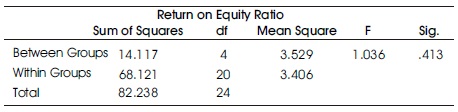
Table 2. ANOVA
5.2 Net Retention Ratio
Net Retention ratio defined as net written premium divided by gross-direct premium. It is a measure of the company's ability to bear risks.
Table 3 reflects Net Retention Ratio of life insurance companies of private sector from the years 2013-14 to 2017-18. Among the life insurers, HDFC Life has shown the highest average net retention ratio of 99.26 percent followed by SBI Life having 99.20 percent, Bajaj Allianz with a percentage of 98.94, Max Life with a percentage of 98.82, and ICICI Prudential with a percentage of 97.22. The year wise analysis of net retention of private life insurance companies has registered an upward trend. Net retention ratio in the year 2013-2014 was 97.04 percent, which was increased with a percentage of 99.13 in the year 2014-2015, but again decreased in the year 2015-2016 with a percentage of 99.03 percent. In 2017- 18, the companies registered a net retention ratio of 99.12 percent.
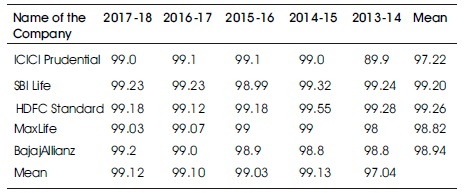
Table 3. Net Retention Ratio of Selected Companies
Higher net retention ratio gives higher investment income as more premium is used in investments. Above analysis shows that to increase their investment income and profitability, private companies need to enhance their net retention. With a strong capital base, companies are able to retain more of their portfolio. Whereas weak capitalization remained company with lower capacity to retain risk and hence higher utilization of reinsurance resulting in lower net retention.
5.2.1 Testing of Hypothesis: One Way ANOVA
H02: There is no significant difference found in net retention ratio of selected companies during the study period.
Table 4 shows that p value is .000, which is less than 0.05 hence the null hypothesis is rejected. Thus there is no significant difference found in net retention ratio of selected companies during the study period.
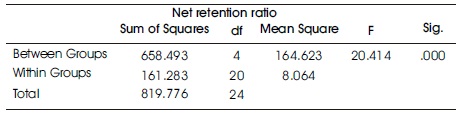
Table 4. ANOVA
5.3 Ratio of Expenses of Management
The ratio of expenses of management as percentage of gross direct premium reflects how much percentage of revenue is being utilized for expenses on management. This ratio is a pointer of the cost effectiveness and productivity.
Table 5 shows Expense ratio of life insurance companies of private sector from the years 2013-14 to 2017-18. Among the life insurers, Max Life has shown the highest expense ratio of 26.49 percent followed by Bajaj Allianz having 21.52 percent, HDFC Life with a percentage of 15.84, ICICI Prudential with a percentage of 14.44, and SBI Life with a percentage of 12.53. SBI Life registered lowest expense ratio for the selected years. The year wise analysis of net retention of private life insurance companies has registered a downward trend. This is a good sign for private life insurers. Expense ratio in the year 2013-2014 was 19.99 percent which was decreases with a percentage of 19.13 in the year 2014-2015, but again decreased in the year 2015-2016 with a percentage of 18.63 percent. In 2017-18, the companies registered an expense ratio of 16.11 percent.
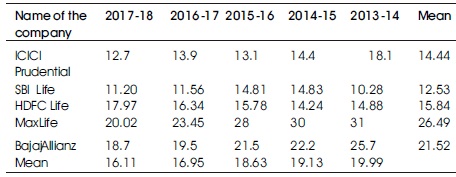
Table 5. Expense Ratio of Selected Companies
From Table 5 it was observed that due to increased competition, private life insurance sector had to pay out more on advertisements, commission, and other expenses. But after using different cost effective techniques, they are able to lower their expense of management ratio.
5.3.1 Testing of Hypothesis: One Way ANOVA
H03: There is no significant difference found in ratio of expense of management of selected companies during the study period.
Table 6 shows that p value is .512, which is more than 0.05 hence the null hypothesis is accepted. Thus significant difference is found in net retention ratio of selected companies during the study period.
5.4 Profit after Tax to Total Income Ratio
A high after-tax profit margin generally indicates that a company runs efficiently, providing more value, in the form of profits, to shareholders.
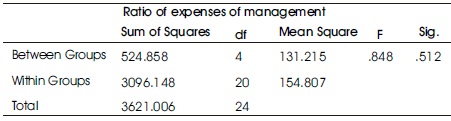
Table 6. ANOVA
Table 7 reflects Profit after tax to total income ratio of life insurance companies of private sector from the years 2013-14 to 2017-18. Among the life insurers, Max Life has shown the highest ratio of 16.11 percent followed by ICICI Prudential having 9.26 percent, Baja Allianz with a percentage of 7.94, SBI Life with a percentage of 3.75, and HDFC Standard with a percentage of 3.58. Max Life registered highest ratio for the selected years. The year wise analysis of private life insurance companies has registered a downward trend. Profit after tax to total income ratio in the year 2013-2014 was 17.94 percent, (highest in all the selected years), which was decreased with a percentage of 3.66 in the year 2014-2015, but increased in the year 2015-2016 with a percentage of 7.14 percent. In 2017-18, the companies registered a ratio of 5.68 percent.
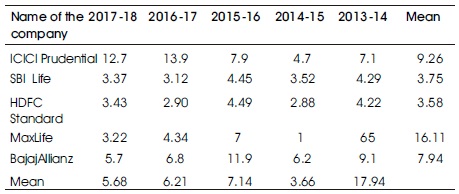
Table 7. Profit after Tax to Total Income Ratio
Decrease in Profit after tax to total income ratio during the selected years indicate negative sign for private life insurance companies.
5.4.1 Testing of Hypothesis : one way ANOVA
H04: There is no significant difference found in Profit after tax to total income ratio of selected companies during the study period.
Table 8 shows p value is .000, which is less than 0.05 hence the null hypothesis is rejected. Thus there is no significant difference found in Profit after tax to total income ratio of selected companies during the study period.
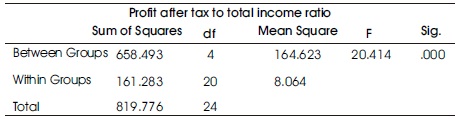
Table 8. ANOVA
6. Suggestions
- If focus will be given on management expenses, then surely it enhances management efficiency. If this parameter needs to be enhanced then ineffective workforce and unproductive divisions should be reduced. This action surely reduced expenses, which generally private insurers worry.
- Factors like risk and pricing no doubt help insurers a lot. Risk and price are some variables which are having control on claim and expense management. To reduce the combined ratio, guarantors have to put emphasis on evaluation of risk and setting of price that ultimately leads to expansion of underwriting profitability.
- Diversification and balance of risk should be permitted by IRDA to insurers so that they can prepare their portfolio accordingly. Investment income also upturns from this action.
- Regulator IRDA should permit insurers to develop diversified and risk balanced portfolio of investment. This passage will assist insurers to enhance investment income. The expanding investment income will reduce underwriting losses to a good degree.
7. Limitations
1. After Liberalization, Privatization, and Globalization, a number of private life insurance companies have opened their business in Indian soil yet this study is constrained to just five chosen life Insurance providers.
2. The information which has been utilized for the investigation is secondary information, so impediment of secondary information stays with it and furthermore applies to this investigation.
3. The Annual report contemplate depends on five years.
4. The differed measurable methods can be used.
Conclusion
The present examination has embraced to pick up knowledge into current financial performance of chosen organizations by utilizing productivity and gainfulness parameters of CARAMEL. The outcome will help the organizations in defining new monetary systems and strategies identified with risk management. For the most part, Earning and profitability parameter of CARAMEL centered on operational and non-operational income. Five companies have been selected for analyzing the financial performance. Data of five years from 2013-14 to 2017-18 have been chosen for the study. Net retention ratio, Profit after tax to net worth ratio, ratio of expense of management, and Profit after tax to total income ratio have been calculated. An attempt has also been made to analyze the difference between the ratios of different companies during the selected period. It was found that insurers have to take cautions while choosing profitable business otherwise their funds may get lost. They also have to make efforts to reduce their expense ratio. Investment income should also be increases to increase their total income.
References
[1]. Anjor, P., Ali, S. H., Kumar, M., & Verma, V. K. (2014). Service quality assessment: A study of consumer satisfaction in Indian insurance sector. IOSR Journal of Business and Management, 16(3), 34-41.
[2]. Anthony, R. N. & Reece, J. S. (1995). Accounitng Principles, Irwin Publisher.
[3]. Bajtelsmit, V. L., & Bouzouita, R. (1998). Market structure and performance in private passenger automobile insurance. Journal of Risk and Insurance, 65(3), 503-514.
[4]. Bodla, B., & Bodla, S. (2017). Profitability performance of Life Insurance Companies – A study in Indian context. International Journal of Computing and Business Research, 7(3),1-15.
[5]. Charumathi, B. (2012, July). On the determinants of profitability of Indian life insurers–an empirical study. In Proceedings of the World Congress on Engineering, 1(2) 4-6.
[6]. Chen, R., & Wong, K. A. (2004). The determinants of financial health of Asian insurance companies. Journal of Risk and Insurance, 71(3), 469-499.
[7]. Cummins, J. D., & Zi, H. (1998). Comparison of frontier efficiency methods: An application to the US life insurance industry. Journal of Productivity Analysis, 10(2), 131-152.
[8]. Deloittie, & Touche, L. (2004). Federal Crop Insurance Program: Profitability and Effectiveness Analysis. National Crop Insurance Services, 2-23.
[9]. Dhanda, R. L. (2004). Divisional Performance Evaluation of LIC Business in North Zone1. Finance India, 18(1), 229-233.
[10]. Diacon, S. R., Starkey, K., & O'Brien, C. (2002). Size and efficiency in European long-term insurance companies: an international comparison. The Geneva Papers on Risk and Insurance. Issues and Practice, 27(3), 444-466.
[11]. IMF (2003). Financial Soundness Indicators—Background Paper. Prepared by the Staff of the Monetary and Financial Systems and Statistics Departments. Retrieved from https://www.imf.org/ external/np/sta/fsi/eng/2003/051403b.htm
[12]. Kasturi, R. (2006). Performance management in insurance corporation. Journal of Business Administration Online, 5(1), 1- 30.
[13]. Klumpes, P. J. (2005). Managerial use of discounted cash-flow or accounting performance measures: Evidence from the UK life insurance industry. The Geneva Papers on Risk and Insurance-Issues and Practice, 30(1), 171-186.
[14]. Lai, G. C., & Limpaphayom, P. (2003). Organizational structure and performance: Evidence from the nonlife insurance industry in Japan. Journal of Risk and Insurance, 70(4), 735-757.
[15]. McShane, M. K., Cox, L. A., & Butler, R. J. (2010). Regulatory competition and forbearance: Evidence from the life insurance industry. Journal of Banking & Finance, 34(3), 522-532.
[16]. Neelaveni, V. (2012). Financial performance of Life Insurance Companies and Products. Zenith International Journal of Business Economics and Management Research, 2(3), 233-258.
[17]. Rejda, G. E (2001). Principles of Risk Management and Insurance. Pearson Education.
[18]. Rudolf, E. (2001). Profitability of the Non-Life Insurance Industry: Its Back to-Basics Time. Swiss RE, Sigma, 5, 1-38.
[19]. Sangmi, M. (2002). Profitability Management in Commercial Banks: An Exploratory study. The Business Review-Journal of the Faculty of Commerce and Management Studies. The University of Kashmir, Srinagar, 8(1), 36-49.
[20]. Savitha, S, & Chaitra, K. S. (2014). Performance Evaluation of General Insurance Corporation (GIC) Of India. ACME Intellects International Journal of Research in Management, Social Sciences & Technology, 2(1), 1-7.
[21]. Shehbagramam, R. (2001). Significance of financial services industry. International Journal of Applied Resaerch, 1(1).
[22]. Spiller, R. (1972). Ownership and Performance: stock and Mutual Life Insurance Companies. The Journal of Risk and Insurance, 39(1), 17-25.
[23]. Uppal, R. K. (2004). Profitability Behavior of Major Banking Groups in the Post-liberalization and Globalization Era. Indian Management Studies Journal, 8 (2), 107-129.