Table 1. Current Ratio of Cement Companies Operating in India
The Indian economy is going through a very interesting phase of recovery at the moment. All the eight core industries are going to play a very significant role in this phase of recovery. One must watch out for the contribution of Cement industry as one of the core infrastructures supporting industry of India in time to come. There is a huge potential for the growth of the industry. As India has more potential for development in the infrastructure and construction sector, the cement sector is expected to largely benefit from it. In this context, it becomes very relevant to study how strong are the fundamentals of the cement industry in India. This article attempts to do so by taking into accounts the financial performance of 8 top cement companies operating in India over the last five years from 2010-11 to 2014-15. The various aspects included in the study are the liquidity position, profitability position, and managerial efficiency.
Despite worldwide recession, issues in Indian banking system and troubled monsoon in last few years, Indian economy stands out in terms of growth as compared to other emerging economies and the financial systems remain stable as per the recent financial stability reports of RBI. India achieved a robust economic growth rate of 7.2 percent in 2014-15 and 7.6 percent in 2015-16, and hence became one of the fastest growing major economies in the world. According to the estimates of the International Monetary Fund (IMF), global average economic growth rate stood at 3.1 per cent in 2015, reflecting a decline from 3.4 per cent registered in 2014. While growth rate in advanced economies has been moderate since 2013, the emerging economies witnessed a consistently declining trend in growth rate ever since 2010. It is in this context that the recent growth story of India assumes a very high significance. Industrial sector in India, with a very significant role in realizing higher economic growth in the country, could register a higher growth during 2015-16 based on the performance of manufacturing sector. Higher FDI (Foreign Direct Investment) inflows, better performance of infrastructure sector, new landmark initiatives like Make in India, Ease of Doing Business, Startup India, Digital India, Smart Cities, etc., have further contributed to the better performance of industrial sector in India. The industrial sector is expected to be the key driver of economic growth in the country in time to come. The growth of the industrial sector comprising mining and quarrying, manufacturing, electricity, gas, water supply and other utility services, and construction is 5.9 per cent during 2014-15, as against 5.0 per cent during 2013-14. The growth is expected to strengthen further to 7.3 per cent for 2015-16 as per the advance estimates released by the CSO recently. Within the industrial sector, manufacturing is expected to register a growth of 9.5 per cent during the year 2015-16. In the first nine months of 2015-16, the growth rate in terms of the IIP was 3.1 per cent as compared to 2.6 per cent in the corresponding period of 2014-15. The eight core infrastructure-supportive industries (coal, crude oil, natural gas, refinery products, fertilizers, steel, cement, and electricity) having a total weight of nearly 38 per cent in the IIP recorded a cumulative growth of 1.9 per cent during April-December 2015-16 as compared to 5.7 per cent during April-December, 2014-15. India is the second largest producer of cement in the world. India's cement industry is considered a vital part of its economy. It provides employment to more than a million people, directly or indirectly. Since its deregulation in 1982, the Indian cement industry has attracted huge investments, both from Indian as well as foreign investors.
As India has a lot of potential for development in the infrastructure and construction sector, the cement sector is expected to largely benefit from it. Some of the recent major initiatives such as development of 100 smart cities are expected to provide a major boost to the sector. With the ever-increasing industrial activities, real estate, construction and infrastructure, in addition to the onset of various Special Economic Zones (SEZs) being developed across the country, there will be a growing demand for cement in time to come. An important factor which accelerates the growth of this sector is the ready availability of the raw materials for making cement, such as limestone and coal. The cement industry of India is dominated by a few large companies. The top 20 cement companies account for almost 70 per cent of the total cement production in the country. As per an estimate, India's cement demand is expected to reach 550-600 Million Tonnes Per Annum (MTPA) by 2025. Cement industry in India, which account for 2.41 per cent of IIP, has registered a compounded average growth rate of 6.21% over the ten years period. The average production of cement during 2005-2015 was 209759.8 thousand tonnes. Cement production registered a Compound Annual Growth Rate (CAGR) of 9.7 per cent in the period 2006–2013, producing 272 Million Tonnes (MT). The production of cement increased from 147808 thousand tonnes in 2005-06 to 270074 thousand tonnes in 20014-15. According to the Department of Industrial Policy and Promotion (DIPP) report, cement and gypsum products have attracted Foreign Direct Investment (FDI) worth Rs 13,370.32 crore (US$ 2.24 billion) between April 2000 and February 2014. The cement industry in India is said to be globally competitive as the industry is currently witnessing positive trends such as cost control, continuous technology upgradation and increased construction activities.
Fundamental analysis is the process of looking at a business at the basic or fundamental financial level. This type of analysis examines key ratios of a business to determine its financial health and gives an idea regarding the worth of the stock. To make successful investment in stocks, one needs to understand the direction and velocity of the company carefully. Velocity means the speed and distance a company achieves over time; this may be earnings, profit, sales or margin. On the other hand, direction indicates the way the company is going, up or down. In this paper, an effort is made to carry on a fundamental analysis of cement industry in India by taking eight top cement companies as a sample for the study. This will give us an idea as to the direction and velocity of the cement industry in India in general.
Various attempts have been made by different researchers to study the fundamentals of different sectors of the economy. The following are some of those studies:
Sahoo, and Mandal (2011) in their study of the performance of the Indian banking sector during the post transition period (1997-2005) suggested that, the nationalized banks are yet to exercise their cost minimizing principles compared to the other banks.
Similarly, Cheema, and Monika (2002) found that commercial banks operating in India are below the average level of efficiency.
Again, Sathye and Milind (2001) have observed that the mean efficiency score of Indian banks is compared well with the world mean efficiency score. He also observed that the efficiency of private sector banks as a group is paradoxically lower than that of public sector banks in India.
Ramudu, and Durga (2006) analyzed the profitability of the three major banks in India: SBI, ICICI, and HDFC for the period 2000-2005 and brought out the comparative efficiency of SBI, ICICI, and HDFC.
Sandhar, et al. (2013) analyzed the relationship between liquidity and profitability of selected Indian cement companies using regression analysis and observed that current ratio and liquid ratio are negatively associated with Return On Assets (ROA), Return On Investment (ROI) and, cash turnover ratio is negatively associated with ROI and ROA.
Gogia, N. and Gupta, D.K. (2013) conducted a study on liquidity position and impact on profitability of Tata Steel and Steel Authority of India. They found that liquidity position can be improved with the help of low average collection period and average collection can be reduced by proper coordination between sale, production and finance department. They concluded that there was a positive impact of liquidity position on profitability with the help of various techniques.
Ashok Kumar (2015) conducted a study on the liquidity position of five leading companies which cover a period of 10 years from 2000-2010. It has been observed that the liquidity position of small companies is better as compared to big ones. He found out that companies should maintain an ideal current and liquid ratio.
R. Amsaveni and Gomathi (2013) conducted the fundamental analysis of BSE listed FMCG companies for a period of 2006-07 to 2011-2012. They did an economic, industry and company analysis and from economic analysis it is observed that, GNP, Inflation, Interest rates, Exchange rate foreign exchange reserves, Agricultural Production, Government Receipts and expenditure have a positive growth rate during the study period and, gross domestic product, gross domestic capital formation savings and balance of payments has negative growth rate during the study period.
Sarvanan and Abarna (2014) studied liquidity position of selected automobile companies in India using Anova and found that there is significant difference among the absolute liquid ratios of the selected automobile companies.
Investment decision making is continuous in nature. Hence, it should be attempted systematically. There are two important approaches, such as, Fundamental analysis and Technical analysis. In fundamental analysis, the investor attempts to look at the fundamental factors that affect risk and return characteristic of the security. Economic and industry analysis are part of fundamental analysis. The main objective of the study is to,
The present study is descriptive and analytical in nature. The sample consists of eight top cement companies based on market capitalization. The sample companies are ACC, Gujarat Ambuja Cements, Indian Cement, UltraTech Cement, JK Cement, Ramco Cement, Prism Cements, and Shree Cements.
The variables which have been considered in the study are:
The period of study is from 2010-11 to 2014-15.
The data on key variables is compiled from the annual reports of the respective banks. The data is presented for the various financial years for all the companies except ACC, and Gujarat Ambuja Cements for which the data is based on calendar year.
H01 : There is no significant difference in Current Ratio between the sample units and within the sample units during the study period.
H02 : There is no significant difference in Quick Ratio between the sample units and within the sample units during the study period.
H03 : There is no significant difference in Operating Profit Margin between the sample units and within the sample units during the study period.
H04 : There is no significant difference in return on capital employed between the sample units and within the sample units during the study period.
H05 : There is no significant difference in return on assets between the sample units and within the sample units during the study period.
H06 : There is no significant difference in Inventory turnover ratio between the sample units and within the sample units during the study period.
H07 : There is no significant difference in debtor turnover ratio between the sample units and within the sample units during the study period.
H08 : There is no significant difference in assets turnover ratio between the sample units and within the sample units during the study period.
The statistical tools that have been used in this study include arithmetic mean, standard deviation, Compounded Annual Growth Rate (CAGR) and one-way analysis of variance.
The following are some of the limitations of the study:
A retail investor may not have huge investable surplus. Hence he cannot invest his money in all the different sectors. His ability to diversify investment is very much limited. A rational investor should try to identify few potential sectors first and then should go for an in-depth study of the sector. He should analyze carefully the fundamentals of sector before taking a final investment decision. Since, cement industry has a very significant role in the economic growth of India; it makes sense to carry on a fundamental analysis of this sector. This paper helps to understand the fundamentals of cement industry in India.
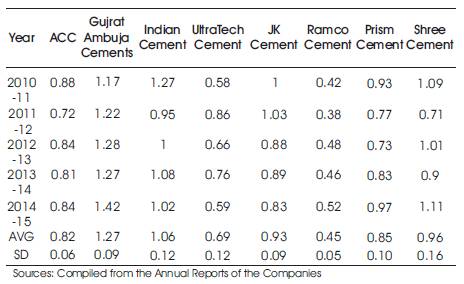
It shows the relationship between the current assets and the current liabilities. It is a financial ratio that measures whether or not a company has enough resources to pay its debt over the next business cycle (usually 12 months) by comparing firm's current assets to its current liabilities. A high ratio is an indicator of "safe" liquidity, but also it can be a signal that the company may be facing problems in getting paid its receivable amount or have long inventory turnover, both indicates that the company may not be efficiently using its current assets. Table 1 gives us an idea about the current ratios of the sample companies.
Table 1. Current Ratio of Cement Companies Operating in India
From Table 1, it can be noted that average current ratio of Gujrat Ambuja Cement is highest and that of Ramco Cement is least. This indicates that Gujrat Ambuja Cement has better liquidity position among the sample companies. But whether these differences are significant or not, it can be seen from Table 2 ANOVA Table.
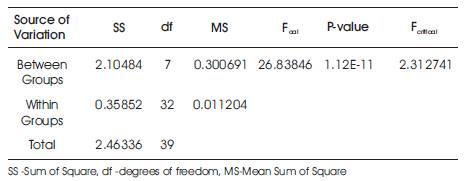
Table 2. One Way ANOVA for CR
As the calculated value (26.83846) is greater than the critical value (2.312741) at 5% level of significance, null hypothesis (H01) is rejected and hence it can be concluded that there is a significant difference in current ratio between the sample companies. Hence, it can be noted that Gujrat Ambuja Cement has better liquidity position compared to other sample companies based on the current ratio.
The quick ratio or acid test ratio is a liquidity ratio which is used to measure the ability of a company to pay its current liabilities when they become due with only quick assets. Quick assets are current assets that can be converted to cash within 90 days or in the short-term. Cash, cash equivalents, short-term investments or marketable securities, and current accounts receivable are considered quick assets. It is measured as quick assets divided by current liabilities. Table 3 gives an idea about the quick ratios of the sample companies.
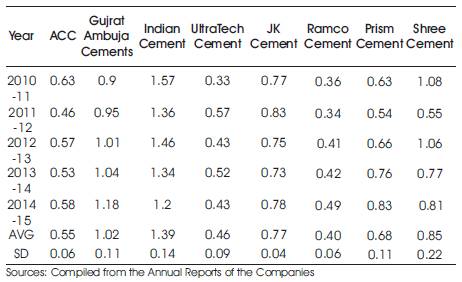
Table 3. Quick Ratio of Cement Companies Operating in India
From Table 3, it can be seen that the average QR is best for Indian cements followed by Gujrat Ambuja cements. It is again Ramco cements which has least QR ratio, followed by UltraTech Cements. But whether these differences are significant or not, it can be seen from the ANOVA Table 4.
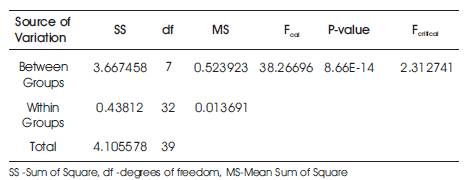
Table 4. One Way ANOVA for QR
As the calculated value (38.26696) is greater than the critical value (2.312741) at 5% level of significance, null hypothesis (H02) is rejected and hence it can be concluded that there is significant difference in the quick ratio between the sample companies. Hence, it can be said that UltraTech cement has better liquidity position compared to other sample companies based on current ratio.
Operating profit margin gives an idea about how much a company earns (before interest and taxes) on each rupee of sales. In other words, the higher a company's operating profit margin is, the better off the company is. If a company's margin is increasing, it is earning more per rupee of sales. Table 5 gives us an idea about the operating profit margin of sample companies under study.
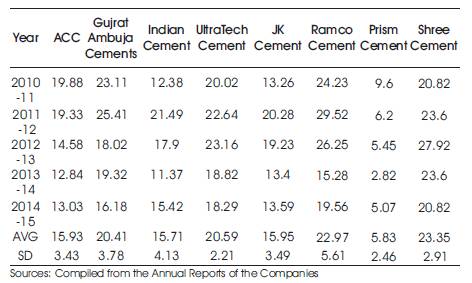
Table 5. Operating Profit Margin of Cement Companies Operating in India
It can be seen from Table 5 that the average operating profit of Shree cement is highest with very less variability followed by UltraTech cement and Gujrat Ambuja cement. But Prism cement has the least operating profit margin at 5.83%. Now, whether these differences can be treated significant or not, it can be observed by referring Table 6.
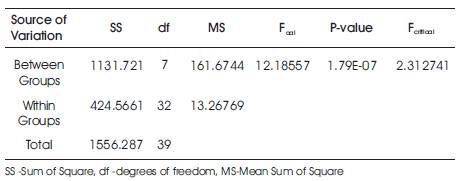
Table 6. One Way ANOVA for Operating Profit Margin
As the calculated value (12.18557) is greater than the critical value (2.312741) at 5% level of significance, null hypothesis (H03) is rejected and hence it can be concluded that there is significant difference in the operating margin between the sample companies. Hence, it is observed that Shree Cements has the best profitability position among the sample companies on the basis of operating profit margin.
Return On Capital Employed (ROCE) is a financial ratio which measures a company's profitability and the efficiency with which its capital is employed. A higher ROCE is an indication of more efficient use of capital. ROCE should always be higher than the cost of capital of the company; otherwise it indicates that the company is not employing its capital effectively and is not generating shareholder any value. Table 7 gives an idea about the ROCE of the sample companies in cement industry in India.
Table 7. Return on Capital Employed of Cement Companies Operating in India
From Table 7, it is observed that return on capital employed is highest for Gujrat Ambuja Cements and least is found in case of Prism Cements. The maximum variability was noticed in case of Shree Cements and least deviation was observed in case of Prism Cements. Now, whether this difference can be taken significantly or not can be observed by looking at the ANOVA Table 8.
Table 8. One Way ANOVA for ROCE
As the calculated value (4.680633) is greater than the critical value (2.312741) at 5% level of significance, null hypothesis (H04) is rejected and hence it can be concluded that there is significant difference in the Return on capital employed between the sample companies. Hence, it is observed that Gujrat Ambuja Cements has the best returns on capital employed and least is for Prism Cements.
This ratio measures how much a company earns in relation to the amount invested by the owner's of the business. It is calculated as earning after tax divided by owner's equity. Higher return on net worth is desirable by equity shareholders.
From Table 9, it can be noted that it is Shree Cements, which is earning highest return to the equity shareholders with a higher variability as indicated by SD. There is a continuous decline in return on net worth for most of the sample companies. The negative returns are observed in case of Prism Cements. The ANOVA Table 10 can be referred to see whether these differences can be taken significantly or not.
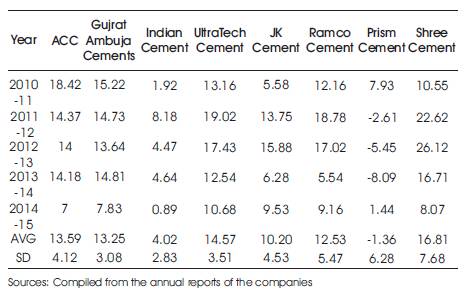
Table 9. Return on Net Worth of Cement Companies Operating in India
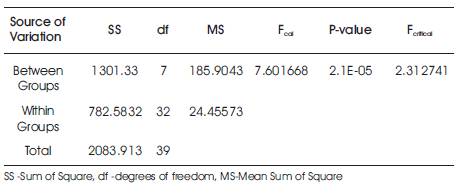
Table 10. One Way ANOVA for ROCE
As the calculated value (7.601668) is greater than the critical value (2.312741) at 5% level of significance, null hypothesis (H05) is rejected and hence it can be concluded that there is significant difference in the Return on Capital Employed between the sample companies. Hence, it can be concluded that Shree Cements has the best returns on net worth. But it is the Prism Cements which needs to be careful as it incurs losses on owner's fund.
This ratio indicates how quickly business is turning over stock. A high ratio may indicate positive factors such as good stock demand and management. A low ratio may indicate that either stock is naturally slow moving or problems such as the presence of obsolete stock. A low ratio can also be an indicative of potential stock valuation issues. It is a good idea to monitor the ratio over consecutive financial years to determine if a trend is developing.
From Table 11, it can be seen that average inventory turnover ratio is highest in case of Prism cement followed by Gujrat Ambuja Cements and ACC, but least in case of JK Cement. However, the highest variability is also noticed in case of Prism Cements. Now to test whether these differences are significant or not, the ANOVA Table 12 can be referred.
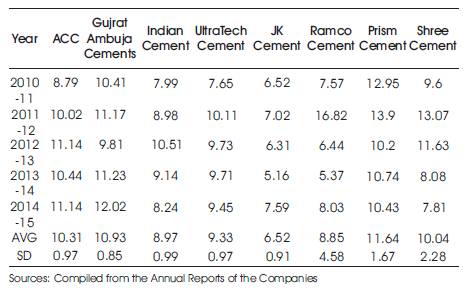
Table 11. Inventory Turnover Ratio of Cement Companies Operating in India
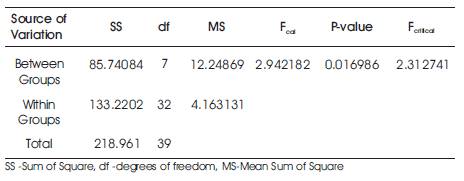
Table 12. One Way ANOVA for ITR
As the calculated value (2.942182) is greater than the critical value (2.312741) at 5% level of significance, null hypothesis (H06) is rejected and hence it can be concluded that there is a significant difference in the inventory turnover ratio between the sample companies. Hence, it can be concluded that Prism Cements is best among the sample companies as far inventory management is concerned. But it is JK Cements, which needs to focus more attentions for its inventory management.
It indicates the average time it takes for the firm to collect its debts. It is worth looking at this ratio over a number of financial years to monitor financial performance trends. A ratio that is lengthening can be the result of some debtors slowing down in their payments. Economic factors, such as a recession, can also influence the ratio. Tightening business' credit control procedures may be the need of the hour in this case. The debtor ageing ratio has a strong impact on business operations particularly working capital.
From Table 13, it can be seen that Gujrat Ambuja Cements has the highest debtor turnover ratio followed by ACC and Ramco Cement. But it is found to be least for Prism Cements. The highest variability is noticed in case of ACC and least variability is for Prism Cements. Table 14 gives an idea about the significance of these differences.
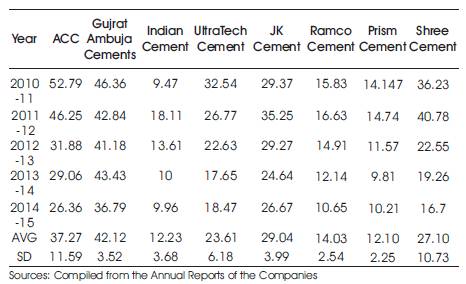
Table 13. Debtor Turnover Ratio of Cement Companies Operating in India
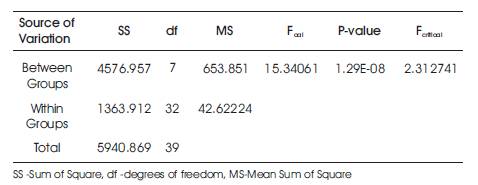
Table 14. One Way ANOVA for DTR
As the calculated value (15.34061) is greater than the critical value (2.312741) at 5% level of significance, null hypothesis (H07) is rejected and hence it can be concluded that there is significant difference in the debtor turnover ratio between the sample companies. Hence, it is observed that Gujrat Ambuja Cements is best among the sample companies as far as receivable management is concerned. But it is the Prism Cements, which needs to focus more attentions for its receivable management.
The Assets Turnover Ratio simply compares the turnover with the assets, which the business has used to generate that turnover. It measures how much turnover a firm is able to generate for each rupee invested in the form of assets. It is measured as sales divided by average total assets.
From Table 15, it can be observed that it is Prism Cements which has best Assets Turnover Ratio, followed by ACC and Shree Cements. That means these companies are generating highest turnover using their assets. The Indian Cement has got least activity ratio which indicates that it generates only 0.66 paise for every one rupee invested in the form of assets. To see whether there is significance difference in the Assets Turnover Ratio of the firm, ANOVA Table 16 is referred.
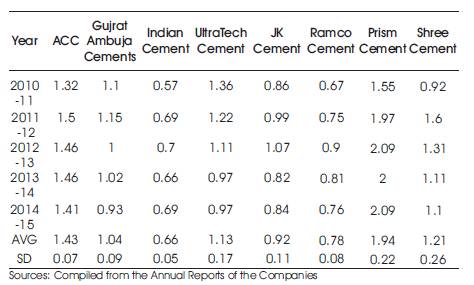
Table 15. Assets Turnover Ratio of Cement Companies Operating in India
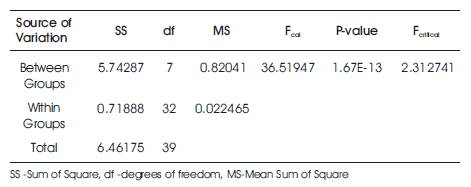
Table 16. One Way ANOVA for DTR
As the calculated value (36.51947) is greater than the critical value (2.312741) at 5% level of significance, null hypothesis (H08 ) is rejected and hence it can be concluded that there is significant difference in the Assets Turnover Ratio between the sample companies. Hence, it can be said that Prism Cements and ACC are making best use of their assets by generating maximum turnover. But the same cannot be said for the companies like Ramco Cements and Indian Cements.
From the above analysis, the following observations are worth mentioning on the liquidity, profitability and management effectiveness of the sample companies.
In terms of Liquidity, the companies differ significantly as far as the ability of the firms to meet current obligation is concerned. ACC, Gujrat Ambuja Cements, Indian Cement, and Shree Cements looked very good as far as Current Ratio and Quick Ratio is concerned. But Ramco cement and Prism Cement should pay immediate attention to the management of their current assets and current liability. For them, both Current Ratio and Quick Ratio are well below 1, which indicates that their chances of not meeting short obligations are very high.
In terms of Profitability, when the performance of the companies are compared on the basis of three important ratios like Return on Operating Profit, Return on Capital Employed, and return on net worth, it can be seen that their performance have differed significantly on each of the parameter. Shree Company has an edge over all other companies in terms of their return on operating profit ratio, whereas Prism cements has the least ratio. When it comes to return on capital employed ratio, ACC, Gujrat Ambuja Cement, Shree Cement and UltraTech Cement has impressive results as compared to Prism Cements and Indian Cement which have not performed well on this parameter. In terms of return on net worth ratio also, ACC, Gujrat Ambuja Cement, Shree Cements, and UltraTech Cement have outperformed other sample companies. Prism Cements and Indian Cement has to worry about their profitability of the firm.
Managerial Efficiency in the sense means how effective management is at managing its inventory, receivable and assets. There also the significant difference in the performance of the cement companies was noted. Companies like ACC and Gujrat Ambuja Cement are very good at managing their inventories and receivables. Prism Cements, Ramco Cement, and Indian Cements found lagging in these areas. However, when it comes to generating highest turnover, Prism Cements scored over all other sample companies.