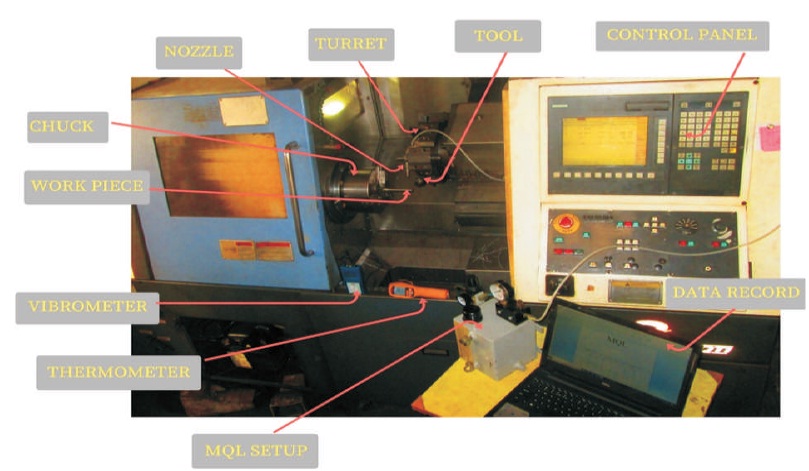
Figure 1. Experimental Setup
In today's machining applications, nanofluids created a revolution by replacing the various metal cutting fluids used in manufacturing industries, due to its distinct properties such as high thermal conductivity and lubrication. The optimization was done based on the experimentation on surface roughness and tool wear. To get optimized results the technique used was Grey Rational Analysis (GRA), Principle Composite Analysis (PCA), and Response Surface Methodology (RSM) optimization techniques on the turning of Titanium (Ti-Al-4V) alloy with the Nanofluid based Minimum Quantity Cutting Fluid (NFMQCFT) Technique. Here, Graphene nanoparticles are used to mix with the vegetable oil based (Soya Bean) cutting fluid. The experiment has been done by using several machining parameters such as feed rate, cutting speed, depth of cut, etc. An analysis has been made to evaluate the machining parameters for surface roughness values (Ra) and Tool wear based on the actual series of experiments with uncoated carbide tool. The outcomes state that the feed rate has a greater influence on the values of surface roughness as compared to cutting speed. The predicted results are identical to the experimental values. Since this research has multi-objective, these developed models using response surface methodology, grey rational analysis, and principle composite analysis can be used for evaluation of surface roughness and tool wear.
Titanium alloys are the most advantageous materials for various industrial applications such as marine, aerospace and biomedical industries as they have so many impressive characteristics like high strength to weight ratio, highly resistive to corrosion and fatigue, better fracture toughness, etc. But, the machinable quality of titanium is quite less due to low thermal conductivity. This may lead to high-temperature cutting zone and causes high tool wear as well as poor surface finish (Khanna & Davim, 2015). At present, surface finish has emerged as into a prime performance parameter and has a large effect on various mechanical properties of machinable parts such as resistance to corrosion, creep and fatigue. It also influences the functional aspects of work parts like friction, wears, light reflection, etc. (Routara, Bandyopadhyay, & Sahoo, 2009). Sargade, Nipanikar, and Meshram (2016) analyzed surface roughness and cutting force for turning of Ti-6Al-4VELI in a dry environment. It was found that the feed rate is the most influencing factor on the surface roughness values. Shyha, Gariani, and Bhatti (2015) investigated the effects of cutting tools and working conditions on cutting of Ti-6Al- 4V using vegetable oil-based cutting fluids. It was found that the tool flank wears increases as the cutting speed increases and also increase in depth of cut (Shyha et al., 2015). Sharma, Tiwari, and Dixit (2016) studied the effects of MQL technique in various machining processes. The outcome revealed that the vegetable oil based MQL produces better surface finish and minimizes the cutting forces than other cooling techniques. Mia, Khan, & Dhar (2017) conducted an experiment on turning titanium alloy with high-pressure coolant. The relation was found as the surface roughness can be minimized by the low feed rate and high cutting speed. Debnath, Reddy, and Yi (2016) studied various effects of cutting fluid levels and cutting parameters on surface roughness. It has been found that the feed rate is the most influencing factor on surface roughness, where the cutting speed has the most effect on tool wear. But the cutting fluid can influence the surface roughness as well as tool wear. Garcia and Ribeiro (2016) conducted end milling experiments on Ti-6Al-4V alloy using Minimum Quantity Lubrication technique. It was found that MQL provides better lubrication and cooling in machining and can lead to reducing surface roughness and improves tool life by reducing thermal shock to the tool. Eriki, Rao, Babu (2014) investigated the effects of parameters on CNMG cutting tool in turning titanium alloy. They analyzed that the speed and feed where the most effective parameters affecting the flank wear proportionally. D'Mello, Pai, and Puneet (2017) studied optimization of machining parameters on highspeed turning of Ti-6Al-4V alloy. It has been observed that, for high-speed machining, the high cutting speed with a minimum depth of cut and feed rate gives minimum surface roughness values as well as higher tool flank wear. Sharif and Rahim (2007) worked with coated and uncoated carbide tools for drilling titanium Ti 6Al 4V alloy. They concluded that the coated drill is better than uncoated carbide drill due to better results in less surface roughness values and higher tool life. Ramesh, Karunamoorthy, and Palanikumar (2008) analyzed surface roughness in machining of titanium alloy. It was found that the surface roughness increases with increasing feed and can decrease with increase in cutting speed. Setti, Ghosh, and Rao (2012) experimented on Ti-6Al-4V alloy by grinding operation with Nanofluid MQL Technique. They found that the Nanofluid MQL can minimize the grinding forces and improves the surface finish. Rao, Rao, and Srihari (2013) researched about the significance and influence of cutting parameters on cutting force and surface finish in turning operation. They concluded that the feed rate has large influence on surface roughness rather than the cutting speed and depth of cut. Ananth and Vasudevan (2013) studied the effects of various cutting parameters on surface quality in turning operation. They found that the feed rate and cutting speed are the most influencing factors on the surface quality and cutting forces. A research was done by Sahu, Andhare and Raju (2018) on Nanofluid using multi-walled carbon Nanotubes for machining of Ti–6AL–4V. They worked with titanium alloy (Ti-6AL-4V), which is one of the hardest material and also having low heat conductivity. They concluded as the lower operating temperatures can lead to improving the tool life. And nano fluid medium can reduce cutting forces and increases surface finish (Sahu et al., 2018). Songmei, Xuebo, Guangyuan, and Amin (2017) did done an experiment on applying Nanoparticles in minimum quantity lubrication for milling of Ti-6Al-4V. They used different Nanoparticles such as Copper, Graphite, etc., in different proportions. They evaluated as the Copper and Graphite Nanoparticles have similar effects on reduction of cutting force and surface roughness, depth of cut has a greater influence on cutting force (Songmei et al., 2017). Kim, Kim, and Lee (2017) conducted an experiment on end milling of titanium alloy using Nanofluid minimum quantity lubrication with chilly gas. They used vegetable oil for mixing Nanofluid particles. They observed that the co-efficient of friction plays a vital role on the machining performance, and, it varied based on liquids used for lubricating (or) cooling. Among different working mediums such as dry, MQL, Nano MQL, etc., nanofluid MQL is the most advantageous technique (Kim et al., 2017). Srithar, Palanikumar, and Durgaprasad (2014) conducted an analysis on Hard Turning of AISI D2 Steel using coated carbide insert. They found that increase in cutting speed reduces cutting forces in case of hardened steel, and as the feed rate and depth of cut increases, the cutting forces also increased (Sridhar et al., 2014). Gupta and Sood (2017) investigated on surface roughness in NFMQL assisted turning titanium alloys. They mainly focused on approach angle and surface roughness. As the approach angle of tool increased the work surface gives less contact between tool and work that leads to less noise and vibration resulting in the good surface finish. They concluded that the surface roughness can be decreased by using graphite based Nanofluid particle rather than the aluminum-based Nanofluid particles (Gupta & Sood, 2017). Luo, Wang, Wu, and Zhang (2017) studied the effects of cutting parameters on tool wear in end milling of titanium alloy Ti-6Al-4V". They mainly focused on cutting speed, axial depth of cut, radial depth of cut and feed per tooth. They concluded, cutting speed has less influence on tool wear under low feed rate per tooth. Feed rate per tooth and radial depth of cut has a great influence on tool wear proportionally (Luo et al., 2017). Chauhan and Dass (2012) optimized machining parameters for machining of titanium alloy Ti-6Al-4V. The results indicate that the surface roughness can increase with increase in cutting speed and feed. Sahu and Choudhury (2015) optimized machining parameters based on surface roughness and tool wear using Taguchi methodology. It has been observed that a necessary combination of low feed rate and high cutting speed should be maintained to achieve a minimized surface roughness value. Dureja, Gupta, Sharma, and Dogra (2009) designed a model for optimization of cutting conditions and their effects on tool wear and surface roughness. They summarized that response surface methodology is an effective technique for optimization of parameters of surface roughness and tool wear; also, feed and workpiece hardness are the most influencing factors on tool wear. Ahmed and Kumar (2016) optimized reaming process parameters on titanium alloy using Grey rational analysis. This study revealed that the performance of reaming operation can be varied by the use of different cooling conditions. Asiltürk, Neşeli, and Ince (2016) studied the models of data optimization on parameters of surface roughness on CNC turning of Co28Cr6Mo medical material by using RSM and Taguchi methods. It has been found that the minimum combination of feed rate and speed gives minimum surface roughness. An experiment and analysis for optimal decisions on turning Ti-6Al-4V conducted using the Taguchi-Grey method suggested that the feed rate, cutting speed and back rake angle are the main parameters influencing the minimization of surface roughness (Satyanarayana, Gopal, and Babu, 2014). Khidhir, Al-Oqaiel, and Kareem (2015) developed a model for optimum cutting parameters by response surface methodology. They proved that the predicted model has only 0 to 2% of error than in actual CNC machining. Makadia and Nanavati (2013) studied the machining parameters of turning operation using response surface methodology. They found that the surface roughness increased with increase in feed, and decreased with a decrease in nose radius, and concluded that RSM is an efficient technique for prediction of surface roughness model. Kumar and Narang (2013) optimized the turning parameters by using Grey rational analysis. They concluded that this method is efficient for multiple performance characteristic turning operation models for accurate prediction. Narayan and Aswathy (2015) analyzed multi responsive turning model using Grey rational analysis. This study found that the feed and nose radius were the most influencing parameters for surface roughness. Vinayagamoorthy and Xavior (2014) used Grey rational analysis for optimization of multiobjective turning model. They found the optimal results of various parameters such as surface roughness, tool wear and cutting temperature using this GRA technique. From the point of view of earlier researchers, most of them used RSM and GRA techniques individually. No research were found using NFMQCF turning of titanium grade 5 with the combination of both RSM and GRA optimization techniques with uncoated carbide inserts for multi responses. This experiment was done with the above mentioned objectives and analyzed with the combination of the above two optimization techniques.
In this experiment, Minitab software, response surface method, the Box-Behnken method were used for experimental design. The input parameters were speed (100, 150, 200) m/min, federate (0.1, 0.15, 0.2) mm/rev, depth of cut (0.2, 0.3, 0.4) mm, and three different cooling condition, (flood cooling, MQL, nano fluid based minimum quantity cutting fluid technique (NFMQCFT). The preplan of the experimental design would reduce unnecessary experimental trails and save production time and money. Material used was Titanium Grade 5 alloy (36 HRC) as round bar with the dimensions of 300 mm length and 31mm of diameter. The chemical composition of the work material is 90% of Titanium, 6% Aluminum and 4% Vanadium. Initially, the outer layer of 1 mm was turned (Ø31 mm to Ø30 mm) to eliminate oxidized layer and to convert into exact size (Figure 1).
Figure 1. Experimental Setup
Then, the actual series of turning tests were performed on JYOTI CNC Machine (DX 200 Model) with SINUMERIK Control system. The uncoated carbide tools (CNMG 120404) was having a nose radius of 0.4 mm. A new tool and 100 mm of cutting length were used for each experiment to analyze the tool wear at each test for the input parameters.
Figure 2 shows the Uncoated Carbide Tool Insert (CNMG 120404). Specification of the Jyoti CNC Lathe (DX 200 Model) Used for the Experiment is shown in Table 1 and Specification of Uncoated Carbide Tool (CNMG 1204040) is shown in Table 2. Specifications of MQL Setup is shown in Table 3.
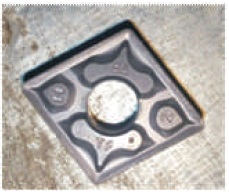
Figure 2. Uncoated Carbide Tool Insert (CNMG 120404)
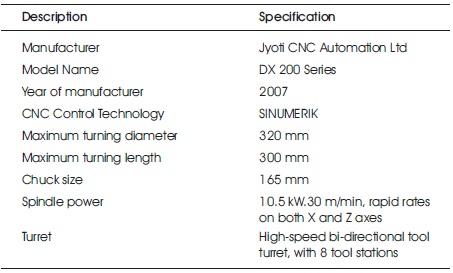
Table 1. Specification of the Jyoti CNC Lathe (DX 200 Model) Used for the Experiment
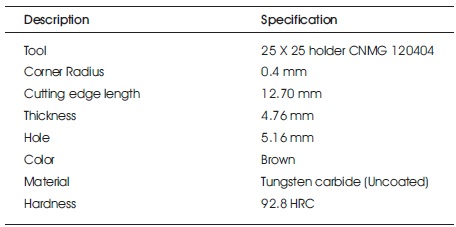
Table 2. Specification of Uncoated Carbide Tool (CNMG 120404)
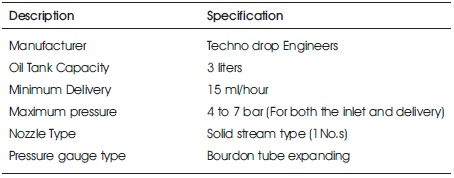
Table 3. Specifications of MQL Setup
The whole experiment was involved with three different conditions such as dry, soluble oil MQCF and Nanofluid based MQCFs. A vegetable oil based (soya bean) cutting fluid was used as a soluble oil which is biodegradable in the environment. In Nanofluid based MQCF, Graphene Nanoparticles were mixed with soluble oil in a certain proportion by mechanical stirring. Figure 3 shows MQCF System made by Techno Drop Engineers Pvt. Ltd. with 3 Liters of oil tank capacity, used for the experiment.
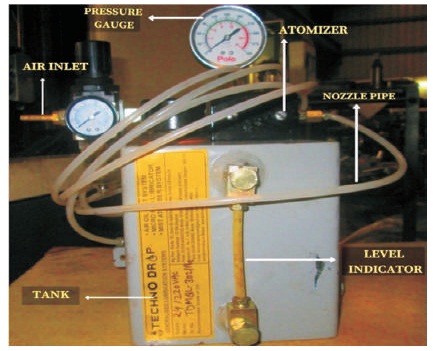
Figure 3. MQL Setup
Surface roughness is a result obtained by the machining action in the form of irregularities and peaks and valleys on the machined surface. The TR 200 surface roughness tester (TIME) was used for measuring surface roughness values. These values are taken at three different positions on the surface and the mean of them taken as the roughness value. This step was repeated for each experiment. Tool wear was measured by using toolmakers microscope, Mitutoyo, SEM analysis was done to observe the actual wear of tool graphically.
GRA is a decision-making technique based on grey system theory originally developed by Deng. In grey theory, black represents a system with deficient information, while a white system stands for complete information. However, the grey relation is the relation with incomplete information and is used to characterize the grade of association between two sequences so that the distance between two factors can be measured discretely. When experiments are unclear or if the experimental method cannot be carried out accurately, grey analysis assists in checking for the deficiency using statistical regression. Grey relation analysis is an effective means of analyzing the relationship between sequences with fewer data and can analyze many factors that could overcome the disadvantages of statistical method.
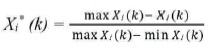
When the range of sequences is large or the standard value is large, the function of factors is neglected. However, if the factor measured unit, goals, and directions are different, then the grey relational analysis might produce incorrect results. Therefore, original experimental data must be pre-processed to avoid such effects. The data pre-processing is the process of transforming the original sequence to a comparable sequence. For which, the experimental data are normalized in the range of 0 and 1. The process is called generation of grey relation. There are three different kinds of data normalizations that are generally carried out, rendering whether the lower is better (LB) or the higher is better (HB) or the nominal the better (NB). If the target value of the original sequence is as small as possible, then it has a characteristic of the lower, the better. The normalization is taken by the following equations. LB and the original sequence should be normalized as follows:
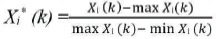
If the expectancy is as high as possible, then the original sequence should be normalized by the following equations for HB:
Conversely, if there is a specific target value to be achieved, then the original sequence will be normalized by the following equation of NB.
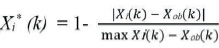
where i = 1,... n; k = 1, 2,..., p; Xi* (k) is normalized value of the kth element in ith sequence, Xob (k) is desired value of the kth quality characteristic, max Xi* (k) is the largest value of Xi (k), and min Xi* (k) is the smallest value of Xi (k), n is the number of experiments, and p is the number of quality characteristics.
A grey relational coefficient is calculated to display the relationship between the optimal and actual normalized experimental results. The grey relational coefficient can be expressed as,
where Δ0,i (k) = |X0(k) − Xi (k)| is the difference of the absolute value X0(k) − Xi(k); and ζ is the distinguishing coefficient or identification coefficient. In general, it is set to 0.5. Δ min is the smallest value and Δ max is the largest value of Δ0,i respectively.
Finally, the grey relational grade 0 ≤ ζ ≤ 1 was obtained by calculating the average values of all the grey relational coefficients. The grey relational grade γi can be compounded as,
Where n is the number of process responses. The higher value of GRG corresponds to the intense relational degree between the reference sequence X0(k) and the o given sequence Xi(k). The reference sequence X0(k) represents the best process sequence; therefore, higher GRG means that the corresponding parameter combination is closer to the optimal. The mean response for the GRG with its grand mean and the main effect plot of GRGs are very important because optimal process condition can be evaluated from this plot. With the values above, the influential degree of the factors on the system could be identified Table 4.
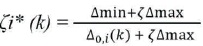
Table 4. Normalized and dev.seq Values for Ra, Flank Wear, Creator Wear
PCA is a mathematical approach that converts a set of observations of probably correlated variables into a set of uncorrelated variables. It was invented by Karl Pearson. Eigen values relavent to this paper are represented in Tables 5 and 6.
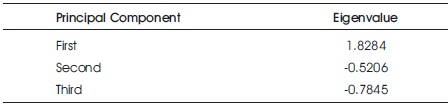
Table 5. The Eigenvectors for Principal Components
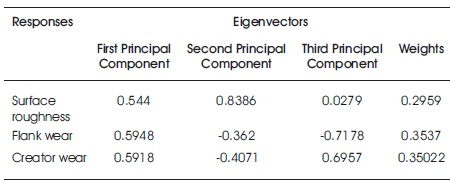
Table 6. The Eigenvalues and Weights for Principal Components
PCA is mostly used as a tool in investigative data analysis and for the information of predictive models. PCA can be done by Eigenvalue decomposition of data covariance matrix or singular value decomposition of a data matrix. It is used to identifying patterns in data and to express data to highlight their similarities and differences. The main advantage of PCA is that once the patterns in data have been identified, the data can be compressed, i.e. by reducing the number of dimensions, without much loss of information. The explicit goals of PCA are to:
The procedure is described as follows:
The original multiple quality characteristics array
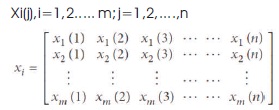
Where m is the number of experiment and n is the number of the response. In the present work, x is the grey relational coefficient of each response and m=30 and n=3.
The Correlation coefficient array is evaluated as follows:
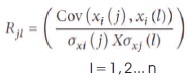
where Cov(xi(j), xi (l)) are the covariance of sequences xi (j) and xi (l), respectively; σxi(j) is the standard deviation of sequence xi(j); σxi(l) is the standard deviation of sequence xi (l).
The eigenvalues and eigenvectors are determined from the correlation coefficient array:
Where λx eigen value Σnk=1 λk = n, k = 1,2,……, n, and
Vik [ak1 ak2 ......akm] T is the eigenvectors corresponding ik to the eigenvalue λk.
The uncorrelated principal components are formulated as,
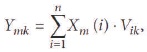
Where Ym1 is called the first principal component, Ym2 is called the second principal component and so on.
The principal components are aligned in descending order with respect to variance, and therefore, the first principal components Ym1 accounts for most variance in the data Table 7.
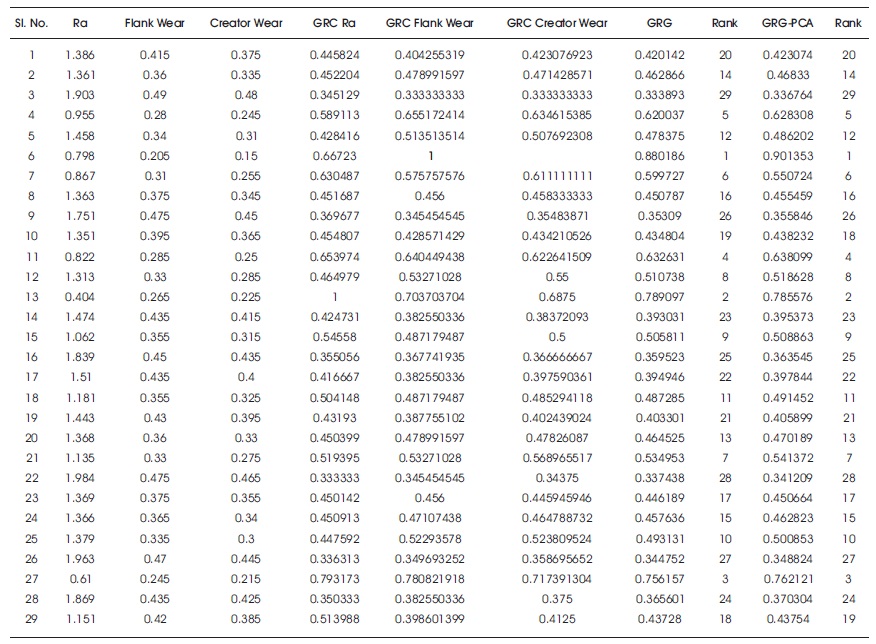
Table 7. GRC, GRG, Rank Values for Ra, Flank Wear, Creator
The coefficient of determination R-Sq value for all the three responses in the current study are obtained from the analysis of variance (ANOVA) and are discussed under respective tables
The R-sq value is 99.54% it shows model to be fit, lack of fit significant, F-valve is 116.62, the main effects plots for surface roughness showing that initially speed increases surface roughness decreases, roughness increases with the feed, no certain impact of depth of cut on surface roughness, dry cutting surface roughness is more compared to MQL, but, NFMQLCF technique is showing better results compared to dry, MQL, machining condition Table 8 and Figure 4.
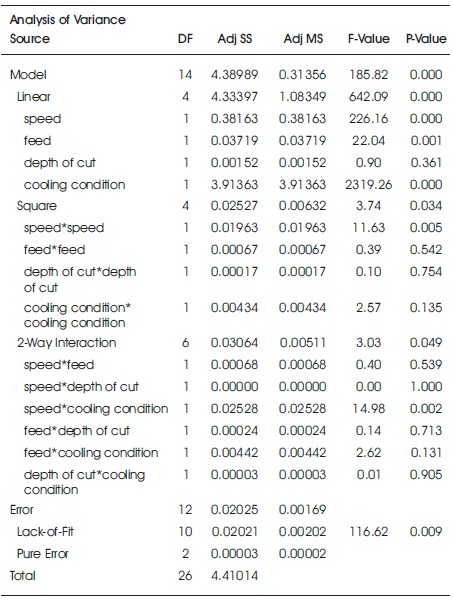
Table 8. Response Surface Regression: Ra versus Speed, Feed, Depth of Cut, Cooling Condition
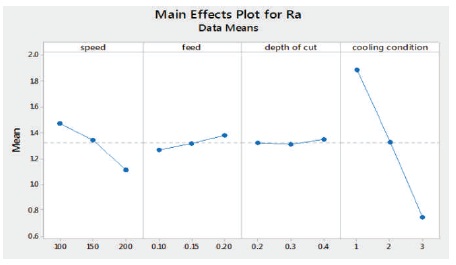
Figure 4. Main Effect Plot for Surface Roughness
Surface Roughness (Ra)=1.886+ 0.00611 speed+ 0.81 feed+ 0.05 depth of cut+0.311 cooling condition- 0.000024 speed * speed- 4.47 feed * feed + 0.57 depth of cut * depth of cut-0.0285 cooling condition*cooling condition+ 0.00520 speed * feed+ 0.00000 speed * depth of cut - 0.001590 speed * cooling conditions 1.55 feed * depth of cut+ 0.665 feed * cooling condition0.025 depth of cut * cooling condition.
The R-sq value is 99.67% it shows model to be fit, lack of fit significant, F-valve is 6.59, the main effects plots for flank wear showing that initially, flan wear is high, speed increases flank wear decreases some certain speed level no much changes in flank wear, flank wear increases with the feed, flank wear increases with increases in depth of cut, in dry cutting flank wear is more compared to MQL, but, NFMQLCF technique is showing better results compared to Dry, MQL, machining condition Table 9, Figure 5.
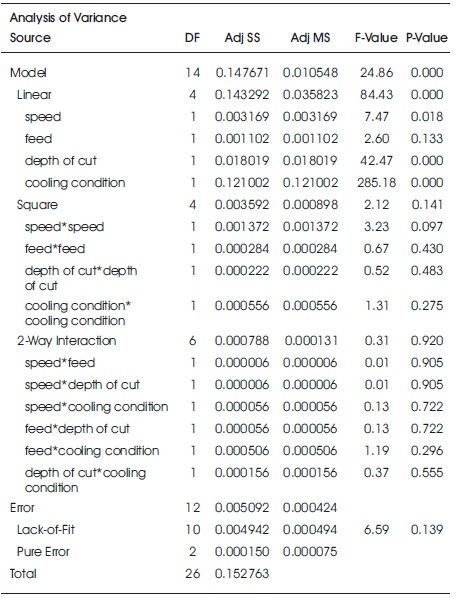
Table 9. Response Surface Regression: Flank Wears versus Speed, Feed, Depth of Cut, Cooling Condition
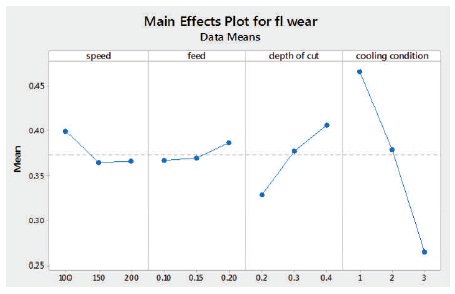
Figure 5. Main Effect Plot for Flank Wear
Flank wear = 0.679 - 0.00195 speed - 1.28 feed + 0.575 depth of cut - 0.1008 cooling condition + 0.000006 speed * speed + 2.92 feed * feed - 0.646 depth of cut * depth of cut - 0.01021 cooling condition * cooling condition - 0.00050 speed * feed - 0.00025 speed * depth of cut - 0.000075 speed * cooling condition + 0.75 feed * depth of cut + 0.225 feed * cooling condition + 0.063 depth of cut * cooling condition.
The R-sq value is 97.84% it shows model to be fit, lack of fit significant, F-valve is 3.93, the main effects plots for creator wear showing that initially, creator wear is high, no impact of feed on creator wear, creator wear increases with of depth of cut, in dry cutting creator wear is more compared to MQL, but, NFMQLCF technique is showing better results compared to Dry, MQL, machining condition. Table 10, Figures 6, 7, 8, 9 are sem images Tables 11, 12, 13 are optimized values.
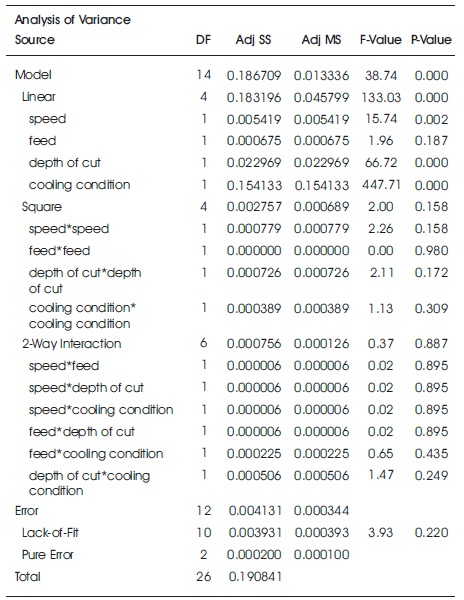
Table 10. Response Surface Regression: Creator Wear, Versus Speed, Feed, Depth of Cut, Cooling Condition
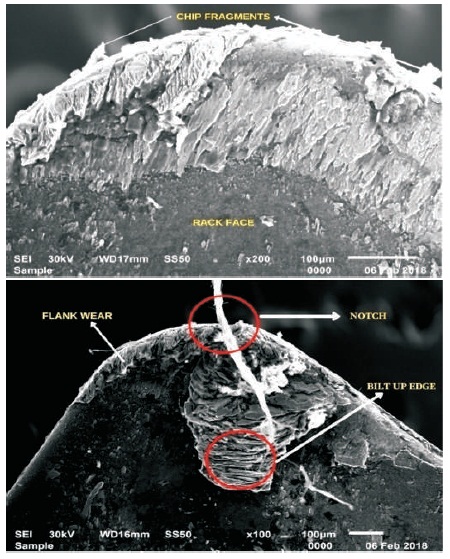
Figure 7. Tool Wear in Dry Machining
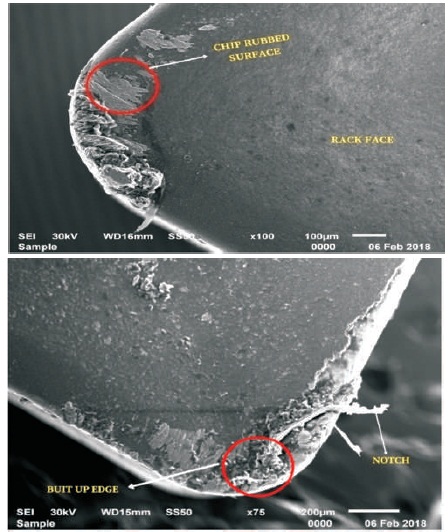
Figure 8. Tool Wear in MQL Machining
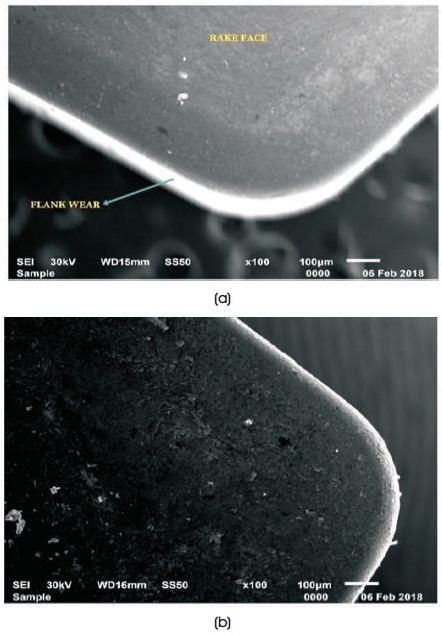
Figure 9. Tool Wear in NFMQCFT Machining
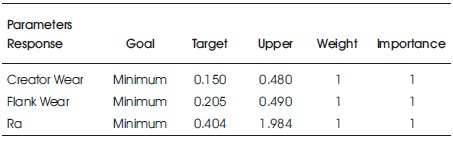
Table 11. Response Optimization: Creator Wear, Flank Wear, Ra
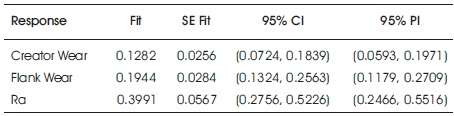
Table 12. Multiple Response Prediction

Table 13. Optimum Results
Creator wear = 0.569 - 0.00198 speed - 0.18 feed + 0.912 depth of cut - 0.1317 cooling condition + 0.000005 speed * speed + 0.08 feed*feed - 1.167 depth of cut * depth of cut - 0.00854 cooling condition * cooling condition + 0.00050 speed * feed + 0.00025 speed * depth of cut - 0.000025 speed * cooling condition - 0.25 feed * depth of cut + 0.150 feed * cooling condition + 0.1125 depth of cut * cooling condition.
Machining of titanium alloys with (NFMQCFT) nanofluid with minimum quantity cutting fluid technique is proven to be the best cooling technique to machine titanium alloys compared to other cooling techniques like a flood. MQL techniques with the combination of nanoparticles and minimum quantity cutting fluid technique utilization was better to other cooling techniques from its results. But the disadvantages of NFMQCFT is costly process compared to other cooling techniques, so it is used for some specific operations like turning only. Results showing the optimum value, in present experimental work results are optimized using three different optimization techniques RSM, GRA, and PCA and all three techniques proposed NFMQCFT is the suitable cooling method.