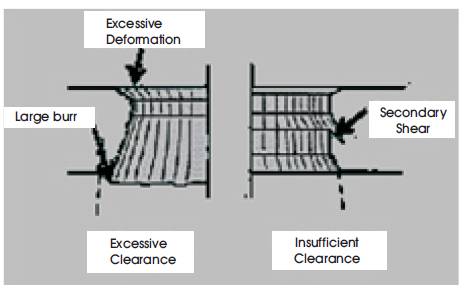
Figure 1. Effect of Clearance on Output Product
In the blanking operation, the quality of the product and the tool life mainly depends upon the punch and die clearance. The main objective of the study is to improve the quality of the product and also the tool life by optimizing the punch and die clearance and sheet thickness. The quality of the product and tool life mainly depends upon the punch and dies clearance. If the punch and die clearance is too large, it leads to large burrs and poor quality, otherwise if the clearance is too small, it results in part with poor edge quality, reducing the tool life and leading to more frequent tool component replacement. By using optimal amount of die clearance, the shear cracks join; this balances the punching force and optimizes part quality and tool life. By getting the optimal amount, the optimization is used; in that genetic algorithm is a simple but powerful tool to get the optimal clearance value. This experimentation is carried out with the help of regression equation and genetic algorithm to optimize the punch and die clearance.
Blanking is a process in which, the punch removes a portion of material from the larger piece or a strip of sheet metal. The small removed piece is the useful part and the rest is scrap, and this operation is called blanking. Blanking is a common sheet metal manufacturing process used in the production from the range of small components to high strength materials. The sheet range from the 0.2-20 mm thickness can be used for the applications.
In blanking, punch and die clearance is the important factor to give the better quality of the product [6, 8, 10, 13] and improve the tool life. Figure 1 shows the effect of excessive and insufficient clearance that affects the quality of the product. If the punch and die clearance is too large, it leads to large burrs and poor quality, otherwise when the clearance is too small, it results in part with poor edge quality, reduces the tool life and leads to more frequent tool component replacement.
Figure 1. Effect of Clearance on Output Product
The literature review indicates that many studies have been conducted to understand the effect of punch and die clearance on tool life and the quality of the part.
Emad-Al-Momani and Ibrahim Rawabdch investigated the effect of potential parameters for two identical products manufactured from two different materials (ST 12 and stainless steel) blanked with a reasonable quality on the same mold. They use Design of Experiments (DOE) technique by selecting the experimental levels for each selected factor, i.e. the clearance to be in five levels (5, 10, 15, 20, 25) % of the sheet metal thickness, blank holder force to be in two levels (0,3000)N and sheet metal thickness to be in four levels (0.5, 0.6, 0.7, 0.8) mm. Perform a factorial experimental design in order to take high-level interactions. As a result, in order to minimize the burrs height, the clearance should be set at about 2% with almost no blank force.
Pankaj G. Dhoble et al. [2], determines the optimal parameters such as, sheet thickness, clearance and wear radius in blanking to find out the variations in three performance characteristics such as, burr height, accuracy and circularity value of the medium carbon steel. For that, they conduct the experiment using the Taguchi's Grey Relational Analysis. With the help of L-9 half factorial method, the burr height is determined using the parameters like thickness, clearance and wear radius. As a result, the wear of punch and the dies should be reduced for increasing the life of punching dies.
R. Hambli [12], studied the effects of interaction between the clearance, wear state of the tool and the sheet thickness on the evolution of blanking force and the geometry of the sheared profile using the Design of Experiment. An experiment was carried out using the tools with four different wear states (wear radius 0.01, 0.06, 0.012, 0.2 mm) and four different clearances (5%, 10%, 15%, 20%). As a result, in order to minimize the blanking force, the clearance should be set at 10%; however, to minimize the fracture angle and the fracture depth, it is preferable to set the clearance at 5%. When the clearance is set at 10%, the process is slightly more robust to tool wear, as far as the blanking force response is concerned.
T.Z. Quazi et al. [3], determines the influence of tool clearance, sheet thickness, and sheet material thus optimizing the clearance which affects other process parameters. The experimental investigation was carried out by the three different clearances (5%, 10%, and 15%) with three different thicknesses (0.8 mm, 1.2 mm, 2 mm) and with two different materials (Aluminum, Brass). The tool used for determining the blanking process optimization was Design of Experiments (DOE) approach by Taguchi method. The authors have considered the experimental data of nine values to determine the optimum results. As a result of this experimental investigation, in order to minimize the burr height, the clearance should be set above 5% with almost no blank holder force.
Soumya Subramonian et al. [4], studied the influence of punch-die-clearance on the non-symmetric shapes. Due to the non-symmetric shapes, the variable punch-dieclearance is to be used. Experiments were conducted using the plastic at a thickness of 0.25 mm and 0.8 mm. The material of the punch is AISI D2, corner radius is 0.0127mm, and the clearance is varied from the 5% to 20%, because they use variable punch-die-clearance. The main aim is to improve the tool life by minimizing the tool wear. The tool wear is monitored by the Finite Element Method. And also they compare effects of the uniform clearance and the variable clearance. As a result, punchdie- clearance variables at the contour of a part gives a more uniform punch stress and hence the punch wear, thereby improving the punch life considerably.
The main objectives of the study is to illustrate how to
(a) Improve the tool life,
(b) Improve the quality of the product, and
(c) Reduce the burr height.
The objectives can be achieved by setting the punch and die clearance and sheet thickness as an optimal value. The optimal values can be achieved by using the genetic algorithm.
The study procedure contains seven steps. These steps are carried out in this study:
Step 1: Identify the Die Design Parameters.
Step 2: Selection of Material, Software, Tools.
Step 3: Conduct the Experiment.
Step 4: Convert the Experimental Data into Multiple regression equation.
Step 5: Conduct the Genetic Algorithm by using Multiple Regression equation.
Step 6: Get the Optimal Value.
Step 7: Test the values and find the Improvements.
There are two types of materials used for this study. They are,
a) AISI 1020 (Low Carbon Steel-cold rolled)
b) AISI 304 (Stainless Steel)
These materials are used as the work piece. The chemical compositions of the AISI 1020 and AISI 304 materials are listed in Table 1.
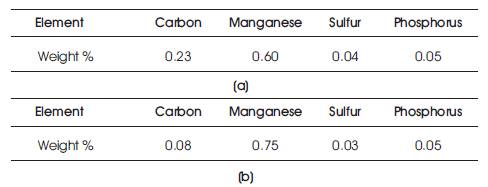
Table 1. Chemical Composition of (a) AISI 1020, and (b) AISI 304
The two parameters used to achieve the objective are,
a) Tool life, and
b) Burr Height.
The details of the selected parameters used in this study are shown in Table 2.
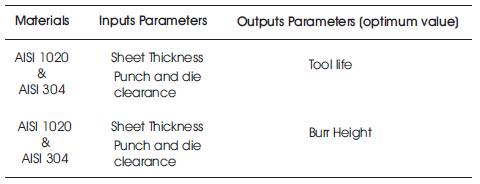
Table 2. Details of Selection of Parameters
There are two tools used in this study. They are,
1. Multiple Regression Analysis, and
2. Genetic Algorithm.
It is used for the purpose of framing the multiple regression equation and analyzing it. It is used in the mathematical modeling and in Microsoft Excel 2010. It is a powerful technique used for predicting the unknown value of a variable from the known value of two or more variables.
In general, the multiple regression equation (1) of Y on X1 , X2 … Xk is in the form of:

Multiple regression analysis is used when one is interested in predicting a continuous dependent variable from a number of independent variables. If dependent variable is dichotomous, then logistic regression should be used.
It is used for the purpose of getting the optimal value. A Genetic Algorithm (GA) is a method for solving both constrained and unconstrained optimization problems based on a natural selection process that mimics the biological evolution.
The algorithm repeatedly modifies a population of individual solutions. At each step, the genetic algorithm randomly selects the individuals from the current population and uses them as parents to produce the children for next generation. Over successive generations, the population "evolves" toward an optimal solution.
a) Microsoft Excel 2010 (Add - in: Data Analysis Tool Pak)
This software is used to perform the Multiple Regression Analysis to get the multiple regression equation.
b) Microsoft Excel 2010 (Add - in: Solve XL)
This software is used to perform the Genetic Algorithm to get the optimal value.
The experiment is carried out on the live example in Shri Baalaji Metal Screens. The experimental values are taken from the hydraulic press. The specifications of Hydraulic Press are as follows.
1. Model Name: C – type Power Press.
2. Capacity in tons: 10.
3. Crank shaft Diameter:88 mm
4. Adj. Stroke Length: 50 mm
5. Adjustment of Ram: 25 mm
6. Punch Hole in Ram: 25 mm
7. Hole in Bed: 76 mm
8. Bed Size: (Length x Width): 432 X 228 mm
9. Bed Thickness: 58 mm
10. Distance between bed to Ram: 204 mm
11. Flywheel Diameter: 458 mm
12. Max. Strokes per minute: 70
The results of each parameters are listed in Table 3.
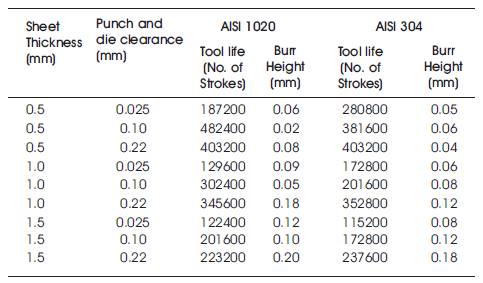
Table 3. Experimental Results
In multiple regression analysis, framing the multiple regression equations in the form as shown in the equation (1), and it is used in the genetic algorithm to find out the optimal value. The multiple regression equation is derived from the software called Microsoft Excel 2010 (Add-in: Data Analysis Tool Pak). Most of the researchers used the Mini tab to frame the equation [12, 15] .
The multiple regression equations are formed with the help of the experimental values (Table 3). The procedure for deriving the multiple regression equation is given below:
Step 1: Upload the Experimental Result table (Table 3) in the Microsoft Excel 2010.
Step 2: Open the Add-in (Data Analysis Tool Pak) and give the inputs and the outputs. (For AISI 1020; Parameter is Tool Life; Inputs: Sheet thickness and Punch and die Clearance; Output: Tool Life)
Step 3: Click “OK” to get the result.
By following the above procedure, The authors get the result in the form of tabulation as shown in Table 4. In Table 4, the co-efficient value is used for framing the multiple regression equation.
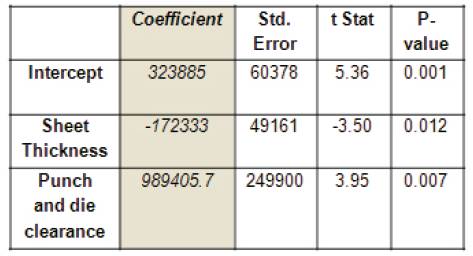
Table 4. Regression Output for the Parameter Tool Life
The equation should be framed for both the materials with each of the parameter. The framed equation is shown in Table 5. The model for framing the equation is shown below:
For Material: AISI 1020 and the Parameter: Tool Life
The Multiple Regression equation for the material AISI 1020 and for the parameter tool life is,
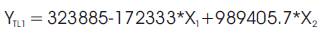
where,
X1 = Sheet thickness; X2 = Punch & die clearance.
The regression equations for the both materials with each parameter are shown in Table 5.
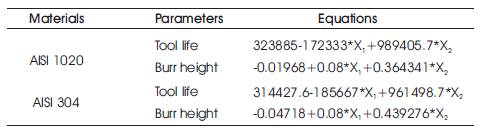
Table 5. Regression Equation for each Material and Parameters
The main purpose of genetic algorithm in this study is used to optimize the values. Mostly the researchers select the software as MATLAB or GA related softwares to find out the optimal value [5, 7, 9,/a>, 11, 14, 15], but in this study, the software used is Microsoft Excel 2010 with the add-on called Solve XL is used to find the optimal value. The software is user friendly for the Genetic Algorithm with less cost compared to other Genetic Algorithm softwares.
The procedure for finding the optimal value by means of Solve XL is given below:
Step 1: Select the number of Objectives, (Multi-objective).
Step 2: Select the population size, (N=100).
Step 3: Set the Cross over Rate (Figure 5) (CR=0.95).
Step 4: Set the Mutation Rate, (MR= 0.05).
Step 5: Set the Upper bound (Figure 4) (X1 =1.50, X2 = 0.22).
Step 6: Set the Lower bound (X1 =0.50, X2 =0.03).
Step 7: Set the Objective Type (Figure 3) (Max or Min).
Step 8: Click “OK” and get the optimal value.
The configuration wizard for the Solve XL is shown in Figure 2.
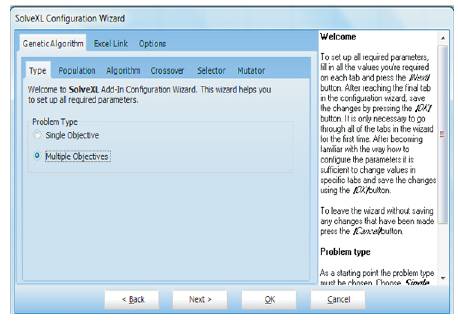
Figure 2. Configuration Wizard for Solve XL
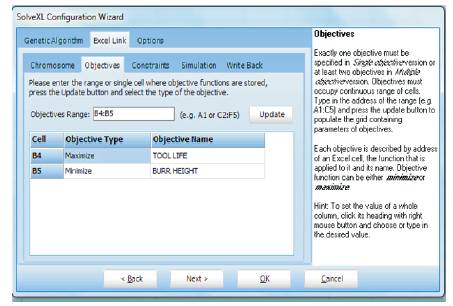
Figure 3. Set the Objective Type
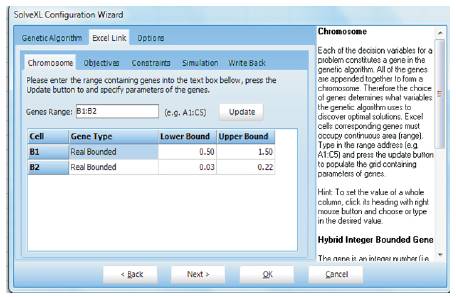
Figure 4. Set the Lower and Upper Bounds
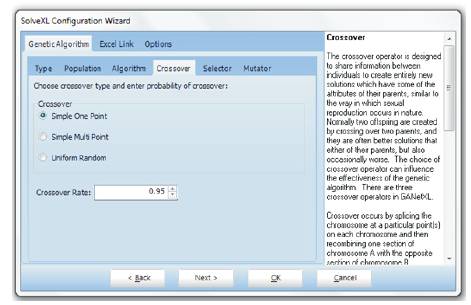
Figure 5. Crossover Rate Selection
The experimental results show that the material AISI 1020 have 0.5 mm thickness with the 0.10 punch and die clearance gives the improvement in tool life as 482400 strokes and reduces the burr height as 0.02 mm from the experimental study. The material AISI 304 has 0.5 mm thickness with the 0.22 punch and die clearance that gives the improvement in tool life as 403200 strokes and reduces the burr height as 0.04 mm. Thus the AISI 1020 have better Tool life and less Burr height compared to AISI 304.
The parameters in the AISI 304 material is to be selected as an optimal value. Table 7 shows the optimal values for both the materials taken for the study. Table 6 shows the optimal value for both the materials.
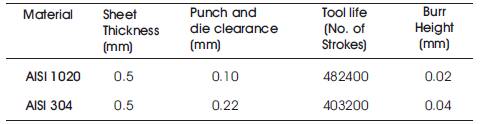
Table 6. Optimal Value for Both the Materials
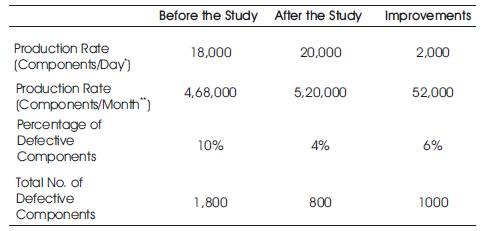
Table 7. Details of Improvements in Production
The production improvements are calculated by adopting the optimum value (Table 6) in the industry Shri Baalaji Metal Screens.
The production rate is improved by means of optimum value selected by means of the genetic algorithm. The detailed production improvements are shown in Table 7.
In blanking, the tool life is an important factor for improving the productivity and also in the improvement of quality. The burr height is set to an optimal value to improve the quality of the product. Thus these two parameters are taken for the study and kept as the objective for Maximization of Tool life and Minization of Burr height.
The output from the production, where the production rate is increased by means of maximizing the tool life and the percentage of defective components are reduced by means of minimizing the burr height.
From this, the authors justify that, the production and the quality is improved by means of an optimal value. Thus the objective of the study is proved.