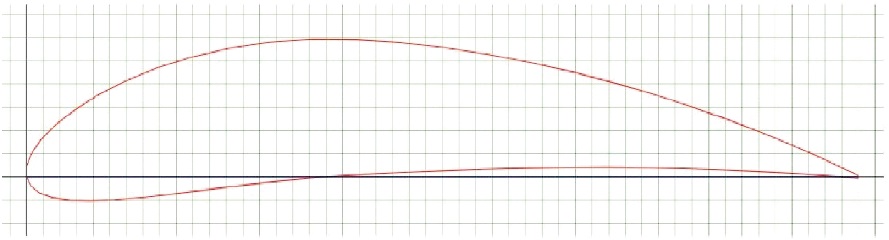
Figure 1. NACA 6412
An aerofoil is a structure used in fluid flow conditions. The structure offers the variation in velocity and pressure of flowing fluid when passed on it. The lift and drag forces are depending on the pressure created and variation in velocity. The present paper is carried out to study the pressure and velocity contours of fluid flow. The different conjugations considered are circular dimples on the surface of the aerofoil, circular dimples above and below the surface of the aerofoil, triangular dimples on the surface of the aerofoil and triangular dimples above and below the surface of the aerofoil. The flow analysis of NACA 6412 at an angle of attack of 4 degrees is carried out in SIMULIAXFlow.
An airfoil or aerofoil is the cross-sectional shape of the wing, blade, or sail. The force that offers on the uppers surface that causes the rise of the aerofoil is called lift. The negative force that reduces the forward motion of the aerofoil is called drag. An aerofoil is a structure with curved surfaces designed to offer the foremost favorable ratio of lift to drag in flight. It is invented by Sir George Cayley, to identify the four-vector forces that influence an aircraft: thrust, lift, drag and gravity. No single airfoil works well in different conditions.
Engineers at NACA (National Advisory Committee for Aeronautics) devised a four-digit scheme to classify different aerofoil shapes and dimensions. The scheme used in this study is NACA 6412 and the details are given below:
Chord length = 500mm
Max thickness = 12% at 30.1% chord
Max Chamber = 6% at 39.6% chord
Max Chamber position = 40%
New et al. (2014) have studied the effect of conjugations on aerofoil and concluded that the conjugations on aerofoil cause flow separation in a good manner when compared to the plain surface. Loya et al. (2016), have analyzed the aerofoil with increment of chamber in vertical axis and the chamber increment of 3% causes an increase in the performance of aerofoil. Zaheer et al. (2019) have studied the performance of NACA 6412, NACA 4412 and NACA 0012. The aerofoil NACA 6412 is selected because of higher aerodynamic efficiency at the angle of attack of 4 degrees. Tulus et al. (2019), have analyzed the flow on NACA 6412, NACA 4412 and NACA 2412 by varying the angle of attack and stated that NACA 6412 has shown a stable speed distribution.
Scupi and Dinu (2011) stated that CFD is a good method in checking the numerical and experimental values. Aung et al. (2016) have studied the effect of angle of attack on performance of aerofoil. From the numerical analysis, the lift to drag ratio increases up to a certain angle and then reduces. Patel et al. (2015) analysed the lift and drag on a aerofoil. The lift and drag forces are increasing up to an angle of attack of 10 degrees, but it is observed that after 4 degrees the variation in drag forces is higher. Kandwal and Singh (2012) studied the flow on NACA 4412 and observed that the pressure should be low and velocity should be high on the upper surface of aerofoil. Kirubakar et al. (2019) have analyzed the corrugated wing and observed that the lift to drag ratio of a corrugated wing is high when compared to a smooth surface. Rasal and Katwate (2017) analyzed the effect of the surface modification of aerofoil and the dimples on the surface cause a more low-pressure region that results in a high lift force. Kevadiya and Vaidya (2013) studied the flow on aerofoil and observed that the lift/drag ratio increases up to certain angle of attack and then decreases. Zhu (2019) on analyzed the flow and performance and also the effects of the parameters like temperature, pressure, and velocity and compared the results from CFD and 2D experimental values which are almost equal. Prasath and Irish Angelin (2017) have studied the effect of dimples on aerofoil and stated that the dimples on aerofoil convert the flow from laminar to turbulent. The dimples delays the flow and reduces the drag.
The aerofoil geometry of 4 digit series depending upon the height of the upper chamber and lower chamber NACA 6412 with a total number of 81 plot points is considered. It is shown in Figure 1. The aerofoil has been a reliable source for an airstream inside the geometry so as to develop the aerodynamic force. The change in the angle of attack or the angle of inclination is to increase the lift to drag ratio, which ultimately affects the efficiency of the aerofoil attached. On comparing the three aerofoil series in terms of the chord length, the curvature of the aerofoil, thickness in terms of the upper chamber and lower chamber, the aerofoil geometry with 6412 series was considered and processed with further conceptions and examinations.
Figure 1. NACA 6412
The primary design is carried out in CATIA V5. The conjugations are made up of 30% of the length of the aerofoil and to a thickness of 1%.
The plot points are imported to CATIA v5 and the points are joined using a spline. The joined spline is formed as a closed body. The closed body is converted to a 3D object and imported to XFlow with .IGES format. The imported body is pitched with an angle of 4 degrees. The models considered are in Table 1. The CAD model of the models M1, M2, M3, M4, M5 are given in Figure 2, 3, 4, 5, and 6 respectively.
Table 1. Models Details
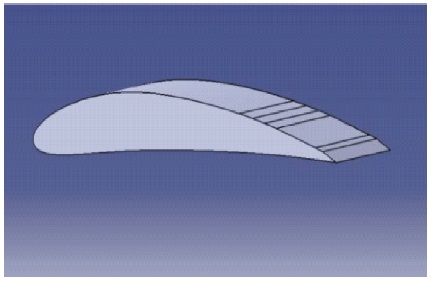
Figure 2. CAD Model of M1
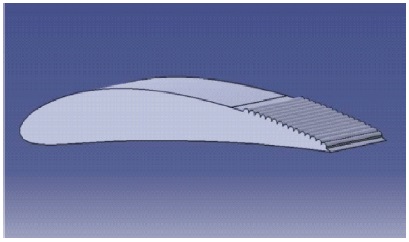
Figure 3. CAD Model of M2
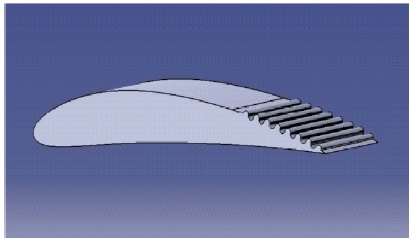
Figure 4. CAD Model of M3
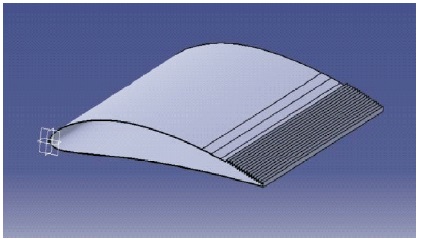
Figure 5. CAD Model of M3
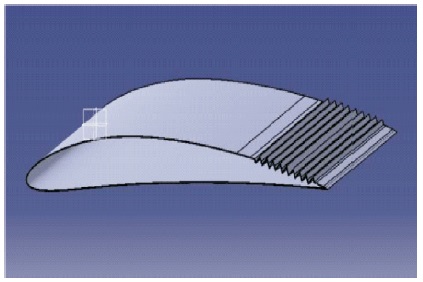
Figure 6. CAD Model of M5
The models are tested in XFlow. The basis of the XFlow code is the particle-based Lattice Boltzmann Method (LBM). The LBM has now reached a high level of development, and its capabilities are comparable or exceed the capabilities of traditional mesh methods for solving the Navier-Stokes equations. The LBM is a time-dependent, time-explicit meshless method, and it is naturally parallelized by a large number of cores and allows using graphics processors. Efficiency and acceleration of computation can reach hundreds of times over the algorithms based on the solution of the Navier-Stokes equations by finite volume methods.
The LBM describes well the dynamics of liquids and gases for a wide class of problems and it is consistent with the Navier-Stokes equations, the behavior of a medium described by the Boltzmann equation with a certain collision operator conforms to the Navier-Stokes equations.
The prepared models are imported to Xflow and they are analyzed within the flow medium. The boundary conditions are as given in Table 2. Figures 7, 9, 11, 13, 15 display the velocity lineation for each model considered respectively. Figures 8, 10, 12, 14, 16 display the pressure lineation for each model considered respectively. From the figures concerning the velocity lineation, we can observe that the velocity has been increasing as the angle of the inclination increases, whereas from the figures concerning the pressure lineation, we can observe the pressure has been decreasing as the angle of inclination has been increasing. And also, the velocity and pressure are inversely proportional to each other relatively. The variations in terms of the velocity lineation and the pressure lineation depend upon the angle of attack/inclination at the inlet of the geometry, leading edge of the aerofoil for the smoothness of the flow along the surface of the geometry.
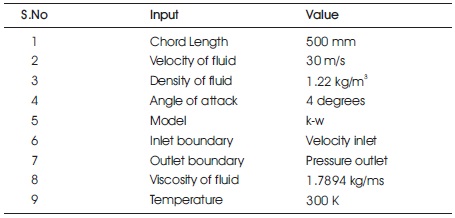
Table 2. Models Details
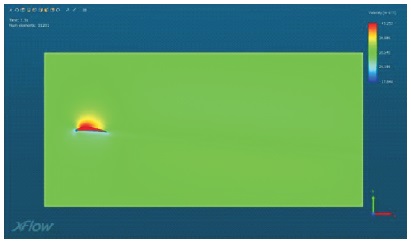
Figure 7. Velocity Lineation for Model M1
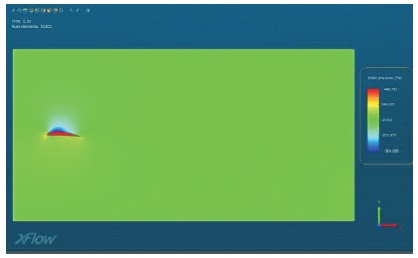
Figure 8. Pressure Lineation for Model M1
Figure 9. Velocity Lineation for Model M2
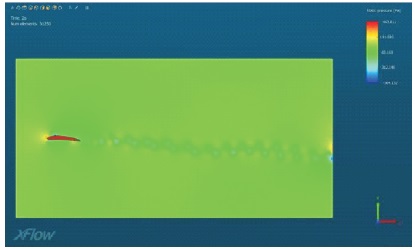
Figure 10. Pressure Lineation for Model M2
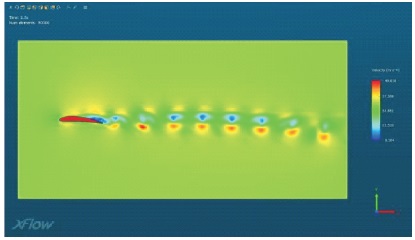
Figure 11. Velocity Lineation for Model M3
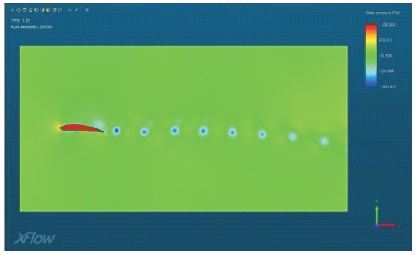
Figure 12. Pressure Lineation for Model M3
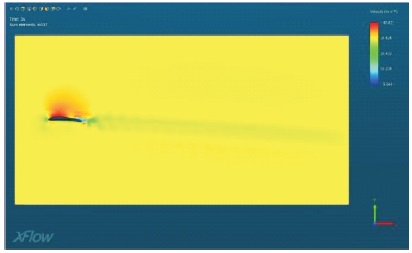
Figure 13. Velocity Lineation for Model M4
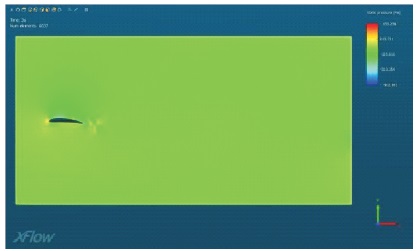
Figure 14. Pressure Lineation for Model M4
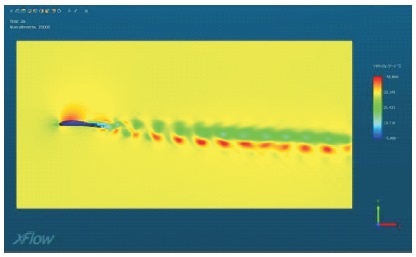
Figure 15. Velocity Lineation for Model M5
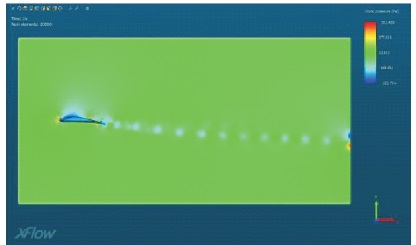
Figure 16. Pressure Lineation for Model M5
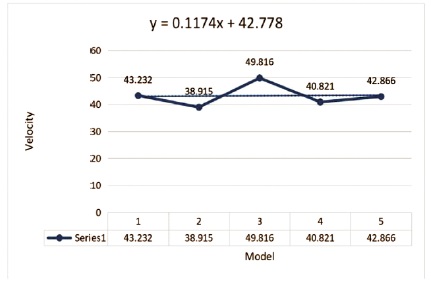
Figure 17. Graphical Plot of Velocities and Models
The Table 3 describes the values of velocity lineation and pressure lineation of all the models.
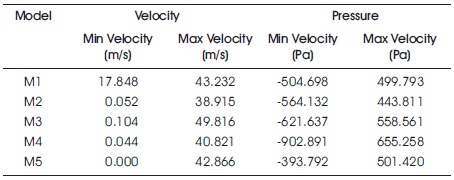
Table 3. Contour Values of Static Pressure and Velocity Magnitude for the Different Models Considered
The maximum velocity on plain aerofoil is 43.232 m/s which is higher than the aerofoil provided with circular dimples above the surface with maximum velocity of 38.915 m/s.
The aerofoil with circular dimples above and below the surface has given maximum velocity as 49.816 m/s which is higher than the aerofoil with triangular dimples above the surface with a velocity of 40.821 m/s. The triangular dimples above and below the surface gave higher velocity distribution with 42.866 m/s.
The work aimed to analyze the flow behavior along the surface of the aerofoil in terms of velocity and pressure lineation and to find the optimum conjugation of an aerofoil. The study have shown that the aerofoil with dimples above and below the surface has shown the better pressure and velocity distribution compared to plane with dimples above the surface. Among the studied models, circular dimples gave higher velocity which creates higher pressure difference there by increasing the lift force on aerofoil.