(1)
Short Glass Fibers (SGF) reinforced thermoplastic are increasingly replacing metals and its alloys with the advent of new polymer alloys and blends. Concurrently the product designs are also becoming more complex, increasing the dependence on simulation software. In order to obtain accurate mathematical and simulation results, experimental data have to be carefully integrated into mathematical models used in these software.The effect of varying weight percentage of SGF from 0 to 15% on tensile properties of the Acrylonitrile Butadiene Styrene (ABS) thermoplastic materials was evaluated using Moldflow simulation software and the results were compared with experimental and Finite Element Modelling Data. The Moldflow simulation software showed a drop in injection pressure above 10 wt.% SGF in ABS matrix. Experimental data also showed a drop in young's modulus above 10 wt.%.The Halpin-Tsai model for randomly oriented fibers showed an increase in young's modulus.Using the FEM approach, the reason for drop in injection pressure and young's modulus after 10 wt.% was analysed. It was observed that there is a critical inter-fibergap, below which the stress interaction effects begin to dominate and the stress between the fibers reaches the shear yield strength resulting in a drop in injection pressure and young's modulus. Critical inter-fiber gap for SGF-ABS composite is 60 micron.
Injection molding technology is one of the most economical and efficient ways to manufacture plastic parts with desired properties and shape. Even among the various plastic materials, thermoplastics and its composites occupy an important place among the injection molded parts for various consumer goods, mainly for the ease with which they can be melted and molded and even recycled (Piotter, Mueller, Plewa, Ruprecht, & Hausset, 2002). The properties of base thermoplastic resins are modified by adding fillers and short fibers to achieve the required properties (Islam et al., 2011; Saheb et al., 1999). Short Fiber Reinforced Plastics (SFRP) are being used widely as they provide superior mechanical properties(Fu, & Lauke. 1996). Among the various short fibers, short glass fibers are known to improve structural properties like strength, stiffness and reduce shrinkage of the part and hence widely used as reinforcements (Islam et al., 2011; Typical length of short fibers used is 200μm - 500μm (Islam et al., 2011; Polyamide, Polypropylene, Polystyrene, ABS and SAN are commonly used polymer matrices for these composites.
The effect of fiber length and fiber orientation on the tensile strength of SFRP composites was studied and reported(Fu, et al., 1996). During injection molding, intense shear stresses acting on the fibers can break the fibers, which reduce the mean fiber length. This affects the mechanical properties of the composites. Thus, the processing conditions have to be taken into account while understanding the behaviour of the composite. The use of shallower gate, higher mold temperature and lower injection velocity would result in an increase in the mechanical properties(BociagaElzbieta, 2001). The orientation of fibers was controlled by applying shear stress during solidification and it was found that such a product had a higher impact strength and modulus(Kalay, &Bevis, 1997).
Since processing conditions have a strong influence on the mechanical properties of thermoplastic composites, modelling and simulation would considerably reduce the number of experimental iteration to arrive at the optimal processing conditions. In addition, FEA software could be used to simulate tensile testing and it can be used to compare the stress strain behaviour of the material with the experimental results. The most critical challenge in the current simulation methodologies is to accurately define the material model. ANSYS interface with Moldflow can be used to some extent to extract fiber orientation result into FEM software to define the material model which gives better stress analysis (Sethuraman, &Palanisam, 2013). Comparison of SIMPOL and Autodesk Moldflow Plastics Insight(MPI) with an experimental model has been carried out and it has been reported that MPI gives a better fill analysis result and more information about injection molding process than SIMPOL (Sahputra,2007). Further, Moldflow software has also been used to determine the optimum gate location for plastic injection molding process for a head lamp (Babu, &Vardhan, 2013) and for an air conditioning vent(Saman, Abdullah, & Nor, 2009). Simulation optimization for injection molding process by the use of DoE and adaptive metamodeling techniques has also been reported(María et al., 2008).
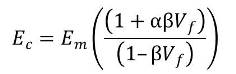
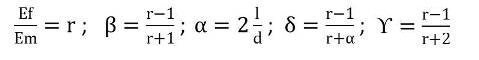
Further, enhancing the capabilities of computer simulation, the Mold flow simulation has been combined with an efficient algorithm for predicting the fiber orientation in thin composite parts and in turn the anisotropic Young's Modulus(Gupta, & Wang, 1993). The simulation results were found to agree reasonably well with the experimental values. Thus, the points considered above, converges to the importance of developing simulation model which takes into the consideration of material composition, processing parameters to understand the material behaviour, combining this with FEA analysis could provide fairly accurate tensile properties of the thermoplastic materials and its composites. Iso-strain and Iso-stress models were the first to be developed to predict the Young's Modulus of the composites. Halpin-Tsai further refined these models to determine the Young's Modulus of Short Fiber Reinforced Composites. For aligned fibers the equation is given by equation (1). For randomly oriented fibers the equation is given by equation (2). For the purpose of this study, equation (2) is considered.
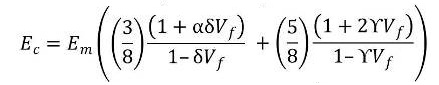
Where, Em , Ef and Ec are Young's Modulus of matrix, fiber and composite respectively. Vf is the volume percentage of fiber of length l and diameter d in the composite.
Short Glass Fibers (SGF) were procured from M/s Saint Gobain, Bangalore and had a diameter of 25μm and length of ~500μm. These SGF were chosen because they are widely used in the industry for compounding of Thermoplastics. Figure 1 (a) and (b) shows the FESEM images of SGF. The Thermoplastic Matrix material chosen for the present study is Acrylonitrile Butadiene Styrene (ABS). It is one of the most widely used thermoplastics because of its unique set of thermal and mechanical properties. ABS was procured from M/s Samsung Chemicals, Mumbai. Figure 2 (a) and (b) shows the chemical structure of Acrylonitrile Butadiene Styrene and the FTIR spectra. The dominant peaks are 700, 1160, 1450 and 2920 cm-1 which corresponds to C-H bond, while 1020cm-1 is C-N stretching peak are characteristic peaks of acrylonitrile, butadiene and styrene. Melt blending method was used to disperse SGF into ABS matrix. The twin screw extruder had an L/D ratio of 40 with 8 zones. The temperature of the barrel was maintained between 200 ~ 260o C from zone 1 to 8. The screw speed was set to 200 rpm. Thermo gravimetric analysis (TGA) was carried out to ensure that the weight percentage of reinforcement was 7.5, 10 and 15 of SGF in ABS matrix. Beyond 15 wr% the thermoplastic composite becomes very brittle and it is very difficult to process using injection molding.
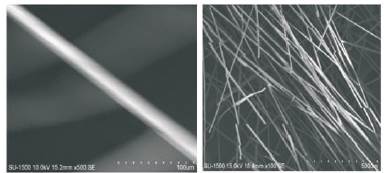
Figure 1. (a) FESEM image of SGF of diameter 25μm (b) FESEM image of SGF of length 500μm
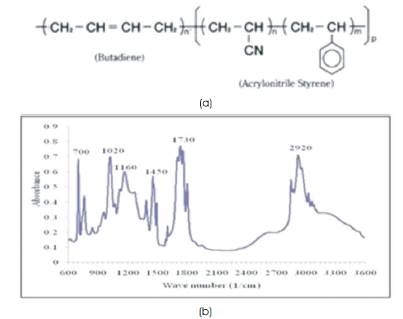
Figure 2. (a) Chemical structure of ABS (b) FTIR spectra of ABS
For the purpose of the present study, ASTM D638-10 standard test specimens for tensile tests have been considered. The dimensional CAD drawing is given in Figure 3. Autodesk Simulation Moldflow Adviser © software was used to do the fill analysis to simulate the injection molding process. The simulation conditions are listed in Table 1. The mold parameters and the mold temperature were kept constant, while the melt temperature and percentage of SGF in ABS matrix was varied from 7.5 to 15 wt. %. The injection pressure required to obtain 100% mold fill was recorded for different melt temperatures and percentage reinforcement of SGF. Figure 4 shows the fill analysis using Moldflow software. The injection pressure and melt temperature determined by the simulation was used in the actual injection molding process. The quality predictor predicted the desired conditions to be used to obtain best surface quality. The extruded granules were injection molded using Electronica Make Optima: 75-B type screw machine into standard tensile test specimen as per the dimensions given in ASTM D638-10. The test specimens were tested using a computer controlled servo-hydraulic 10 Ton universal testing machine.
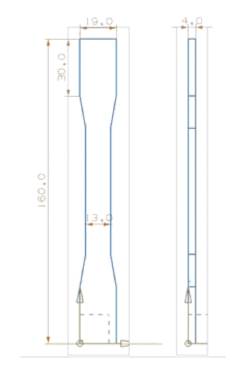
Figure 3. CAD drawings of Tensile specimen
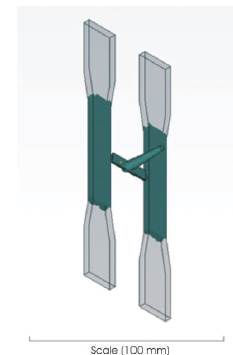
Figure 4. Moldflow fill analysis
The FEM analysis of the process was done through Autodesk Simulation Mechanical © software. The CAD model was prepared using UG NX6.0 using the same dimensions as the mold and exported to the FEM software. The element definition was set to Moldflow. Static stress for linear material model was selected. Loads were varied from 500N to 2000N. By varying the loads and noting the resulting von mises strain, the stress strain curve was obtained.
Figure 5 shows the quality predictor result using Moldflow for ABS+7.5% SGF at different melt temperatures. At lower melt temperature, high pressure is required and this results in high strain rate. This causes large amount of shear stresses in the melt, and the surface quality of the part decreases. At high temperature, though required pressure is less, polymer degradation takes place and results in very poor surface finish. Thus an optimum temperature range was found for which the quality of the specimen is highest as shown in Figure 5 (b). Figure 6 shows the variation of injection pressure for different weight percentages of reinforcements as a function of melt temperatures. Up to 10 wt. % of SGF in ABS, the injection pressure increases, and beyond this point of reinforcement, the injection pressure drops substantially for all the melt temperatures.
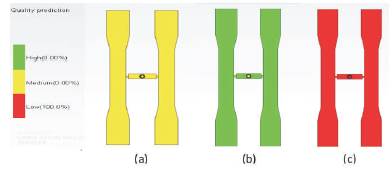
Figure 5. Moldflow Simulation Results for ABS + 7.5% SGF at (a) 210oC (b) 250oC (c) 280oC

Figure 6. Effect of Reinforcement on Injection Pressure for SGF-ABS Composites
For a melt temperature of 250oC, the injection pressure required increases from 18 MPa for pure ABS to around 30MPa for 10 wt. % of SGF reinforcement. At 15 wt. % of reinforcement, the required injection pressure dropped by 33% to around 20 MPa. The reason for the drop in injection pressure with increase in weight percentage of Short Glass Fibers could be attributed to increase in shear stress in the matrix material between the fibers. This leads to a larger deformation of the matrix material for an incremental increase in pressure, leading to drop in injection pressure beyond 10 wt. % of SGF in ABS matrix. .
Figure 7 shows the tensile strength vs. strain graph for pure ABS and ABS-SGF composites. The ultimate tensile strength of ABS-SGF composite is listed in Table 2 and the plot of Young's Modulus as a function of wt. % of reinforcements is shown in Figure 8.
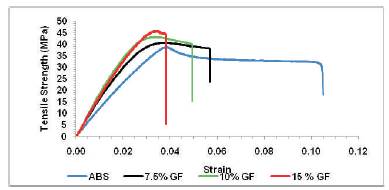
Figure 7. Tensile strength vs. strain graph for pure ABS and ABS-SGF composites
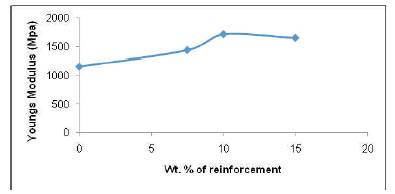
Figure 8. Plot of Young's Modulus as a function of wt. % of reinforcement
The Ultimate Tensile Strength of the composite increased by 15% with addition of 15 wt. % of SGF. Tensile strength is a function of reinforcement. These reinforcements act as barriers to the propagation of crack and hence requires higher load for failure. Thus, the value of ultimate tensile strength increases with increase in SGF reinforcements. However, the Young's Modulus value increases with wt.% of reinforcement up to10 wt. % reinforcement and beyond this, it begins to drop. The young's modulus increases by 41% for 10 wt. % of reinforcement in comparison to pure ABS and at 15 wt. %, the young's modulus drops to 1650 Mpa. ABS-MWCNT composite specimens were prepared using twin screw extrusion process and injection molding process having weight percentages similar to that of SGFABS composites. The result is shown in Table 3. It is observed that the young's modulus for MWCNT-ABS composite was the highest for 10 wt. % of MWCNT composites and dropped at 15 wt. %. Both the experiments yield similar results showing that the tensile properties of the composite depend upon the properties of matrix. A similarity between variation in injection pressure and young's modulus with weight percentage of reinforcement is observed, the former being a simulation result and the latter an experimental data. FEA technique was applied to understand the behaviour of these composites.
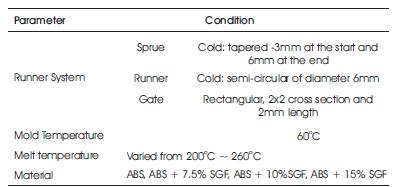
Table 1. Simulation Conditions for Injection Molding of ABS-SGF composite
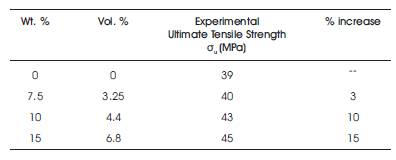
Table 2. Experimental values of Ultimate tensile strength
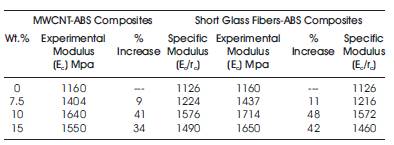
Table 3. Modulus properties of MWCNT-ABS and SGF-ABS Composites
Figure 9 shows the schematic of a section of ABS-SGF composite. The distance between the fibers is represented by the term d and Figure 10 shows the variation of d with wt. % of reinforcements. It can be observed that the distance between the fibers reduces by around 30% as the wt. % of reinforcement increases from 7.5 to 15.
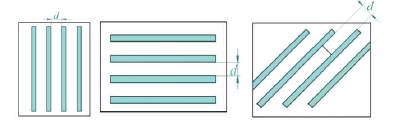
Figure 9. Schematic of a section of ABS-SGF thermoplastic composite in different configuration
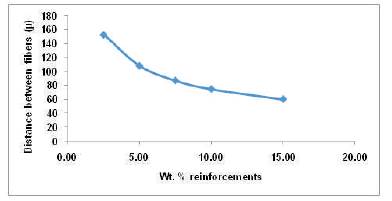
Figure 10. Variation of distance between fibers with Wt. % of reinforcements for an L/D ratio of 20
Glass fibers have a Young's Modulus of 80 GPa, while the ABS matrix has a modulus of 1.2 GPa. With the addition of glass fibers as reinforcements, the composite becomes stiff and the Young's modulus increases. This trend is seen up to 10 wt. % of SGF reinforcements. Further increase in reinforcements leads to stress field interaction between fibers which dominates when the fibers are very close to each other. The effects of stress field interaction between two adjacent fibers were evaluated using Finite Element Analysis. For the purposes of the present study, the boundary conditions that were applied are:
(a) the glass fibers are straight and along the axis of loading
(b) the glass fibers are staggered with a overlap of 50% between adjacent fibers
(c) the l/d ratio of the glass fibers were kept constant at 20.
The stress was increased gradually from 5 to 20 MPa, which is nearly 50% of the ultimate tensile strength as shown in Table 2. Figure 11 shows the effect of stress-field interaction between fibers. Figure 12 shows the variation in mean stress values as a function of distance between fibers. As the distance between the fibers reduce from 90 µm to 60µm, the value of mean stress remains almost constant. When the distance between the two fibers reduces below 60µm, the value of mean stress rises rapidly. The value of ultimate tensile strength for pure ABS was found experimentally to be 39 MPa. The corresponding shear strength would be 19 MPa. It is seen from Figure 11 that for an applied stress of 13 MPa, and when the inter-fiber distance is below 60µm the mean stress value between the fibers crosses 19MPa, thus leading to local shearing of ABS matrix phase between the two fibers.
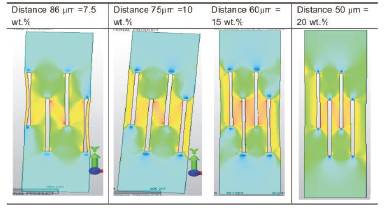
Figure 11. Results of FEM analysis of Composites with 7.5, 10, 15 and 20 wt. % of SGF in ABS matrix.
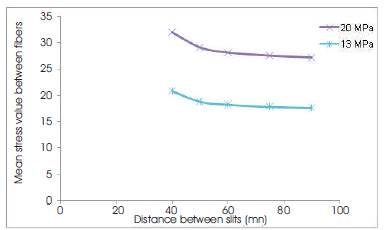
Figure 12. Variation of mean stress as a function of distance between fibers
This shear causes relative movement of one fiber with respect to another. When the applied stress is increased, it causes further movement of fibers relative to each other and softens the material. The effect of stress interaction begins to dominate when the distance between fibers reduces below 60µm, resulting in a drop in injection pressure and the Young's Modulus of the composite.
It must be noted that there is a difference between FEA results and simulation and experimental data. The simulation and experimental data showed a drop in Young's Modulus and injection pressure at 10 wt.%, while the FEA analysis shows increase in stress-interaction effects at 15 wt.% which corresponds to an inter-fiber gap of 60µm. The reason for this difference is that in the FEA model, the assumption is that the gap between fibers are constant at 60µm, however, when SGF is melt blended into ABS, it is difficult to obtain uniform dispersion of SGF in ABS matrix. This non-uniformity in dispersion of SGF in ABS matrix results in a drop in injection pressure and Young's Modulus at 10wt% of SGF reinforcement.
Table 4 compares the simulation, experimental and analytically calculated values of the Young's Modulus values for SGF-ABS composites. The values obtained using the simulation are lower than that of the experimental results, while the values obtained using Halpin-Tsai model are higher than the experimental results. The simulation results gave a more accurate value of Young's Modulus with a maximum error of 10%, while the Halpin-Tsai model had a maximum error of 28%. However, both these models fail to capture the drop in the value of Young's Modulus after 10 wt. %. This is primarily due to the fact that both these models do not consider stress interaction effects.
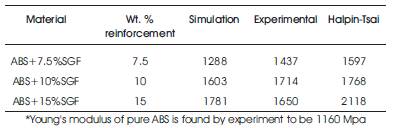
Table 4. Comparison of Young's Modulus
The authors would like to thank the Management of R. V. College of Engineering, M/s G.L.S.Polymers P.Ltd., M/s Bangalore Integrated Systems and Solutions for their support.