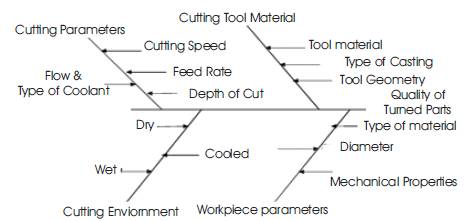
Figure 1. Ishikawa Cause-Effect Diagram for a Turning Process
This paper presents a determination of the effect of cutting parameters on Material Removal rate and Surface Roughness during turning of AISI H21 steel under dry machining condition using Response surface methodology (RSM). For this purpose, CNMG 120412 MP of Grade TT 8135 has been selected as cutting tool material. The different levels of all cutting parameters have been used and experiments are done on HMT CNC lathe machine STALLION-100 HS. To analyze the experimental observations, a statistical tool Design Expert Software of version 9.0.3.1 has been used to reduce the calculations and to arrive at exact improvement plan of the Manufacturing process & Techniques.The experimental results indicated that MRR increases with the increase in feed rate, spindle speed and depth of cut. It is also seen that the Ra decreases with increase in spindle speed but increases with increase in feed rate. The optimum values of Spindle Speed, Feed rate and Depth of cut to maximize the MRR (2766.81 mm3 /sec) are 1594.723 RPM, 0.35 mm/rev and 2 mm respectively. The optimum values of Spindle Speed, Feed rate and Depth of cut to minimize the Ra (2.291 μm) are 1599.997 RPM, 0.15 mm/rev and 1.797 mm respectively.
In a manufacturing industry, machining processes are employed to shape the material by removing unnecessary material. During the machining process of any material, quality specifications such as surface finish, accuracy, minimum production cost or machining time are considered. Apart from quality, there exists another criterion, called productivity which is directly related to the profit level and also goodwill of the organization.
For achieving a desired level of surface quality on turned parts, practical knowledge and skill to set up operation with the given specifications and conditions are required. The manufacturing engineers or machine setup technicians often utilize their own experience or published shop guidelines for determining the proper process variables to get a particular level of Ra and Material removal rate. But the range given in these sources are actually starting values and are not the optimal values.
In recent times, modern industries are working to achieve high quality products with less operator input and in a very short time. Focus has been made in the improvement of surface by increasing the alternative solutions by various researchers.
Ashvin J. Makadia and J.I. Nanavati (2013) used Design of experiments to study the effect of the main turning parameters such as feed rate, tool nose radius, cutting speed and depth of cut on the surface roughness of AISI 410 steel by using RSM. The surface roughness was found to increase with the increase in the feed and it decreased with increase in the tool nose radius [1].
Pankaj Sharma & Kamaljeet Bhambri (2013) investigated the optimization of Surface roughness & MRR by 3 machining parameters in turning of H13 in dry conditions. Taguchi's L18 OA and ANOVA were used for individual optimization. The simultaneous optimization was done by Grey Relational Analysis approach [2].
T. Rajasekaran et al. (2013) found optimal cutting parameters for carbon fiber reinforced polymer material in turning operations using Taguchi's orthogonal array method [3].
Rajesh Kumar Bhushan (2013) optimized machining parameters in CNC turning of 7075 Al alloy 15 wt% SiC (particle size 20–40 μm) composite using RSM [4].
Satish Chinchanikar and S.K. Choudhury (2013) considered the effect of cutting parameters in turning of hardened AISI 4340 steel at various levels of hardness by using coated carbide tool. Experimental observations showed that large cutting forces are required for machining harder work material and determined optimum cutting conditions using RSM and desirability function approach [5] .
Zahia Hessainia et al. (2013) tested 42CrMo4 hardened steel by Al2O3 /TiC mixed ceramic cutting tool under various conditions. It was indicated that feed rate is the dominant factor affecting the surface roughness whereas vibrations have a low effect on it [6].
Catalin Fetecau and Felicia Stan (2012) presented an investigation into the turning of PTFE composites using a polycrystalline diamond tool in order to analyze the effect of the cutting parameters and insert radius on the cutting force and surface roughness according to the experimental plan developed based on the Taguchi methodology [7].
Suleyman Neşeli et al. (2011) focused on the influence of tool geometry on the surface finish obtained in turning of AISI 1040 steel by using response surface methodology (RSM). The results indicated that the tool nose radius was the dominant factor on the surface roughness [8].
Nilrudra Mandal et al. (2011) applied Taguchi method and Regression analysis to assess machinability of AISI 4340 steel with newly developed Zirconia Toughened Alumina (ZTA) ceramic inserts. The mathematical model of flank wear was developed [9].
D. Philip Selvaraj and Chandramohan P (2010) concentrated on dry turning of AISI 304 Austenitic Stainless Steel (ASS) to present the influence of cutting parameters such as Depth of cut, Feed rate & Cutting speed on the surface roughness using TiC and TiCN coated tungsten carbide cutting tool. Taguchi's technique was used to acquire the data [10].
Young Kug Hwang and Choon Man Lee (2010) did the investigation into the MQL and wet turning processes of AISI 1045 work material in order to predict optimal cutting parameters for cutting force & surface roughness and to analyze the effects of cutting parameters on mach inability. Fractional factorial design and CCD were used for the experiment plan [11].
Khaider Bouacha et al. (2010) did an experimental study of hard turning of AISI 52100 (64 HRC) bearing steel with CBN tool. The results revealed how much surface roughness is influenced by cutting speed & feed rate [12] .
Y. Sahin (2009) described a comparison of tool life between ceramics and CBN cutting tools when turning hardened bearing steels using the Taguchi method. The results indicated that V was found to be a dominant factor on the tool life followed by the hardness of cutting tool TH, lastly the f [13].
D.I. Lalwani et al. (2008) investigated the effect of cutting parameters on cutting forces (feed force, thrust force and cutting force) & surface roughness in hard turning of MDN250 steel using coated ceramic tool. The machining experiments were conducted based on response surface methodology (RSM). The results showed that cutting forces and surface roughness do not vary much with experimental cutting speed in the range of 55–93 m/min [14].
M. Nalbant et al. (2007) used Taguchi method to determine optimal cutting parameters for surface roughness in turning AISI 1030 steel bars employing TiN coated tools. 3 cutting parameters namely Insert radius, Feed rate and depth of cut were optimized [15].
Ersan Aslan et al. (2007) turned hardened AISI 4140 steel with Al2O3 based ceramic cutting tools by employing Taguchi techniques and combined effects of three cutting parameters namely cutting speed, depth of cut and feed rate on two performance measures flank wear (VB) and surface roughness (Ra) were investigated [16].
Wassila Bouzid (2005) used 4 types of commercially available inserts to turn an AISI 4340 steel. In this work, the machine power and the maximum spindle speed were considered as the process constraints. Cutting speed which gives the minimum production times was calculated [17] .
Ihsan Korkut et al. (2004) determined the optimum cutting speed when turning an AISI 304 austenitic stainless steel using cemented carbide cutting tools and influence of cutting speed on tool wear and surface roughness was investigated [18].
W.H. Yang and Y.S. Tarng (1998) employed an orthogonal array, the S/N ratio & the ANOVA to investigate the cutting characteristics of S45C steel bars employing WC cutting tools. Not only the optimal cutting parameters but also the main cutting parameters in turning operations were found [19].
The literature survey has revealed that several researchers have attempted to calculate the optimum cutting conditions for various materials in a turning operation, however, Feed rate, Spindle Speed and Depth of cut are important ones.
The classical approach to experimental planning involves huge effort and time and in some cases, where factor interactions take place, it is not applicable. The most efficient way to cut down the time in process development is through experimental designs. RSM is a collection of mathematical and statistical techniques that are used to model and analyze engineering application. The graphical representations of the equations are called response surfaces which can be used to explain the individual and cumulative effect of the process variables on the response and to determine the mutual interactions between the process variables and their subsequent effect on the response. In the present work, the experimental data has been collected by the face centered, CCD technique.
The process parameters that may affect the quality of the turned parts have been selected based on an Ishikawa cause effect diagram as shown in Figure 1. The Ishikawa cause-effect diagram depicts the variables that may affect the quality of the turned parts.
Figure 1. Ishikawa Cause-Effect Diagram for a Turning Process
The variables that may affect the machining characteristics i.e. MRR and Surface Roughness of parts are cutting parameters, cutting tool material, cutting environment and workpiece parameters. The selected process parameters are: Spindle speed, feed rate and depth of cut.
The levels and notation of the spindle speed, feed rate& depth of cut used to generate a total of 20 readings in an experimental design matrix are shown in Table 1.

Table 1. Levels of Independent Control Parameters
The workpiece material of size 50 mm dia. and 30 mm length is used for composition testing as shown in Figure 3. For this purpose, Baird Spectrovac Spectrometer has been used as shown in Figure 2. It gives the dispersive energy of materials in terms of percentage in the workpiece material. The chemical composition of AISI H21 Hot work tool steel for first 5 elements is shown in Table 2.
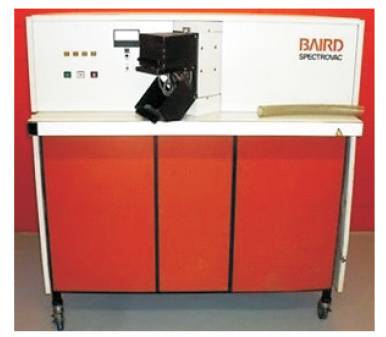
Figure 2. Baird Spectrovac DV-4 Direct Reading Optical Emission Spectrometer
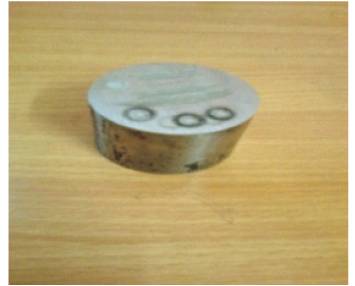
Figure 3. Specimen used for Composition Testing
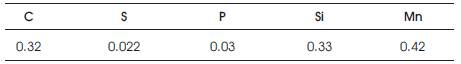
Table 2. Percentage of Elements in H21 Hot work tool steel
AISI H21 is a low-carbon, tungsten hot work steel that provides excellent resistance to soft at high temperature. For best results, it should not be water cooled unless tool designer mentions it. It is suitable for applications where red hardness, high compressive strength and wear resistance at elevated temperatures are required. H21 steel is used for high stressed hot work tools such as nuts and bolts, forming dies, hot shear blades, punches, presses, rams, forging dies etc. At Annealed condition, the hardness of this hot work tool steel i.e. H21 is 150 – 250 HB and at Tempering condition hardness is 53 HRC.
According to VDI 3323 Standard, Material can be converted into following designations as shown in Table 3.
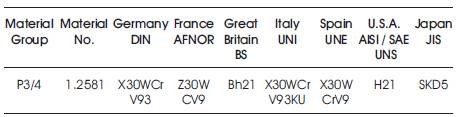
Table 3. Material Conversion table
The various mechanical and thermal properties of AISI H21steel are shown in Table 4 and in Table 5 respectively.
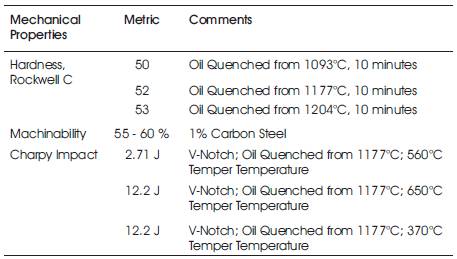
Table 4. Mechanical Properties
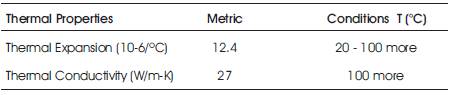
Table 5. Thermal Properties
Due to technological development in manufacturing industries, companies are switching to coated grades of carbide tools from regular carbide grades for machining operations of hardened steels. The recently developed tool materials like coated carbides have improved the productivity levels of difficult-to-machine materials. Thus coated carbide tool CNMG 120412 MP of grade TT8135 has been selected to turn H21steel.
Surface roughness has been measured using stylus type Mitutoyo surftest-4 surface roughness tester on a turning length of 20 mm. Before conducting the measurement, the instrument has been calibrated using a standard roughness specimen to ensure the consistency and accuracy of Ra values. Three measurements are conducted along the length of cut on each workpiece approximately equally positioned at an angle of 120° and the average Ra value is recorded.
The total length of the workpiece is used of 750 mm and of diameter 50 mm. 7 Samples have been cut of length 90 mm by using Power Hacksaw as shown in Figure 4 and Figure 5 respectively. Then, 30mm length of each bar has been held in the chuck and 60 mm has been turned to perform three experiments in 1 sample as shown in Figure 6.
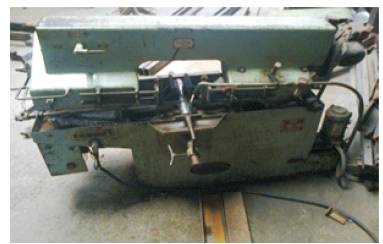
Figure 4. Power Hacksaw
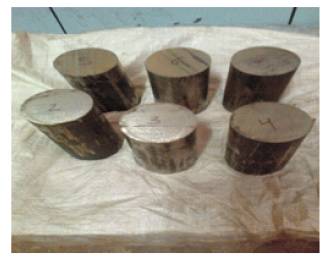
Figure 5. Specimens used for Experimentation
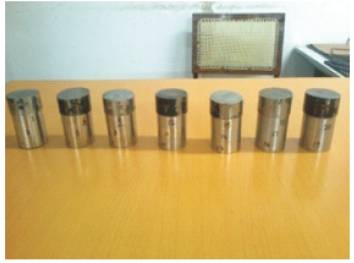
Figure 6. Turned Specimens
Experimental Design matrix with uncoded values and observed responses are shown in Table 6.
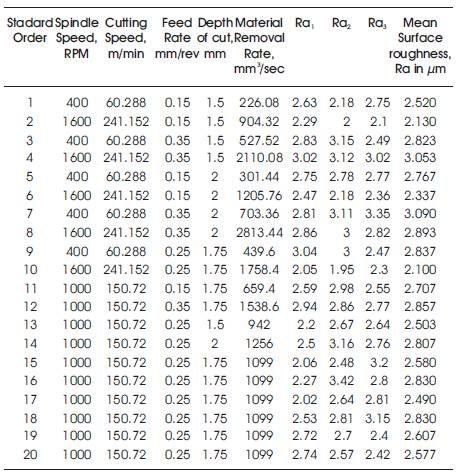
Table 6. Experimental Design matrix with uncoded values and observed responses
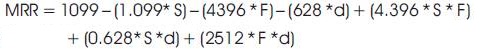
The material removal rate (MRR) is calculated by the multiplication of cutting speed (Vc), feed rate (f) and depth of cut (a) and expressed in mm3 /sec as:

Where, Vc = cutting speed in m/min.
The graphs, models, and tables presented in the following sections are produced using the design of experiments (DOE) and analysis modules of the software package Design Expert 9.0.3.1.
The theoretical models does not provide any significant information about the variation of cutting parameters like Spindle speed, feed rate and depth of cut. Thus, to improve the efficiency of the turning process, the mathematical models need to be developed for complete understanding of the prediction of responses and their effect on variables.
ANOVA for Response Surface 2FI model i.e. for MRR
Table 7 shows the ANOVA table for the reduced 2FI model for MRR in which A, B, C, AB, AC, BC are significant Model terms
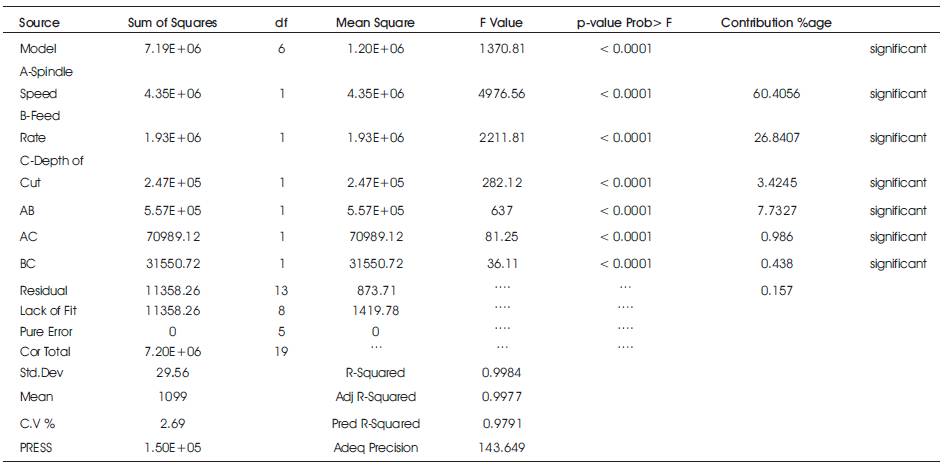
Table 7. Analysis of variance table for MRR after Backward Elimination
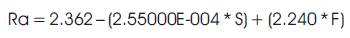
ANOVA for Response Surface Reduced Linear model i.e. for Ra
Table 8 shows the ANOVA table for the reduced Linear model for Ra. By selecting the backward elimination procedure, it automatically reduces the terms that are not significant as shown in Table 9. In this case A and B are significant model terms. Values greater than 0.1000 indicate the model terms are not significant.
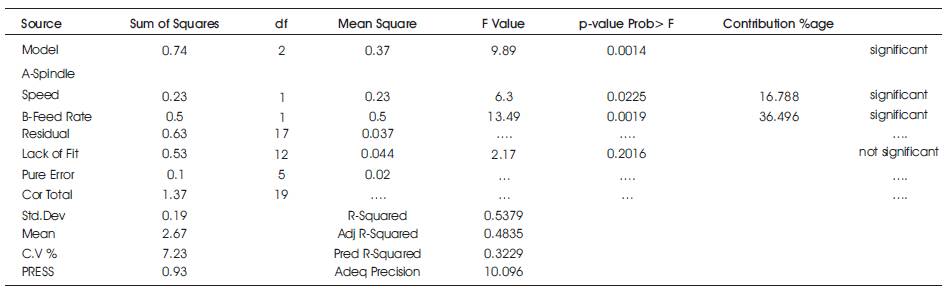
Table 8. Analysis of variance table for Ra after Backward Elimination
The effect of process parameters on output responses i.e. MRR and Ra is shown in Figures below.
It is a graph between the predicted response values and the actual response values. It helps to detect a value or group of values that are not easily predicted by the model. Figure 7 and Figure 8 shows that the actual values i.e. obtained through experimentation and the predicted valued i.e. values obtained from the model follow a straight line for the MRR and Ra.
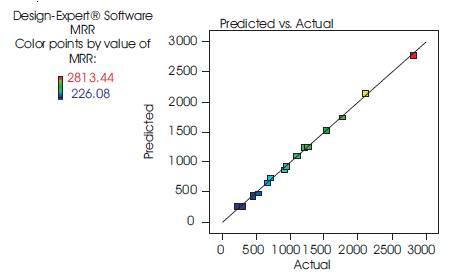
Figure 7. Predicted vs. Actual plot for MRR
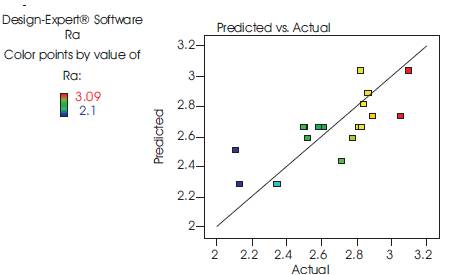
Figure 8. Predicted vs. Actual plot for Ra
The perturbation graph helps to compare the effect of all factors at a particular point in the design space. The response is plotted by changing only one factor over its range while holding all the other factors constant. A Perturbation plot for MRR and Ra is shown in Figure 9 and Figure 10 respectively.
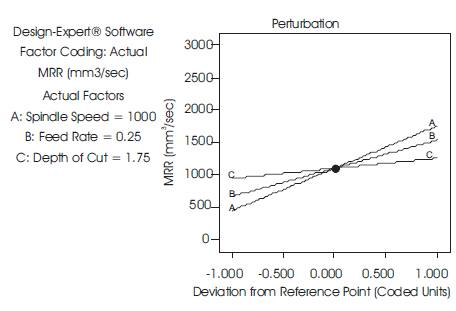
Figure 9. Perturbation plot for MRR
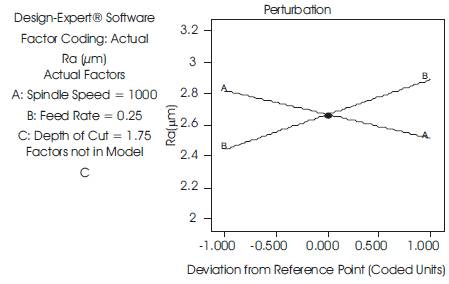
Figure 10. Perturbation plot for Ra
Figure 9 represents that MRR increases with increase in spindle speed (A), Depth of cut (C) & Feed rate (B) when these factors vary from their minimum level (-1) to maximum level (+1). Similarly, Figure 10 shows that Surface roughness decreases with increase in Spindle speed (A), however, increases with increase in Feed rate (B).
Contours are curves of constant response drawn in the Xi, Xj plane keeping all other variables fixed. The horizontal axis represents the most important factor in the experiment and the vertical axis shows the second most important factor in the experiment. The contour plot for MRR vs Feed Rate and Depth of cut is shown in Figure 11. This plot shows that Spindle speed is kept fixed at its mid level i.e. at 1000 r.p.m. and feed rate has dominant effect than depth of cut. As feed rate increases, the value of MRR increases but maximum MRR can be obtained at highest levels of Feed rate and Depth of cut. The contour plot for MRR vs Spindle speed and Feed rate is shown in Figure 12. It shows that Depth of cut is kept fixed at its mid level i.e. at 1.75 mm and spindle speed has dominant effect than feed rate. As spindle speed increases, the value of MRR increases, however, maximum MRR can be obtained at highest levels of Spindle speed and Feed rate.
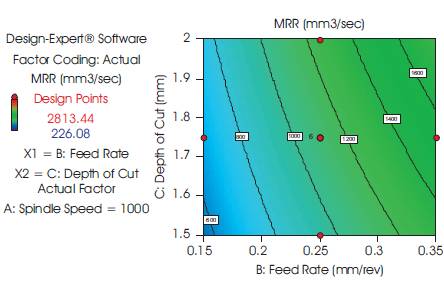
Figure 11. Contour plot for MRR vs Feed Rate and Depth of cut
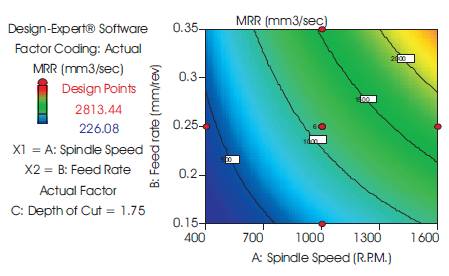
Figure 12. Contour plot for MRR vs Spindle speed and Feed rate
Similarly, the contour plot for Ra vs Feed Rate and Spindle speed is shown in Figure 13. It shows that minimum Ra can be obtained at highest level of Spindle speed and at lowest level of Feed rate.
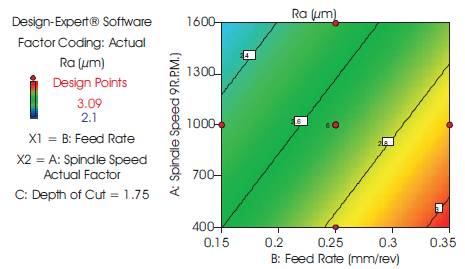
Figure 13. Contour plot for Ra vs Feed rate and Spindle speed
Response Surface Optimization is attempted using DESIGN EXPERT software of version 9.0.3.1 for individual cutting parameters in turning.
Desirability is an objective function that differs from 0 outside of the limits to 1 at the goal. Numerical optimization determines a point that maximizes the desirability function. The aim of optimization is to determine optimum conditions that fulfill all the goals, however, not only to get a desirability value of 1.0. By default, the input factors will be set "in range", thus preventing extrapolation.
Desirability analysis has been done to maximize the MRR and minimize Ra as per constraints shown in Table 9 and Table 10 respectively.
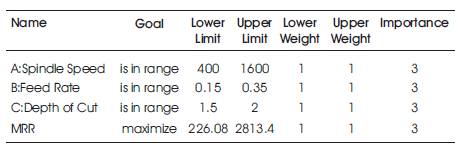
Table 9. Constraints for MRR
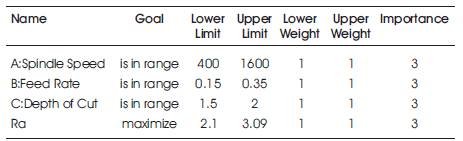
Table 10. Constraints for Ra
Solution 1, which is having maximum value of desirability for MRR & Ra i.e. 0.982 and 0.808 respectively, has been selected. Table 11 & Table 12 show the optimization results for the response MRR and Ra in turning of AISI H21 steel. The desirability values for the MRR and Ra shows the conformity to the optimality since desirability is nearer to 1.
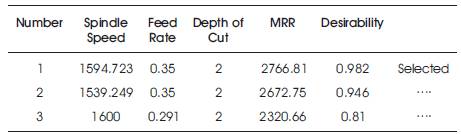
Table 11. Optimization Solutions for MRR
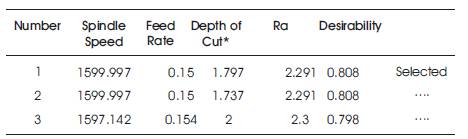
Table 12. Optimization Solutions for Ra
Histogram is a simple view that shows the desirability for each factor and each response individually. The factors bars are represented by different colors from response bar which has more ambitious goals (minimize, maximize, etc.).
In Figure 14 and Figure 15, the individual desirability value of the responses MRR & Ra is shown by dark blue colour bar where these responses are optimized and the individual desirability value of the factors are shown by red colour bar. As per this bar chart, MRR & Ra is having maximum desirability i.e. 0.981978 and 0.807575 respectively and all the factors have its desirability value equal to 1.
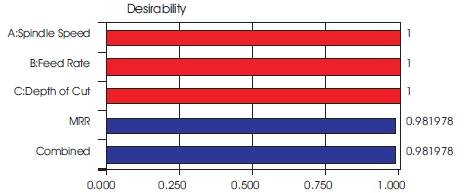
Figure 14. Histogram for MRR
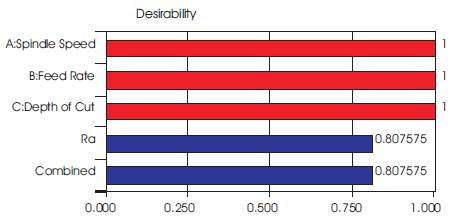
Figure 15. Histogram for Ra
It may be noted that Design of experiments and statistical methods have commonly been used for analysis, prediction and optimization in machining. It is effective in the investigation of the effects of multiple factors on performance as well as to study the influence of individual factors to determine which factor has more influence or which one has less. The following conclusions are drawn based on this study:
a) 2FI model developed for MRR is reasonably accurate & can be used for prediction within the range of investigated parameters.
b) Feed rate has a great influence on the surface roughness (36.496%) followed by Spindle speed (16.788%).
c) Surface roughness is not much affected by the range of cutting parameters like Spindle speed (400 – 1600 r.p.m.), Feed rate (0.15 – 0.35 mm/rev) & Depth of cut (1.5 – 2 mm).
d) The spindle speed (60.405%) and among interactions – Spindle Speed and Feed rate (7.732%) has the greater contribution in increasing the MRR.
e) MRR increases with increase in spindle speed, Depth of cut & Feed rate and Surface roughness decreases with increase in Spindle speed, however, increases with increase in Feed rate.
f) The optimum values of Spindle Speed, Feed rate and Depth of cut to maximize the MRR (2766.81 mm3 /sec) are 1594.723 RPM, 0.35 mm/rev and 2 mm respectively.
g) The optimum values of Spindle Speed, Feed rate and Depth of cut to minimize the Ra (2.291 μm) are 1599.997 RPM, 0.15 mm/rev and 1.797 mm respectively.
The results obtained show that the application of R.S.M can predict the effect of cutting parameters on MRR and surface roughness. The predicted optimal setting ensured maximization of MRR (Material Removal Rate) and minimization of surface roughness. In future, this study can be extended by using different cutting tool materials, optimize the process parameters by taking other various responses such as tool overhang, tool vibration, tool wear, tool life, workpiece surface temperature etc.and can also improved surface finish & MRR by changing range of the various parameters.