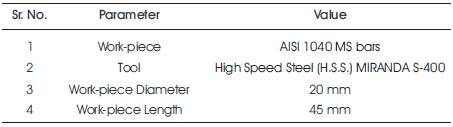
Table 1. Fixed Process Parameters
Multi-Response optimization of response variables having opposite nature is cumbersome to obtain without use of optimization techniques. In this research work, Grey relational analysis and Taguchi Design approach are used for multi response optimization of metal removal rate and surface roughness during turning of AISI 1040 MS bars. Taguchi orthogonal array L9 is used to design the experiment. Signal to Noise (S/N) ratio of both responses i.e. metal removal rate and surface roughness are used to calculate grey relational grade. Analysis of Variance (ANOVA) is used to identify the significance of process parameters on grey relational grade and shows that feed rate and spindle speed are most significant process parameters for both the responses. The confirmation experiments show that Taguchi-Grey relation analysis can be successfully utilized to obtain the multi-response optimization.
Turning is the removal of metal from the outer diameter of a rotating cylindrical work piece. It is used to reduce the diameter of the work piece, usually to a specified dimension, and to produce a smooth finish on the metal. There are three main parameters in any basic turning operation spindle speed, feed and depth of cut. Other parameters like material and type of tool have a significant influence, of course, but these three are the ones the operator can change by adjusting the controls, right at the machine. Spindle speed always refers to the spindle and the work piece. When it is stated in revolutions per minute (rpm) it tells their rotating speed. Feed always refers to the cutting tool, and it is the rate at which the tool advances along its cutting path. On most power-fed lathes, the feed rate is directly related to the spindle speed and is expressed in mm (of tool advance) per revolution (of the spindle), or mm/rev. Depth of cut is the thickness of the layer being removed (in a single pass) from the work piece or the distance from the uncut surface of the work to the cut surface, expressed in mm.
Patel et al. [1] optimized the EDM process parameters like discharge current, pulse on time, duty cycle and gap voltage for the response variables i.e. metal removal rate and surface roughness using grey relational analysis. Aggarwal et al. [2] carried out theoretical and experimental studies to investigate the influence of wear parameters like applied load, sliding speed, percentage of reinforcement content and sliding distance on the dry sliding wear of the composites. Design of experiments, based on the techniques of Taguchi, was performed to acquire data in controlled way. An orthogonal array and the analysis of variance were employed to investigate the wear behaviour. Aggarwal and Singh [3] proposed Taguchi technique to review the literature on optimizing machining parameters in turning processes. Various techniques used for machining optimization include geometric programming, geometric plus linear programming, goal programming, sequential unconstrained minimization technique, dynamic programming etc. Singh and Kumar [4] studied to obtain an optimal setting of turning process parameters (cutting speed, feed rate and depth of cut) resulting in an optimal value of the feed force when machining mild steel with cast iron tool. Selvaraj and Chandramohan [5] presented the influence of cutting parameters like cutting speed, feed rate and depth of cut on the surface roughness of austenitic stainless steel during dry turning. A plan of experiments based on Taguchi's technique has been used to acquire the data. Savadamuthu et al. [6] improved the quality of turning using an advanced technique. They found that the Taguchi method is used to find the optimal cutting parameters in turning operations. The orthogonal array, the signal-to-noise ratio, and analysis of variance are employed to study the performance characteristics in turning operations of AISI 1030 steel bars using TiN coated tools. Sharma and Sharma [7] optimized the process parameters for surface roughness of turning parts using Taguchi Method. The material used is mild steel and they found that depth of cut has maximum contribution toward the response variable.
Kumar et al. [8] investigated the optimized setting of WEDM process parameters with multiple quality characteristics such as MRR, SR and Kerf using Grey–Taguchi Method and Incoloy800 super alloy as work piece. The process parameters considered in this research work are Gap Voltage, Pulse On-time, Pulse Off-time and Wire Feed. Taguchi's L9 OA was used to conduct experiments. Optimal levels of process parameters were identified using Grey Relational Analysis and the relatively significant parameters were determined by ANOVA. Singh and Khanna [9] optimized the process parameters for the processing of cryogenically treated D-3 tool steel taking cutting rate as a response variable. An L27 orthogonal array has been used for conducting experiments and statistically evaluating the experimental data by analysis of variance (ANOVA). It has been seen that cutting rate decreases with increase in pulse width, time between two pulses and servo reference mean voltage. Cutting rate first decreases and then increases with increase in wire mechanical tension.
Literature survey reveals that no-work was reported on the use of integrated optimization techniques. The present work has been carried out for the multi response optimization of AISI 1040 steel using integrated Grey relation analysis and Taguchi Design approach. The advantage of integrated Taguchi Grey relational analysis over other conventional technique is that this technique is easily interpreting the result. This is a mathematical technique for the multi quality performance optimization.
The turning machines are, of course, every kind of lathes. Lathes used in manufacturing can be classified as engine, turret, automatics, and numerical control etc. Lathe used in turning of work piece is Centre Lathe, with 03 Phase induction motor. It is made by Sant Machine Tools Corp. Ludhiana. The 1 division of depth of cut equal to .05mm.V-belt drive is used in this lathe. This is an automatic feed centre lathe with manual depth of cut. The fixed process parameters are given in Table 1. The working ranges of the parameters for subsequent design of experiment [10], based on Taguchi's L9 Orthogonal Array (OA) design have been selected. In the present experimental study, spindle speed, feed rate and depth of cut have been considered as process variables. The process variables are given in Table 2. The control factors with their levels are given in Table 2.
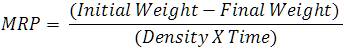
Response variables are Metal Removal Rate (MRR) and Surface Roughness (SR). MRR can be measured from the equation 1, while the surface roughness can be measured with the use of surface roughness tester of Mitutoyo's make SJ-201P. The weight of the work piece has been measured in a high precision digital balance meter (Model: DHD – 200 Macro single pan DIGITAL reading electrically operated analytical balance made by Dhona Instruments), which can measure up to the accuracy of 10-4g and thus eliminates the possibility of large error while calculating Material Removal Rate (MRR) in straight turning operation.
Taguchi Technique has been employed for single quality characteristics optimization while Grey relational analysis is used for multiple response optimizations. Antony [11] attempted simultaneous optimisation of multiple quality characteristics in manufacturing processes using Taguchi's quality loss function. The use of Taguchi method with the grey relational analysis can greatly simplify the optimization of process parameters for multiple-performance characteristics [12]. In grey relational analysis, grey relational coefficient for different process characteristics is calculated and average of these coefficients is called grey relational grade which is used as a single response for the Taguchi's experimental plan. The optimization of the process is performed according to Figure 1.
Table 1. Fixed Process Parameters
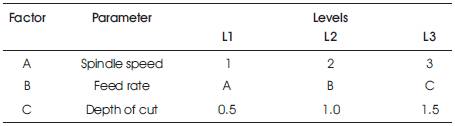
Table 2. Process Variables and their Levels
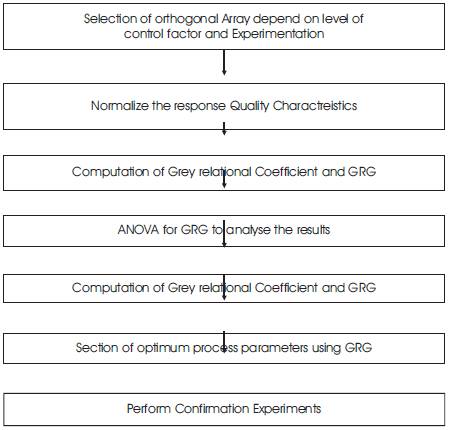
Figure 1. Process Flow Chart of Grey Relational Analysis
Experiments have been carried out using Taguchi's L9 Orthogonal Array (OA) experimental design which consists of 9 combinations of spindle speed, longitudinal feed rate and depth of cut. According to Taguchi L9 Orthogonal Array design of experiment, three process parameters (without interaction) are varied in three discrete levels. The Material Removal Rate (MRR) in turning operations is volume of material/metal removed per unit time (mm3/min) and is calculated using equation 1. For each revolution of the work piece, a ring shaped layer of material is removed.
S/N ratios of MRR and SR are used for multi response optimization. Table 3 gives the S/N ratios of the response variables for AISI 1040 steel.
For performing grey relational analysis, data pre-processing is required, since the range and unit in one data sequence may differ from the others. Data pre-processing is a process of transferring the original sequence to a comparable sequence. For this, the results are normalised in the range between zero and one. Depending on the characteristics of data sequence, there are various methodologies of data pre-processing available for the grey relational analysis. As the grey relational grade is calculated based on S/N ratio and for S/N ratio "larger-the-better" will be taken, the original sequence can be normalised as follows:
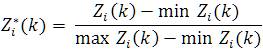
where, Z*i(k) is the sequence after data pre-processing, Zi (k) is the original sequence of S/N ratio.
Where k=1 for MRR, k=2 for SR. i=1, 2, 3…, 9 for experiment numbers 1 to 9. Table 3 reports the data after pre-processing for work-material.
The grey relational coefficient is investigated to reveal the relationship between the optimal and actual normalized results. As per statistics of Table 3, the deviational sequence Δ0i(k) and grey relational coefficient ξi(k) are achieved.
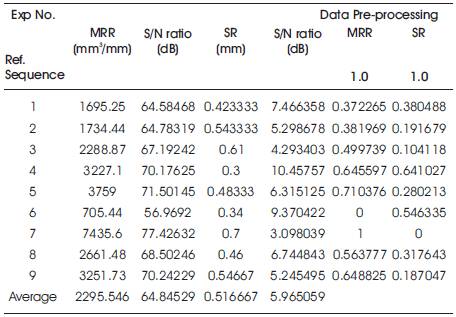 Table 3. SN Ratios of Response Variables and their Data Pre-Processing
The average value of the grey relational coefficient ξi(k) is the grey relational grade γ for all performance characteristics.
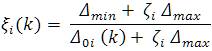
Δ0i(k) is the deviation sequence of the reference sequence Z*0(k) and the comparability sequence Z*i(k), ζ is identification coefficient. If both the responses are given equal predilection, ζ is taken as 0.5. The deviation sequence Δ0i(k) of the reference sequence Z*0(k) and the comparability sequence Z*i(k) is reported in Table 4. Mathematically,
After investigating the grey relational coefficient, the grey relational grade is computed by taking average of the grey relational coefficient corresponding to each performance characteristic.
The overall evaluation of the multiple performance characteristics is based on the grey relational grade, i.e.
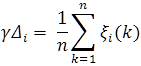
Where γi is the GRG for the ith experiment and n is the number of response variable. Table 5 gives the grey relational grade for each experiment using L9 orthogonal array. Larger GRG characterizes that the analogous result is closer to the ideally normalised value.
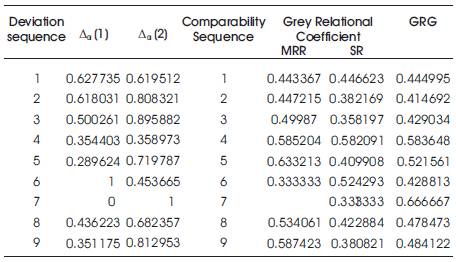
Table 4. Deviational Sequence, Grey Relational Analysis and Grey Relational Grade (GRG) of Response Variables
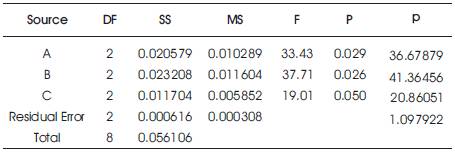
Table 5. Analysis of Variance for GRG (Raw Data)
ANOVA is extensively used for finding the percentage contribution of significant process parameters. ANOVA and response table for means are given in Tables 5 & 6 respectively. Graphs of Grey relational grade are shown in Figure 2. In Figure 2 it is shown that with the increase of cutting speed and depth of cut the GRG increases while with the increase of feed the GRG decreases.
In order to confirm the optimal parametric combination obtain for multi-response optimization, three confirmation experiments are conducted for each of the response characteristics i.e. MRR and SR. The average values of the response variables were obtained and compared with the predicted ones. The results are reported in Table 7. The confirmation experiments give the values within the 95% of confidence interval.
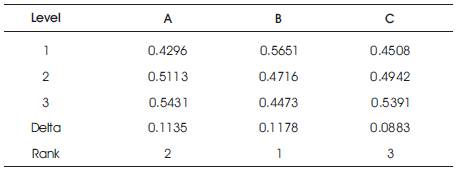
Table 6. Response Table for Grey Relational Grade
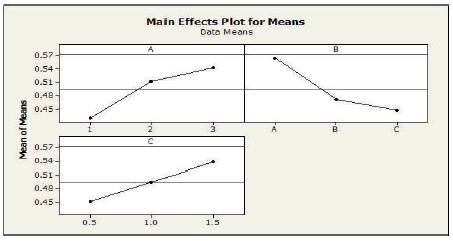
Figure 2. Main Effects Plots for Means (GRG)
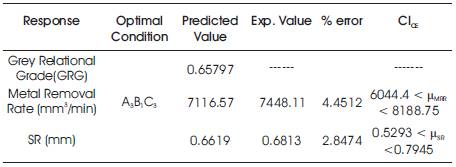
Table 7. Predicted Value and Confirmation Experiments Results
The machining variables included spindle speed, feed rate and depth of cut. ANOVA results show that spindle speed, feed rate and depth of cut are significant process parameters for responses i.e. metal removal rate and surface roughness during turning of AISI 1040 steel. Optimal parametric combination A3B1C3 is identified for multi-response optimization based on Grey relational analysis. ANOVA results revealed that spindle speed, feed rate and depth of cut have 36%, 41% and 20% contribution respectively in the machining of work material. From this study it is concluded that with the help of grey relational analysis, optimal level of process parameters can be predicted successfully. The percentage error found in this study varies 2.8% to 4.5%. So confirmation experiments represents excellent reproducibility of the results as compared to predicted values.