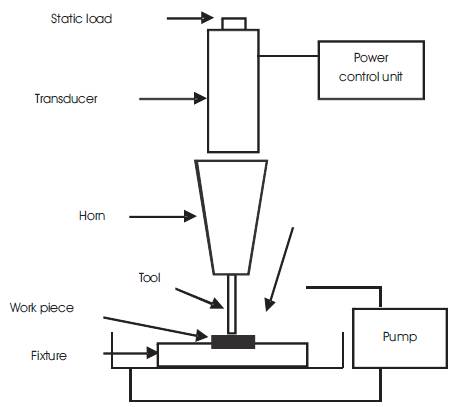
Figure1. Schematic Diagram of MicroUSM Setup for Fabricating Microchannels
Micro ultrasonic machining is being explored of late as a mechanical micromachining method to fabricate micro channels on hard and brittle materials. A significant advantage of the process is that the process can be used to machine materials irrespective of their electrical conducting unlike many other popular micro fabrication processes. In the present paper, influences of process parameters were investigated while fabricating microchannels on silicon wafers. Response Surface Methodology (RSM) approach was used to analyze the results. Abrasive mesh size, static load, slurry concentration and power rating were considered as input process parameters while surface roughness and Material Removal Rate (MRR) were considered as process responses. The response curves illustrating the individual effect and also the combined effect of process parameters have been presented.
Microchannels are widely used in many microfluidic systems such as micro heat exchangers, refrigerators, evaporators, condensers and micro chips (which have high power density) to dissipate large heat fluxes efficiently while keeping the surface temperature with in prescribed limit [[1,2]. Microchannels are also used in many biological systems for providing very high heat and mass transfer rates in organs such as the brain, lungs and kidney [3]. Microchannels are generally fabricated on silicon, metal or glass materials of circular, rectangular and trapezoidal cross sections. It has been found that a fabrication technique greatly affects the performance of microchannels.
Microultrasonic machining (micro USM) is a versatile mechanical micromachining technique to fabricate microchannels free from thermal damages preferably for those materials which have low ductility [4-6] and hardness above 40 HRC on hard and brittle materials, whether it is conducting or non-conducting [7-9].
Microultrasonic machining (Micro USM) consists of high frequency oscillating current generator, which converts low frequency electric power to high frequency electrical power. The high frequency electrical power signals are then supplied to a transducer to get mechanical motion to be subsequently transmitted to a horn/tool assembly. The output of the horn obtained as the tool vibrating along its longitudinal axis at a very high frequency (≥ 20 kHz). A controlled static load is applied to the tool and abrasive slurry is pumped around the cutting zone. The vibrating tool impacts the abrasive particles (which are held in slurry) on the work surface. As a result, material is removed from the work surface as the replica of tool [10-12]. However, other minor mechanisms of material removal have also been proposed apart from this like material removed by abrasion [13], micro chipping [14], cavitation effect [15] and chemical action [16]. But the material is removed by individual or combined effect of the mechanisms. For porous materials (graphite) and ceramics, significant material removal is done by cavitation erosion [17]. The mechanism of the little explored other phenomena are yet to be understood well. Influence of the process variables are also far from being well explained.
In the present work, a set of 29 experiments were carried out in which abrasive mesh size, static load, slurry concentration and power rating were considered as input process parameters while surface roughness and material removal rate (MRR) were considered as responses. The response curves illustrating the individual effect and also the combined effect of process parameter have been discussed.
The schematic diagram of microUSM experimental setup used during the trials is shown in Figure 1.
A special mild steel tool shown in Figure 2 was developed to fabricate the open microchannels. The microchannel dimensions are 15 mm (length) ×1 mm (width) × 1 mm (depth) as shown in Figure 3.
Experiments were designed on the basis of the experimental design technique proposed by Box and Hunter [17, 18]. The technique was employed to determine the effects process variables on the output of the process and their interaction within a specified range of parameters. Twenty nine trials with five center points were conducted according to the Box-Behnken design of experiments of response surface method. Box-Behnken Designs (BBD) are a class of rotatable or nearly rotatable second-order designs based on three-level incomplete factorial designs. The experiments were performed according to the plans arrived at using standard design of experiment tool (DX8). The process parameters and their levels in the experimentation are shown in Table 1.
The Material Removal Rate (MRR) was calculated by using the relation (1) and surface roughness (µm) was calculated directly by a perthometer [make: Taylor Hobson, resolution: .01µm]. The samples were cleaned in an ultrasonic bath prior to and after the trials. Measurement of weights was carried out using a well calibrated digital weighing instrument [make:SHIMADZU, least count: .01mg].
| MRR = [(initial weight – final weight) /time taken] mg/s | (1) |
The measured process responses corresponding to each experimental run are shown in Table 2.
Figure1. Schematic Diagram of MicroUSM Setup for Fabricating Microchannels
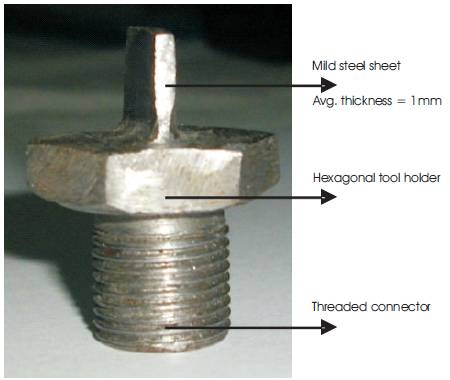
Figure 2. Typical Mild Steel Based Micro Tool for Fabricating Microchannels
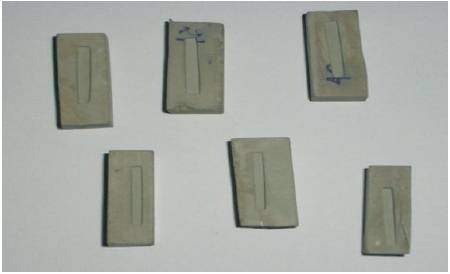
Figure 3. Silicon Workpieces After Fabrication of Open Microchannels
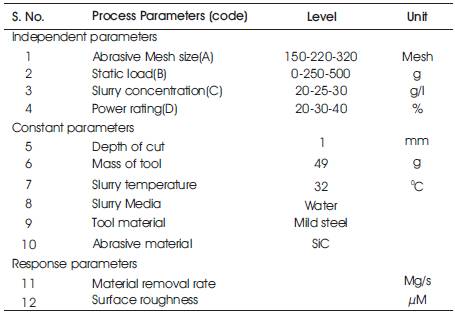
Table 1. Process Parameter and Their Levels
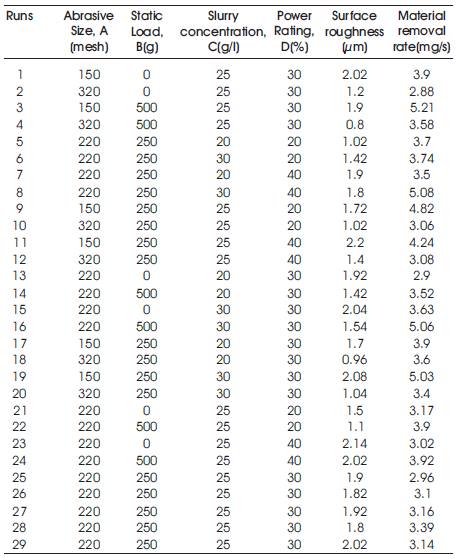
Table 2. Experimental Results for Different Trials
Experimental trials were carried out as per the designed parametric conditions discussed in Table 1 in order to investigate the effect of process parameters on surface roughness and material removal rate. The DX8 software was used to analyze the obtained raw data. Analysis of variance (ANOVA) was performed to statistically analyze the results. Quadratic mathematical models were proposed for surface roughness (R1) and material removal rate (R2) in terms of coded factors presented in equations (2) and (3).
| R1= 1.82 - 0.43 * A - 0.18 * B + 0.075 * C + 0.30 * D - 0.062 * A * B - 0.068 * A * C - 0.040 * A* D + 0.000 * B * C + 0.070 * B * D - 0.12 * C * D - 0.20 * A2 - 0.073 * B2 - 0.17 * C2- 0.12 * D2± ε | (2) |
| R2 = 3.02 - 0.63 * A + 0.46 * B + 0.36 * C + 0.051 * D - 0.14 * A * B - 0.35 * A * C + 0.12 * A * D + 0.20 * B * C + 0.042 * B * D + 0.38 * C * D + 0.56 * A2+ 0.18 * B2+ 0.48 * C2+ 0.25 * D2± ε | (3) |
where 'ε' is the experimental error.
The ANOVA results of surface roughness and material removal rate are given in Table 3. The fit summary reveals that the fitted model is statistically significant to analyze the values of the desired responses. The adequate precision measures the signal-to-noise ratio i.e. it compares the range of the predicted value at the design point to the average prediction error. A signal-to-noise ratio greater is desirable as it presents adequate model discrimination. High ratios obtained for all the models indicate an adequate signal. These models present higher values of the determination coefficient (R2) and adequate precision at the same time. The determination coefficient (R2) given in the resulting ANOVA table is defined as the ratio of the explained variation to the total variation and a measure of degree of fit. When R2 approaches unity, the response model fits the actual data with fidelity. The various R2 statistics (R2, adjusted R2 and predicted R2) are given in Table 3.
The lower values of coefficient of variation that are given in the table will indicate improved precision and reliability of the conducted experiments.
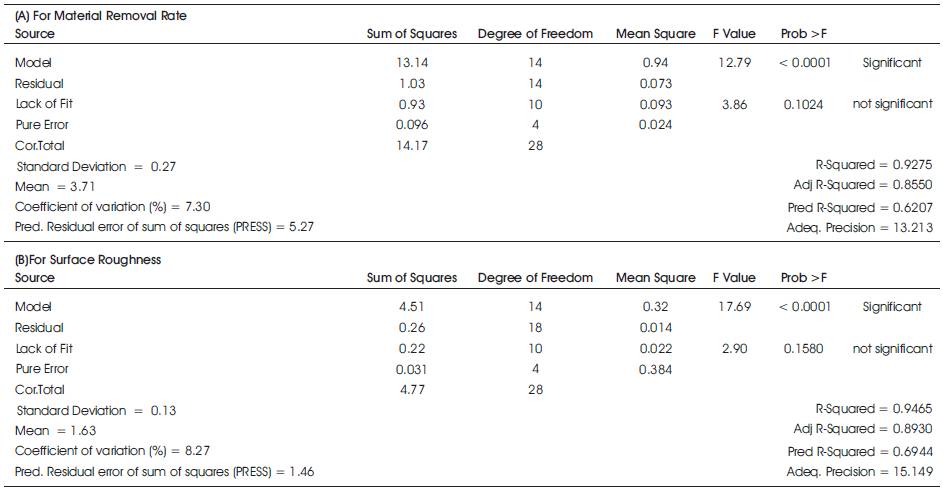
Table 3. ANOVA for Fitted RSM Model for Surface Roughness and Material Removal Rate
The effects of individual process parameters on the surface roughness are shown in Figure 4(a-d). In each plot, the factor of interest was varied from its lower level to higher level, where as the rest of the factors were maintained at their mid levels. The surface roughness decreases with increase in abrasive mesh size as shown in Figure 4(a). Large mesh size abrasives produced a crater with small depth of indentation, so large mesh size abrasives remove small volume of work piece in each indentation.
A sharp decline was found in surface roughness with fine abrasive size. It is observed that when static load increases, surface roughness decreases, it is due to crushing of abrasives into small pieces and suppression of lateral vibrations of tool. As a result good surface finish was obtained at maximum static load as shown in Figure 4(b). In case of slurry concentration, surface roughness increases with increases in slurry concentration. On increasing the slurry concentration, participation of abrasive particles to cut the work piece increases per unit volume of slurry flow. Removal of material from work surface is in the form of big craters owing to multiple abrasives in action. As shown in Figure 4(c) good surface finish is obtained at minimum slurry concentration. Power rating is almost directly proportional to surface roughness as shown in Figure 4(d). On increasing the power rating, abrasive particles strike the work surface with great momentum and impact which produces craters with large depth of indentation, as a result removal of material from surface in form of big craters that finally deteriorates the surface finish. Typical response surface illustrating the effect of combination of process parameters on the process responses are presented and discussed in this section. Figure 5 shows the typical surface roughness of the silicon work pieces with respect to slurry concentration and power rating. It is seen that surface roughness is maximum at combination of 25 g/l slurry concentration and 40% power rating. It was found that surface finish improves beyond 25 g/l slurry concentration at maximum power rating. Good surface finish was obtained at maximum value of slurry concentration (30 g/l) andat minimum power rating (20%), it is the best combination to achieve fine finish because there is optimal distribution ofmomentum energy to abrasive particles provided by 30 g/l slurry concentration.
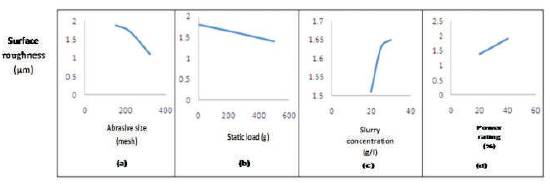
Figure 4. Response Curves Showing the Individual Effect of Process Parameters on Surface Roughness (a) Abrasive Mesh Size (b) Static Load © Slurry Concentration (d) Power Rating
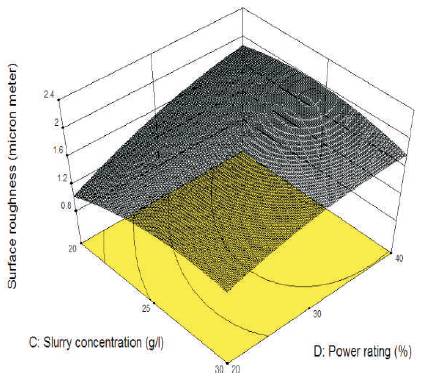
Figure 5. Response Surface for Combined Effect of Slurry Concentration and Power Rating on Surface Roughness
The effects of individual process parameters on the material removal rate are shown in Figure 6(a-d). In each plot, the factor of interest was varied from its lower level to higher level, while the rest of the factors were maintained at their mid levels. It is clearly observed that the MRR increases with decrease in abrasive mesh size as shown in Figure 6(a). Because smaller mesh size abrasives produced a crater with big depth of indentation, small mesh size abrasives were used to remove maximum volume of work piece in each indentation. As a result small mesh size abrasives yield a better material removal rate. It was observed that on applying static load to the horn, abrasive particles crush into small particles, and due to this the number of cutting edges increased, which results in removal of large volume of material as shown in Figure 6(b). In case of slurry concentration MRR increase sharply as shown in Figure 6(c), it is because the participation of abrasive particles to cut the work piece increases per unit volume of slurry flows. 30g/l slurry concentration gives the better material removal rate. MRR is directly proportional to power rating as shown in Figure 6(d). On increasing the power rating, the momentum transfer to abrasive particles increases so abrasives strike to the surface with big impact which results is removal of large volume with big craters. Typical response surfaces illustrating the effect of combination of process parameters on the process responses are presented and discussed in this section. Figure7 shows typical improvement in material removal rate of the silicon microchannels with respect to abrasive size and slurry concentration. It is seen that material removal rate increases sharply with decrease in abrasive mesh size and increase in slurry concentration. It is observed that best results of material removal rate are found on the combination of 150 mesh (abrasive size) and 30g/l (slurry concentration). Small mesh size abrasives produce maximum depth indentation on work surface and remove material in big crater. But in this case maximum numbers of particles per unit volume slurry flow produces maximum depth indentation on work surface and this combined effect results in maximum material removal rate.
Figure 8 shows typical improvement in material removal rate of the silicon microchannels with respect to slurry concentration and power rating. It is seen that material removal rate increases with maximum power rating (40%) and maximum slurry concentration (30 g/l). It is because of effective transfer of momentum to maximum number of abrasive particles.
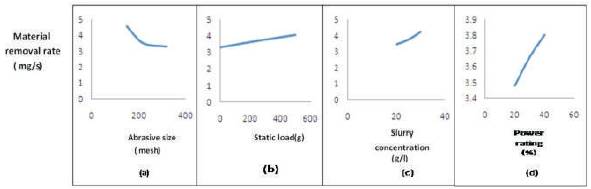
Figure 6. Response Curves Showing the Individual Effect of Process Parameters on Material Removal Rate (a) Abrasive Mesh Size (b) Static Load (c) Slurry Concentration (d) Power Rating
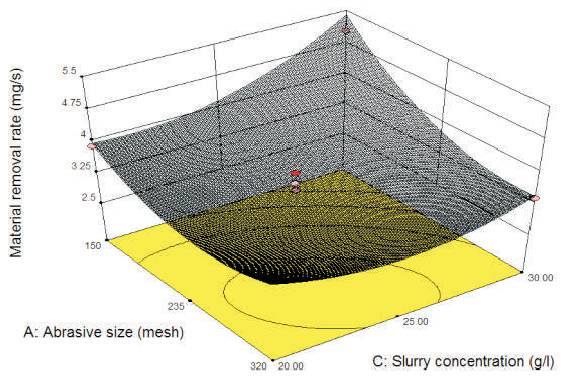
Figure 7. Response Surface for Combined Effect of Abrasive Size and Slurry Concentration on Material Removal Rate
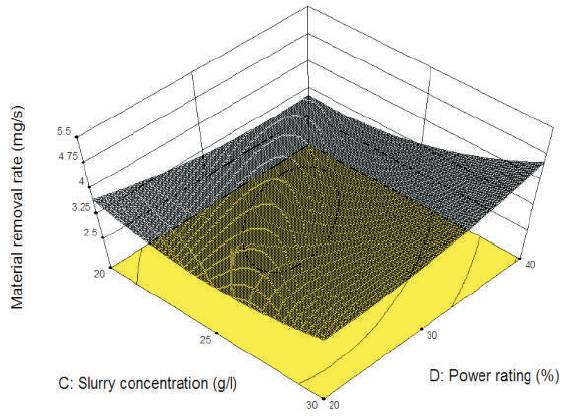
Figure 8. Response Surface for Combined Effect of Slurry Concentration and Power Rating on Material Removal Rate
In microchannel applications surface quality plays a major role, so it is important to know about the surface quality. Figure 9 shows that the channel walls and nearer area of those walls gets distorted in irregular manners. It is because of pitting action of randomly impacting abrasives. It is found that sometimes dimensions of the channels get varied from the desire values as per the tool dimensions, if number of stray particles becomes more.
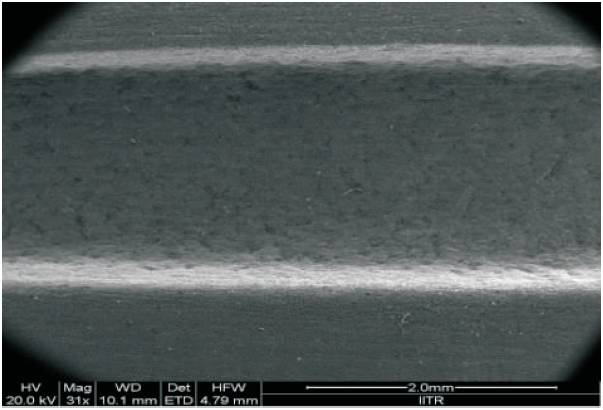
Figure 9. Typical SEM Micrograph of Fabricated Si Microchannel
This research endeavor primarily focused on the experimental investigation of influence of process parameters while fabricating microchannels on silicon material. A special tool of mild steel was used to cut the micro channels. The effect of abrasive mesh size, static load, slurry concentration and power rating on surface roughness and material removal rate were studied. The results have been derived using various expressions and commercial analysis tools and techniques. Individual and combined effect of process parameters on material removal rate and surface roughness are presented with the help of 2D and 3D graphs. Thus, these results can be used by other researchers and practitioners in industries for developing their scheme to fabricate microchannels using microultrasonic machining. The optimization shall help them to avoid repetitive works. Other major conclusions that can be drawn from the study include.
This research focused on the experimental investigation of influence of process parameters while fabricating microchannels on silicon material. It has been derived using various expressions and commercial analysis tools and techniques. Thus the result can be used by other researchers and practitioners in industries for developing their scheme to fabricate microchannels using microultrasonic machining.