
Elasto-plastic constitutive equations are integrated in the framework of nonlinear finite element techniques based on so-called predictor corrector schemes. An Introduction of material nonlinearities (elasto-plastic behaviour) are applied in the framework of finite element analysis. The restriction to the one-dimensional case facilities significantly the mathematical notation while the steps remain the same as in the general three dimensional cases. In addition, the entire solution procedure can be easily observed in the classical stress-strain diagram. The concept of the predictor corrector scheme is presented for the case of isotropic, kinematic and combined hardening. Numerical examples illustrate the influence of different boundary conditions for different hardening laws.
The introduction of linear-elastic finite element techniques can be regarded nowadays as a standard subject in mechanical, civil and aerospace engineering degree programs. However, the consideration of nonlinearities such as elasto-plastic material behaviour in finite element techniques is still not so established in the academic curriculums. The reason might be that the demands on the constitutive laws are much higher since the elastic law must be extended to the plastic part which usually involves the consideration of a yield condition, a flow rule and a hardening rule. On the other hand, a nonlinear system of equations is obtained which requires the application of iterative solutions schemes such as the Newton-Raphson method. Furthermore, stress paths in generalised coordinate systems (e.g. a principal stress system) are difficult to represent. Thus, the consideration of material nonlinearities in the framework of the finite element method requires some input from continuum mechanics and higher engineering mathematics. Furthermore, the mathematical notation in the three dimensional case might be difficult on the first glance. Nevertheless, there are excellent textbooks on the market which introduce this topic and cover the general case. Probably the first textbook which covers the topic of finite elements and plasticity was written by Owen and Hinton in 1980 [1]. Later on, several specialised textbooks were written for example by Crisfield in 1991 and 1997 [2,3] and Simo and Hughes in 1998 [4]. The more recent textbooks on that topic were written by Belytschko et al. in 2000 [5] , Dunne and Petrinic in 2005 [6] and de Souza et al. in 2008 [7]. Many more textbooks which are not cited here cover the topic of plasticity and finite elements in specialised chapters. Furthermore, to determine the Lemaitre damage model for ductile material, the authors presented similar algorithm in [8] .
It should be noted that the above mentioned textbooks partially refer to the one-dimensional case. However, the information is often scattered over the entire textbook or the authors move quickly to the general case. A consequent introduction of the general concept of plasticity in the framework of the finite element method based on one-dimensional stress and strain states may help to overcome this problem and facilitate the understanding of the general three-dimensional case. For this purpose, a one-dimensional model case is considered which does not show any contraction perpendicular to the loading direction. This is a simplification to real uniaxial loading cases where a specimen would show a deformation perpendicular to the loading direction. However, this simplification makes the entire mathematical description of the problem much simpler while the basic steps do not change. To further simplify and make the entire derivations more transparent, matrices in the following analytically inverted and functional derivatives are analytically calculated. This is different to real finite element codes where such inversions and derivates are numerically determined.
The following sections summarise briefly the continuum mechanical description of elasto-plastic behaviour. Section 2 introduces the integration of the elasto-plastic constitutive equation based on so-called predictor corrector schemes. It is important to highlight here that the concept is introduced as in the general three-dimensional case but on the level of one-dimensional stress and strain states. This formalism is of course not required if someone is only interested in the solution of the problem. For a given strain state, the engineering stress-strain diagram allows to conclude to the acting stress state and vice versa. However, the main idea of the approach is to provide the basis for an easy understanding of the more complicated three-dimensional case. Numerical examples are presented in section 3. These examples can be programmed and the results can be traced in stress-strain coordinate system.
Under the classical assumptions of small strains and linear relationship between the second-order strain tensor εij and the stress tensor σij, the elastic strain-stress relation is given by the generalised Hooke‟s law

Where E is Young’s modulus, Cijkl the fourth-order elastic compliance tensor and ν is Poisson’s ratio. The symbol δij represents the Kronecker tensor (δij is equal to 1 if i = j, and 0 if i ≠ j). In a pure uniaxial stress and strain state, this relationship is simplified to the one-dimensional Hooke’s law in the form

The three essential ingredients of plastic analysis are the yield criterion, the flow rule and the hardening rule Armen [9]. The yield criterion relates the state of stress to the onset of yielding. The flow rule relates the state of stress σij to the corresponding increments of plastic strain  when an increment of plastic flow occurs. The hardening rule describes how the yield criterion is modified by straining beyond initial yield. The yield criterion for an isotropic material can generally be expressed in the case of combined hardening as

Where κ is the isotropic hardening parameter and αij are the kinematic hardening parameters (so-called back-stress tensor), respectively. The elastic relation (1) prevails while F < 0. When the stresses are such that F = 0, yielding begins or is already in progress. The case of F > 0 is physically not possible for rate independent materials. For a one-dimensional state, Eq. (3) reads as

The flow rule is stated in terms of a function Q, which is described in units of stress, and is called the plastic potential. With dλ a scalar called plastic multiplier, the plastic strain increments are given by

The flow rule is said to be associated if Q= F, otherwise it is nonassociated. Hardening can be modelled as isotropic (i.e. initial yield surface expands uniformly without distortion and translation as plastic flow occurs) or as kinematic (i.e. initial yield surface translates as a rigid body in the stress space, maintaining its size, shape and orientation), or in combination. The contribution of isotropic hardening is considered by the evolution of the experimentally determined flow curve (yield stress), i.e.

while the contribution of kinematic hardening can be introduced by a correction of the stress tensor as:

The internal variable which describes isotropic hardening can be the effective plastic strain,  , (so-called strain hardening; one-dimensional case:
  or the specific plasticwork, wpl, (so-called work hardening; one-dimensional case:
 ). In the case of a uniaxial state, the yield criterion (4) can be written as:

Based on this formulation, the associated flow rule can be derived as for the one-dimensional case as:

Where sgn is the signum function (sgn(+σ) = +1; sgn(-σ) = -1; sgn(0) = 0). To complete the set of equations, it is still required to state the evolution equations for the internal variables κ and α. Assuming strain hardening, the evolution equation for the isotropic hardening parameter κ can be expressed under consideration of the associated flow rule (6) for the case of combined hardening as:

It should be noted here that in the case of pure isotropic hardening, parameter α is equal to zero in Eq. (10). A common approach to model the kinematic hardening parameter α is based on and Prager‟s kinematic rule [4]. where the evolution equation is given as:

where H is the kinematic hardening modulus.
In an elastic-plastic analysis, the constitutive relationship depends on the deformation history and an incremental approach is required where the applied load is added in increments step by step. Therefore, the principal finite element equation for a one-dimensional rod element with linear shape functions (two nodes) [10, 11] can be written in the case of elastic-plastic analysis as:

Where Δui and ΔFi indicate the incremental displacements and loads, respectively. The modulus  is in the elastic range of the simulation equal to Young’s modulus E. In the plastic range, the so-called elastic-plastic modulus Eelpl(ε) must be used instead. This modulus is obtained as the slope in the plastic part of the stress-strain diagram (and should not be confused with the so-called plastic modulus Epl which is defined as the slope in a diagram yield stress over isotropic hardening variable: Epl = Epl(εpl)). Since the stiffness matrix is now a function of the nodal displacement, i.e. Ke = Ke(ue), iterative methods are usually employed to solve the system of equations given in (12).
Let us consider now in the following case of a single rod element which is fixed at node 1 (u1 = 0) and at node 2 subjected to a prescribed displacement boundary condition u. For this case, Eq. (12) is simplified to

Thus, all nodal displacements (u1 and u2) are immediately known for each step (increment) and a real “solution procedure‟ for Eq. (12) is not required. In a post-computational step (post-processing), the constant strain in the rod element can be calculated based on [10, 11].

Which can be further simplified under consideration of the boundary condition at node 1 (Δu1=1 ). The total values of displacement and strain can be obtained by summing up the incremental values given in Eq. (13) and (14). Based on the given strain increment Δε, the remaining field variables (σ, εpl, κ, α) can be updated based on the algorithms introduced in section 2.2 and 2.3.
Let us have a look on the case that a single force F2 is acting at node 2. Thus, Eq. (12) is simplified to:

Since the modulus depends now on the deformation, an iterative solution procedure is required. Applying a Newton-Raphson scheme [11] , Eq. (15) can be written in the form of a residuum as:

A Taylor series expansion of the last equation and neglecting higher order expressions result in the following statement:

Where

and the so-called tangent stiffness in the ith iteration step is given by:

Thus, Eq. (16) can be written as:

which can be finally written as:

In the elastic range, the modulus  is equal to Young’s modulus E. In the case of linear hardening, the modulus
  is in the fully plastic range is equal to E
elpl = const. The elastic plastic transition range, i.e. the range when the last pure elastic step occurred (step n) and when the simulations enters the plastic range, the following scheme (iteration index j) can be used to iteratively calculate the next step n + 1:


where for j > 0 the definition of a secant modulus is used of. (Figure 1 a). This linearisation in the form of the secant modulus implies that the nonlinear term in Eq. (19), i.e.

can be discarded from the tangent stiffness and this specific method is sometimes called the generalised Newton-Raphson method [1].
The same definition of a secant modulus can be applied if the stress-strain curve is nonlinear in the plastic range (Eelpl=Eelpl(ε)), cf. Figure 1 b). In this case, the step n is the last known state in the plastic range.
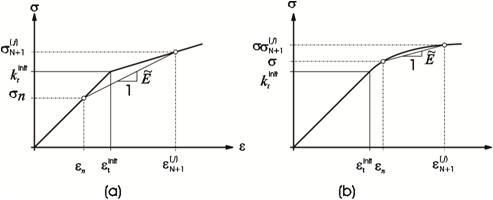
Figure 1. Definition of the average E ̃: a) Elastic-Plastic Transition Region; b) Nonlinear Plastic Regime
Compared to a pure linear-elastic finite element simulation, the computation of the plastic material behaviour can no more be performed in a single step since there is no more a unique relationship between stress and strain [1] . The load must be incrementally applied and a nonlinear system of equations has to be solved in each increment (e.g. based on a Newton-Raphson algorithm). Based on the stress state at the end of the previous increment (n) and the given strain increment Δεn, the field variables (e.g. Stress σn+1) must be calculated for each increment (n+1) at each integration point (Gauss point), cf. Figure 2.
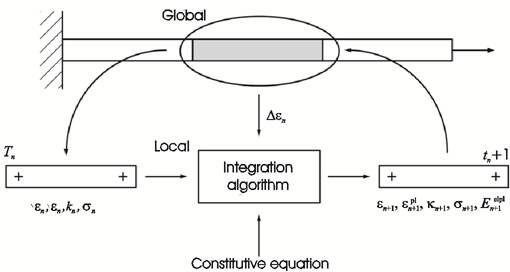
Figure 2. Schematic Representation of the Integration Algorithm for Plastic Material Behaviour in the Finite Element Method [4,14]
To this end, it is required to numerically integrate the differential form of the explicit constitutive behaviour. Explicit integration schemes, such as the forward-Euler procedure, are however inaccurate and under circumstances instable since a global error can be accumulated, Crisfield [2] . Instead of explicit integration schemes, so-called predictor-corrector algorithms (cf. Figure 3) which consists of an initial explicit elastic-predictor step, involving a deviation away from the yield surface, and a plastic-corrector step (implicit correction) returns the stress to the updated yield surface.
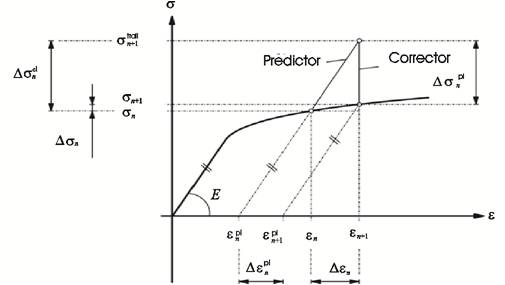
Figure 3. Schematic Representation of the Integration Algorithm in the Stress-strain Diagram [4]
Let us illustrate the general concept for the case of isotropic hardening first. Under assumption of pure linear-elastic material behaviour, the elastic predictor is used to calculate the trial state (so-called trial stress):

The corresponding hardening state corresponds to the state of the previous increment. Thus, it is assumed that the load step is pure elastic, i.e. without plastic deformation and thus, without hardening:

Dependent on the location of the trial state in the stress space, the yield condition allows to distinguish two elemental states:
• The stress is in the elastic range or on the yield surface (valid stress state, cf. Figure 3):

In this case, the trial state can be taken as the new stress and hardening state since it corresponds to the real state:


Finally, one can move to the next load increment.
•The stress state is outside the yield surface (invalid stress state, cf. Figure 3)

In this case, the second part of the algorithm calculates from the invalid state a valid state on the yield surface (F (σn+1, κn+1)=0 ). The required stress difference

is called the plastic corrector.
Alternative expressions for the predictor corrector method are return mapping or catching-up. In the following, lets have a closer look on the return mapping procedure. Detailed descriptions of the general case can be found in Simo and Hughes [4]; Belytschko, Liu and Moran [5]; Crisfield [2,3]; de Souza Neto, Perić and Owen [7].
The difference between the initial and target state (stress increment)

results according to Hooke‟s law from the elastic part of the strain increment which can be obtained as the difference between the total strain increment and the plastic part as:

The total strain increment can be expressed with the trial stress state according to Figure 3 as:

Introducing the last equation and the flow rule according to Eq. (9) into Eq. (33), the final state can be obtained in dependence of the trial stress state  as:
as:

Depending on the point for the evaluation of the function sgn(σ), different methods can be obtained to calculate the initial value for the plastic corrector and to iteratively determine the final state. To obtain the initial value for the plastic corrector, sgn(σ) can be either evaluated in the trial stress state (Backward-Euler) or on the yield surface (Forward-Euler; for the transition from the elastic to the plastic range, this is the initial yield stress). Evaluating the function sgn(σ) during the iteration in the final state ensures that the normal rule is fulfiled in the final state. For this implicit Backward-Euler algorithm (also known a Closest-Point-Projection (CPP)), Simo and Hughes [4], it is required to calculate higher order derivatives in the general three-dimensional case. For the so-called cutting plane algorithm, Simo and Oritz [12], the function sgn(σ) is evaluated for the stress state of the ith iteration step. The function sgn(σ) is for the midpoint rule in both states, i.e. the final state and on the yield surface, evaluated and equally weighted. The evaluation of the sgn(σ) only on the yield surface yields the semi-implicit Backward-Euler algorithm, Moran, Ortiz and Shih [13], which requires only the determination of first order derivatives. The different approaches are summarized in Table 1. Considering the dependency of the yield condition on the hardening variable, requires the application of a further equation to describe the hardening. The following incremental relationships for the determination of the hardening variable can be obtained from the evolution equation (10):

Finally, it should be noted that three of the integration procedures given in Table 1 can be summarised based on the following equation:

Where parameter η takes the values of 1, 0 or 0.5.
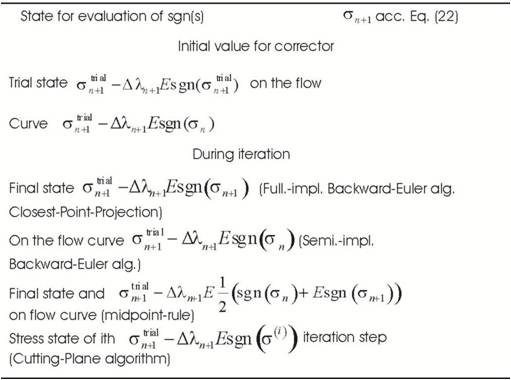
Table 1. Summary of Predictor-Corrector Algorithms [15]
This return mapping algorithm calculates the closest point projection of the trial state onto the yield surface in the complementary energy. It is not as one could assume the calculation of the geometrical closest point. The basis of this procedure is the assumption that the plastic work takes its maximum for a given strain state. Together with the elemental request that the final stress state must be located on the yield surface, the return mapping algorithm can be understood as the solution of a optimisation problem (maximum of plastic work) under a convex constraint (final stress state must be on the yield surface) [4]. The procedure is implicit for the calculation of the function sgn(σ) since the evaluation is performed for the final state n + 1. Closest Point Projection (CPP) or fully implicit Backward Euler algorithm are common expressions for this stress update procedure. In the final state (n + 1), the equations
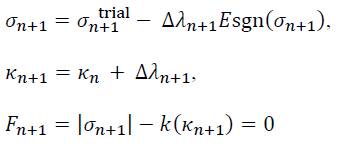
are fulfilled. However, a residuum r remains for each of these equations outside the final state:

Thus, the final stress and hardening state is the root of a vector function m which is composed of the residual functions. Furthermore, it is useful to collect all variables in a single variable vector ν:

The root is found by a Newton iteration (iteration index: i) [4]:

Where

can be used as an initial value. The Jacobian matrix  of the residual functions is obtained from the partial derivatives of Eqs. (39) as:

In addition to the fulfillment of the plasticity equations (38)1 to (38)3 in each integration point, the global equilibrium must be fulfilled. To be able to apply the Newton iteration for this task, it is required even for small strains in the general three-dimensional case to derive the appropriate elasto-plastic tangent modulus, P. Wriggers [14]. The consistent elasto-plastic modulus results for the one-dimensional case as:

The inversion of the Jacobian matrix 
which has to be evaluated in the converged state of the above mentioned Newton iteration gives:

For the special case of linear isotropic hardening, we have 
= Epl = const. where Epl is the kinematic hardening modulus.
As an alternative solution approach, the constitutive relations can be combined to obtain a single nonlinear equation to solve this problem. To this end, let us introduce the equation for the stress update (38)1 and the update of the internal variable according to Eq. (38)2 in the yield condition (38)3 to obtain:

It should be noted here that in the derivation of the last equation the fact was used that the updated and trial stress are co-linear: sgn(σn+1) = sgn
. Equation (45) can be expressed for arbitrary Δλ in the form of a residuum rF as:

A Taylor series expression of first order, i.e.

With δ(Δλ)=Δλ(i+1)-Δλ(i)gives finally the numerical scheme to solve this equation:

In the last equation, the following two relationships can be applied:

and

where the following simplification can be applied:

In the case of kinematic hardening, the system of residual equations reads as:

which can be arranged in vector in a similar way to Eq. (40) as

Where the initial value of ν can be taken as:

To apply the Newton scheme given in Eq. (41), the Jacobian matrix  of the residual functions can be calculated as
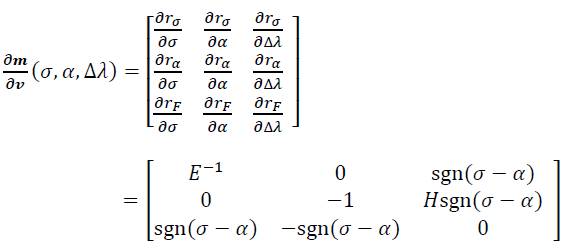
and the inverse is finally given in symbolic notation by:
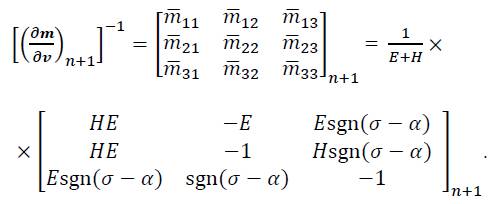
The case of combined hardening, i.e. a simultaneous consideration of isotropic and kinematic hardening, requires the combination of the two set of equations given in (39) and (53). The resulting four residual equations are given by:
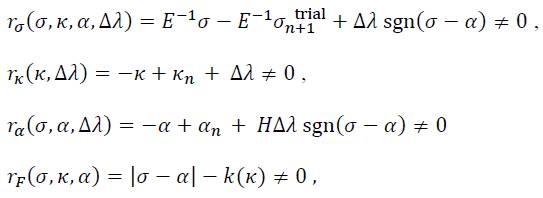
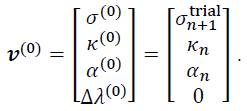
The same vector notation as in Eq. (40) or (54) can be introduced which gives the following 4-component vector function

with initial values of:
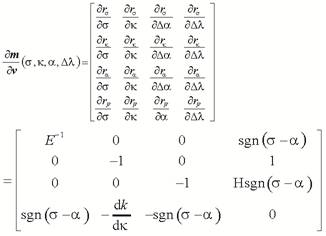
The Jacobian matrix is now given by the following 4 X 4 matrix
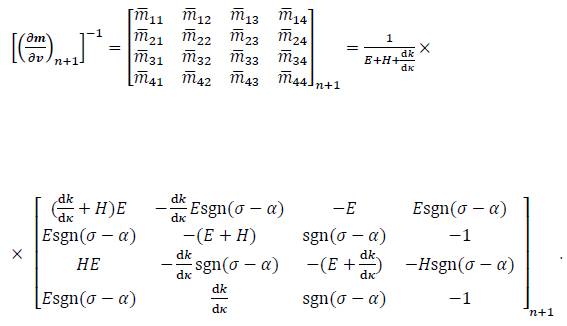
which can be still symbolically inverted to obtain:
Let us consider in the following an idealised tensile test to illustrate the derived numerical schemes. The schematic representation of the problem is shown in Figure 4 where the geometric dimensions of the unloaded and loaded specimen are shown. In addition, the common boundary conditions, i.e. force boundary condition (F) and displacement boundary condition (u) are indicated.
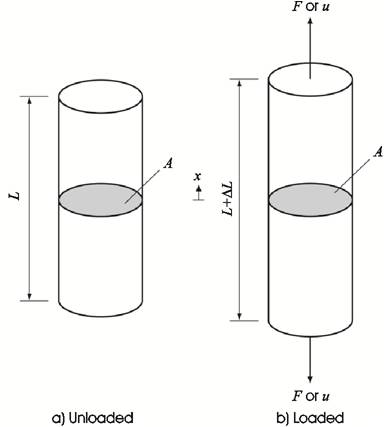
Figure 4. Schematic Representation of a Unloaded and Loaded Ideal Tensile Specimen
It is important to remind that an idealised tensile sample is assumed where the specimen deforms only in its longitudinal direction (i.e. the x-direction as shown in Figure 4) and does not show any contraction perpendicular to the loading direction. Such a problem can be solved based on the rod element which is described in section 2.1.
Let us first consider the case of linear isotropic hardening (cf. section 2.3.1) under different types of boundary conditions. The implemented material parameters are summarised in Table 2.

Table 2. Material Parameters Used for the Simulation [7]
The effect of different boundary conditions, cf. Figure 5, on the stress strain diagram is illustrated in Figure 6. Figure 6 a) shows the case of a symmetric displacement boundary condition (cf. Figure 5 a) with |umax| = |umin| = 0.008 m. As can be seen, the absolute value of the stress is increasing in the plastic range and after an entire cycle, the stresses for example in the first quadrant are higher than in the initial loading. The symmetric boundary conditions causes that the stress strain cycling is bounded by the same absolute strain value on the positive and negative strain axis. Figure 6 b) shows the results of a slightly different displacement boundary condition (cf. Figure 5 a) with umax = 0.008 m and umin = -0.0031 m. The negative displacement value with |umax| > |umin| was chosen in such a way that the stress cycle passes through the origin of the stress-strain diagram, i.e. the plastic strain is zero in this part of the diagram. Figure 6 c) considers the case of a force boundary condition (cf. Figure 5 c) with Fmax = 4450 N and Fmin = -6190 N which was chosen in such a way that the same maximum and minimum strain is obtained as in case a). Since the load increment for each step is constant (ΔF = const.), fewer data points (each point is represented by a small circle) are calculated in the plastic loading range. Figure 6 d) shows the case of a force boundary condition with Fmax = 4450 N and Fmin = -5400 N which was chosen in such a way that the stress cycle passes through the origin of the stress-strain diagram, i.e. no plastic strain in this part of the diagram.
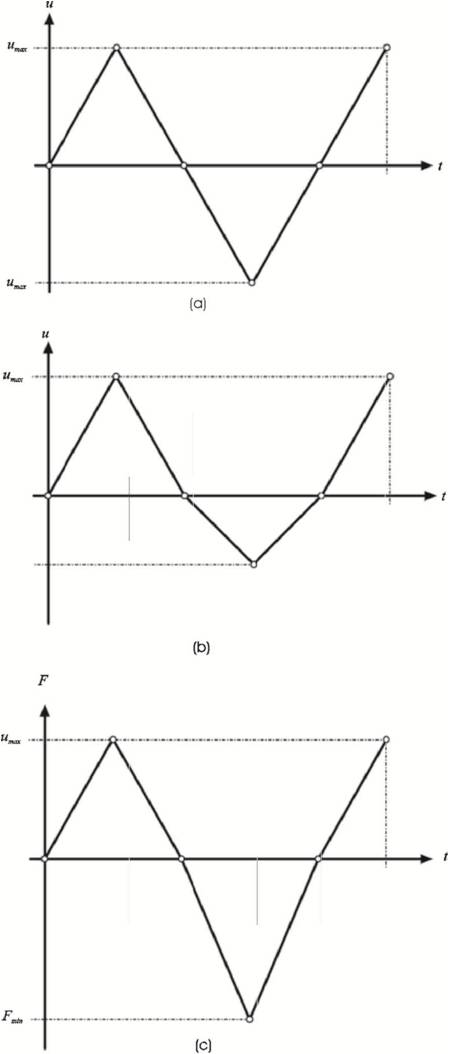
Figure 5. Definition of the Different Boundary Conditions: a) Displacement umin = -umax; b) Displacement | umin | < umax; c) Force | Fmin | > Fmax
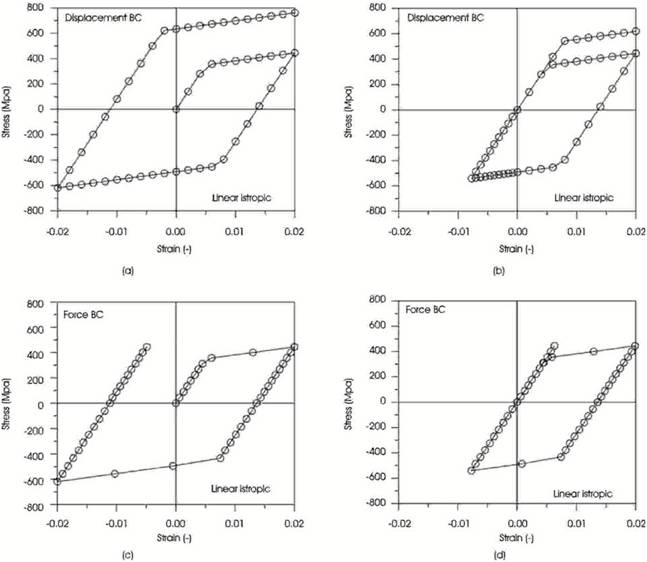
Figure 6. Stress-Strain Diagrams for the Case of Linear Isotropic Hardening
Let us consider in the following the case of ideal plasticity which can be described based on the theory of isotropic hardening with a constant yield stress of k = 350 MPa, cf. Eq. (6). Imposing the same displacement boundary conditions as in case a), a stress-strain diagram as shown in Figure 7 a) is obtained where the cycle is bounded on the strain side by the same absolute value and on the stress side by the values of ±k. It should be noted here that the case of ideal plasticity with a force boundary condition fails in the plastic range since there is no more unique relationship between the given loading and the strain. Figure 7 b) illustrates the case of nonlinear isotropic hardening with a displacement boundary condition as in Figure 6 a). Compared to Figure 6 a), a similar stress-strain behaviour is obtained except the fact that the stress in the hardening range is nonlinearly increasing. Figure 7 c) shows the case of nonlinear isotropic hardening with the same force boundary condition as in Figure 6 c). Due to the definition of the nonlinear hardening curve, the maximum stress in the first quadrant is reached at a lower strain compared to the case shown in Figure 6 c).
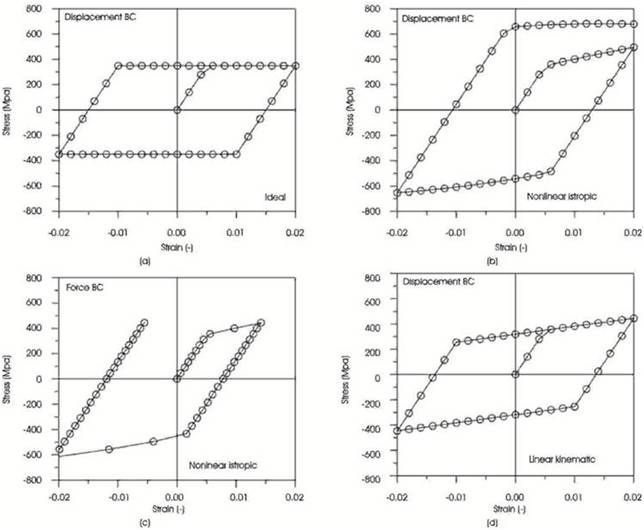
Figure 7. Stress Strain Diagrams for the Cases of a) Ideal Plasticity; b) – c) Nonlinear Isotropic Hardening; d) Linear Kinematic Hardening
The case of linear kinematic hardening (cf. Section 2.3.2) is shown in Figure 7 d) for a displacement boundary condition as in Figure 6 a). Since the linear kinematic hardening modulus H was equal to the linear isotropic hardening modulus Epl of Figure 6 a), the stress-strain values for the first cycle in the first quadrant are identical for the case of Figure 6 a) and Figure 7 d) and only in the compressive plastic regime a deviation between these two cases starts to develop.
The case of combined hardening (cf. section 3.3.3) is shown in Figure 8 where the same isplacement boundary condition as in Figure 7 a) was assigned to both cases. Figure 8 a) illustrates the case linear combined hardening while Figure 8 b) illustrates the case of nonlinear combined hardening. Under the chosen parameters, quite similar stress strain diagrams are obtained.
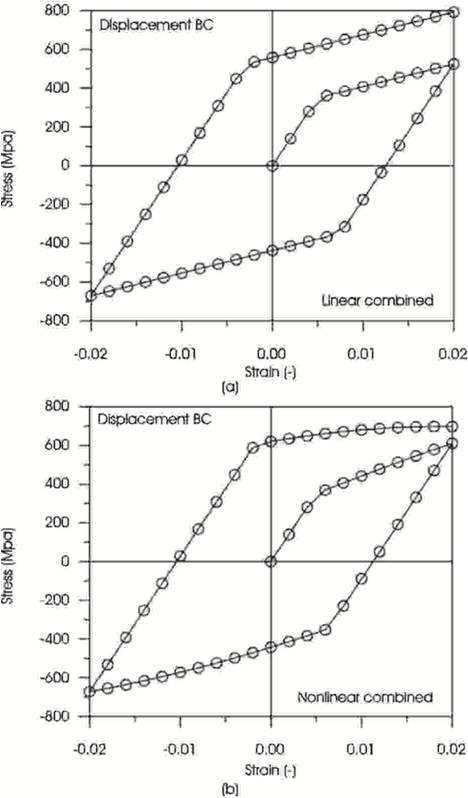
Figure 8. Stress Strain Diagrams for the Cases of a) Linear Combined Hardening; b) Nonlinear Combined Hardening
The evolution of the internal hardening variables, i.e. κ and a, is illustrated in Figure 9 for the cases of linear hardening. Figure 9 a) is given for isotropic hardening in the case of a force boundary condition (case as Figure 6 c) and shows the evolution of k and for comparison the evolution of the plastic strain. As can be seen, the internal isotropic hardening variable (dκ = |dεpl|) is a variable which can only increase while the plastic strain can decrease and increase during a cycle.
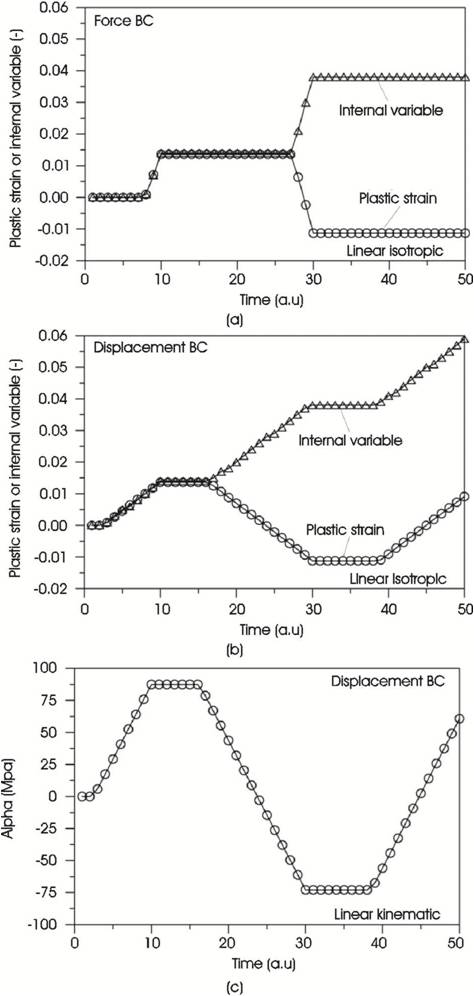
Figure 9. Evolution of Plastic Strain and Internal Variable for a) Linear Isotropic Hardening with force Boundary Condition; b) Linear Isotropic Hardening with Displacement Boundary Condition; c) linear Kinematic Hardening With Displacement Boundary Condition
This is the reason why κ is taken as the internal variable and not εpl. The plastic strain for example can take during cyclic loading several times a value of zero while κ never “forgets” its history. Figure 9 b) shows the case for the displacement boundary condition which corresponds to Figure 6a). The evolution of the kinematic hardening variable (dα=Hdεpl ) is presented in Figure 9 c) for the case of linear kinematic hardening under a displacement boundary condition. This result corresponds to Figure 7 d). As can be seen, the kinematic hardening variable can change its sign as in the case of the plastic strain.
As described in section 2.1, the transition between the elastic and plastic range (cf. Figure 1) in the case of a force boundary condition needs some cycling in order to determine the final value of the secant modulus as given in Eq. (23). This evaluation of the modulus is shown in Figure 10 for the case of linear isotropic hardening and a force boundary condition (the corresponding stress-strain diagram is shown in Figure 6 c). Figure 10 a) illustrates the situation in the first quadrant of the stress strain diagram, i.e. the transition between the elastic and the plastic part in the tensile regime. Figure 10 b) illustrates a similar situation but now in the fourth quadrant of the stress strain diagram, i.e. in the tensile regime. As can be seen for both cases, convergence is achieved after few cycles.
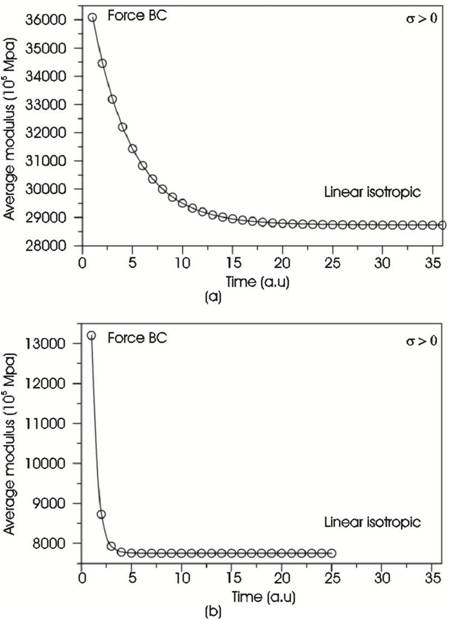
Figure 10. Evolution of the Average Modulus E ̃: a) Tensile Region; b) Compressive Region
The principal ingredients of classical plasticity theory as applied in finite element codes were introduced based on one-dimensional stress and strain states. This is a simplifying and idealised case but all the components of the plastic constitutive description can be introduced. In the general three dimensional case the same equations are required (i.e. a yield condition, a flow rule and a hardening rule) and only the mathematical description becomes more complicated. However, the conceptual approach remains the same.
The integration scheme for the constitutive equations was based on the predictor corrector concept which is used in the three dimensional case. If one is interested in the simple solution of the problem, there is no need for a predictor corrector concept for one-dimensional state since the stress strain curve gives normally the unique relation between stress and strain and one can determine immediately the stress if the strain is given or vice versa. However, the basic idea was to introduce the integration procedure as in the general case but explained on the idealised case of a one dimensional stress and strain state. This approach reveals the advantage that all the steps can be easily understood and traced in the classical stress strain diagram and the solution procedure can be easily realised by simple codes or by the application of commercial computer algebra systems.
The principal features and procedure of the presented schemes do not change in the general three dimensional case. Again, only the mathematical notation must be adopted. Furthermore, any addition of a further internal variable (for example a scalar damage variable) results only in the addition of a further equation which increases the size of the final systems of equations by one.
It is believed that this one-dimensional approach facilitates the understanding of the three dimensional case and that the implementation of the presented schemes should be a good preparatory work for the handling of elasto-plastic problems in finite element codes.