Table 1. Process Parameters, Symbols and their Ranges
Wire electric discharge machine (WEDM) is a non conventional machining method to cut hard to machine material with the help of a wire electrode. High strength low alloy steel (HSLA) is a hard alloy with high hardness and wear resisting property. The purpose of this study is to investigate the effect of parameters on cutting rate for WEDM using HSLA as workpiece and brass wire as electrode. HSLA used in cars, trucks, cranes, bridges, roller coasters and other structures that are designed to handle large amounts of stress. It is seen that cutting rate increases with increase in pulse on time and peak current. Cutting rate decreases with increase in pulse off time and servo voltage. Wire mechanical tension has no significant effect on cutting rate. In order to evaluate the effect of selected process parameters, the Response Surface Methodology (RSM) is used to formulate a mathematical model which correlates the independent process parameters with the desired cutting rate. The central composite rotatable design has been used to conduct the experiments. The analysis of results indicates that the pulse on time, pulse off time, servo voltage and peak current have a significant effect on cutting rate.
Wire cut Electrical-discharge machining (WEDM) has been an important manufacturing process for the tool, mould, and die industries. It is now increasingly used owing to its ability to produce geometrically complex shapes, as well as its ability to machine hard materials that are extremely difficult to machine using conventional processes. WEDM has capability to machine any kind of electrically conductive work in the present day. The mechanism of WEDM constitutes the erosion of material due to discrete spark discharge between wire tool and job immersed in a liquid dielectric medium. Very high frequency pulses are generated with the help of DC power supply. The electrical discharge melts or erodes the material in a very small amount which is flushed away by dielectric. The work piece and wire electrode are separated by deionised water. The deionized water works as dielectric fluid and flushes out the eroded or melted material. WEDM is rarely able to achieve optimal performance due to large number of variables and their stochastic nature. This problem can be solved by determining the relationship between performance of the process and its input parameters using designed experiments.
In 1991 Scott, Boyina and Rajurkar [1] used a factorial-design method to determine the optimal combination of control parameters in WEDM, the measures of machining performance being the metal removal rate and surface finish. Based on the analysis of variance, it was found that discharge current, pulse duration and pulse frequency are significant control factors for both the metal removal rate and the surface roughness. Some industries like aerospace, automotive and electronic have used this process in their production line to improve wear resistance and dimentional stability of components [2]. Manna and Bhattacharyya [3] found open gap voltage and pulse on period as the most significant machining parameters for controlling the metal removal rate using Taguchi method-based analysis for WEDM on Al/SiCMMC. Newman et al. [4] found that WEDM is a specialized thermal machining process capable of accurately machining parts with varying hardness or complex shapes Rajurkar and Wang (1993) [5] analyzed the wire rupture phenomena with a thermal model. An extensive experimental investigation has been carried out to determine the variation of machining performance outputs, namely MRR and surface finish, with machining parameters in the study. Tarng, Ma and Chung (1995) used [6] a neural network system to determine settings of pulse duration, pulse interval, peak current, open circuit voltage, servo reference voltage, electric capacitance and table speed for the estimation of cutting speed and surface finish. Liao et al. [7] proposed an approach of determining the parameter settings based on the Taguchi quality design method and the analysis of variance. The results showed that the MRR and SF are easily influenced by the table feed rate and pulse on-time, which can also be used to control the discharging frequency for the prevention of wire breakage.
In 2005 Albert J. Shih et al. [8] investigated the Effects of WEDM process parameters, particularly the spark cycle time and spark on-time on thin cross-section cutting of Nd–Fe–B magnetic material, carbon bipolar plate, and titanium. The micro EDM has been studied extensively by Masuzawa and his research group in the past two decades [9-11]. In addition, Luo [12] investigated the EDM with a small erosion area by examining effects of spark off time. Takahata and Gianchandani [13] studied the use of electrode arrays for batch EDM generation of micro-features. Scott et al [14] used a factorial design requiring a number of experiments to determine the most favourable combination of the WEDM parameters. They found that the discharge current, pulse duration and pulse frequency are the significant control factors affecting the MRR and SF, while the wire speed, wire tension and dielectric flow rate have the least. In 2005 Taweel et al. [15] highlights the development of mathematical models for correlating the inter-relationships of various WEDM machining parameters of Inconel 601 material such as: peak current, duty factor, wire tension and water pressure on the metal removal rate, wear ratio and surface roughness.
Till now there is no work carried out using HSLA as a die material. As it is hard, wear resistant corrosion resistant, so HSLA is choose as a workpiece for experimentation. To evaluate the effects of machining parameters on performance characteristics, and to identify the optimal performance characteristics under the best settings of machining parameters, a specially designed experimental procedure called Response Surface Methodology has been used.
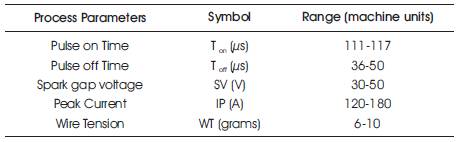
Based on the findings of the many researchers, process parameters for WEDM process based on the quality of the machining are grouped in various categories. The process parameters, their designated symbols and range are given in Table 1.
The range of all the process parameters is selected for the present study based on the results obtained from preliminary experiments.
Table 1. Process Parameters, Symbols and their Ranges
The experimental studies were performed using a Electronica Sprintcut 734 wire cut EDM machine as shown in Figure 1. During the experiments the cutting of the work piece was done. The work material, electrode and the other machining condition are as follows:
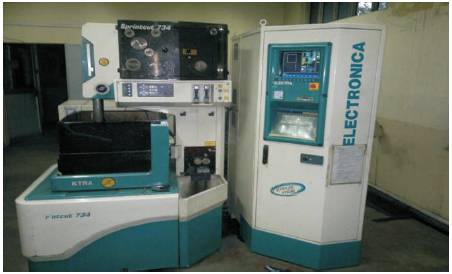
Figure 1. WEDM Machine Tool
For the present work, RSM has been applied for developing the mathematical models in the form of multiple regression equations for the quality characteristics of WEDM process. In applying the response surface methodology, the dependent parameter was viewed as a surface to which a mathematical model is fitted. For the development of regression equations related to various quality characteristics of WEDM process, the second order response surface has been assumed as:
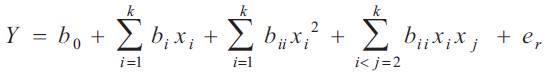
This assumed surface Y contains linear, squared and cross product terms of parameters xi's. In order to estimate the regression coefficients, a number of experimental design techniques are available. Box and Hunter [16] have proposed a scheme, based on central composite rotatable design, which fits the second order response surfaces very accurately. Also no replication is needed to find error mean square. The error mean square can be found out by replicating the centre points.
The 32 experiments were conducted according to the central composite second order rotatable design for investigating cutting rate (CR). The experimental data along with the experimental design matrix are given in Table 2.
For analyzing the data, the checking of goodness of fit of the model is very much required. The model adequacy checking includes test for significance of the regression model, test for significance on model coefficients and test for lack of fit. For this purpose, analysis of variance (ANOVA) is performed.
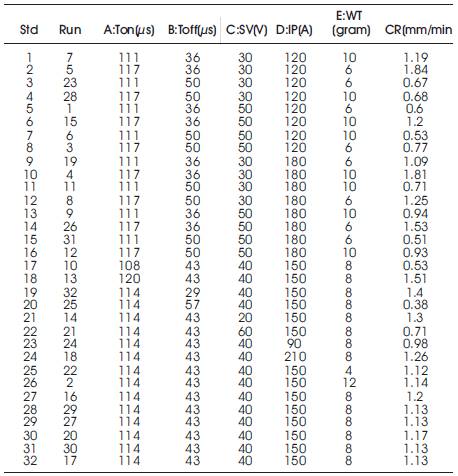
Table 2. Design of experiment
The fit summary recommended that the quadratic model is statistically significant for analysis of CR. The pooled ANOVA for CR is given in Table 3. From the pooled ANOVA analysis, the value of R2 and adjusted R2 is over 95%. This means that regression model provides an excellent explanation of the relationship between the independent variables (factors) and the response cutting rate. The associated p-value for the model is lower than 0.05 which indicates that the model is considered to be statistically significant. The lack-of-fit term is non significant as it is desired. Further A-Pulse on time, B-Pulse off time, C-Servo Voltage, D- Peak current, E-Wire Mechanical Tension. Interaction between pulse on time and pulse off time, pulse on time and peak current, pulse on time and wire mechanical tension, pulse off time and servo voltage, pulse off time and wire mechanical tension, servo voltage and peak current, servo voltage and wire mechanical tension, peak current and wire mechanical tension also the second order factors having significant effect. The other model terms are said to be insignificant. To fit the quadratic model for cutting rate appropriate, the insignificant terms are eliminated by backward elimination process.
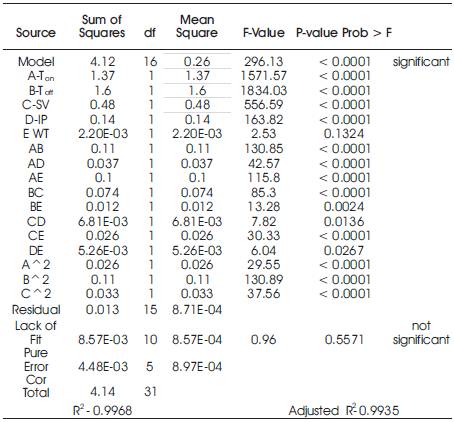
Table 3. Pooled Anova after Pooling Insignificant Terms
The reduced model results indicate that the model is significant (R2 and adjusted R2 are 99.68% and 99.35% respectively), lack of fit is non significant as p value is 0.5571 (and significant value is less than 0.05), Figure 2 displays the normal probability plot of the residuals for CR. It is noticed that the residuals are falling on a straight line, which means that the errors are normally distributed. Further, each observed value is compared with the predicted value calculated from the model in Figure 3. It can be seen that the regression model is fairly well fitted with the observed values. After eliminating the non-significant terms, the final response equation for CR is given as follows:
Cutting rate=-71.66013+1.02336*Ton+0.50630*Toff-0.056081*SV-0.063556*IP+1.45932*WT-4.01786E-003*Ton*Toff+5.34722E-004*Ton*IP-0.013229* Ton*WT+ 9.73214E-004*Toff*SV-1.91964E-003*Toff*WT +6.87500E-005*SV*IP+2.03125E-003*SV*WT+3.02083E-004*IP*WT-3.26923E-003*Ton2-1.26374E-003*Toff2-3.31731E-004*SV2.
Figure 4a shows the interaction plot of pulse on time and pulse off time on cutting rate of the machined components at different levels. It is evident from the plot that cutting rate attains a peak value of 1.6347mm/min at higher value of Ton(117) and lower value of Toff(36). Large pulse duration leads to higher electrical discharge energy resulting in thicker surface oxidation which results a higher cutting rate. Figure 4(b) shows interaction plot of Ton and SV for CR. It is clear from the figure that with the increase in SV (50), the CR follows a decreasing trend and attains a value 0.7060mm/min. This is due to the reason that at higher value of SV, the current is low and at lower value of current heat generated is also low. This less value of heat generated decrease the cutting rate.
Figure 4(c) shows the interaction plot of Ton and IP. It is evident that with the increase in peak current cutting rate increases. The higher is the peak current setting, the larger is the discharge energy. This leads to increase in cutting rate. The effect of Ton is already explained. Figure 4(d) shows the interaction plot of Ton and WT. With the decrease in WT the CR decreases. At low wire tension the wire near the cutting zone may become slack and may produce unintentional wire deflection from its path. Due to this the location of impingement of spark may become uneven i.e. each succeeding spark may be cutting a portion of work piece already cut by the proceeding spark [17] . The effect of Ton is already cited. Figure 4(e) shows the interaction plot of Toff and SV. With the increase in Toff and SV the CR decreases. Pulse off time is the time between two suceesive spark. If pulse off time is more it means that the time between two sucessive spark is increased, which decreaes the duration of current supply and also decrease the discharge energy. Hence cutting rate decreases with increase of pulse off time. The effect of SV is discussed in the above paragraph. Higher value of IP and lower value of Toff is favourable for better productivity i.e. cutting rate Figure 4(f). The Main effect of control factor also follow the same trend as follows by the 3D interaction plot, which are shown in Figure 5. Some of the specimens of experimentations are shown in Figure 6.
Table 4 shows the confirmation test at various selected parameters settings at which cutting rate maximizes. Values of process parameters are rounded off due to limitation of machine setting. Error between the experimental and predicted values for CR lies within -3.53 % to 4.67%. So, this confirms excellent reproducibility of the experimental conclusions.
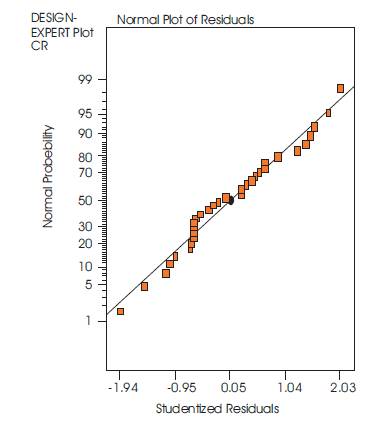
Figure 2. Normal Probability Plot of residuals For CR
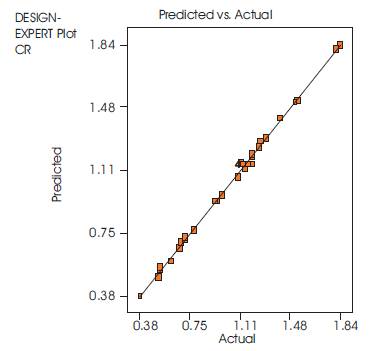
Figure 3. Plot of actual v/s pred. response of CR
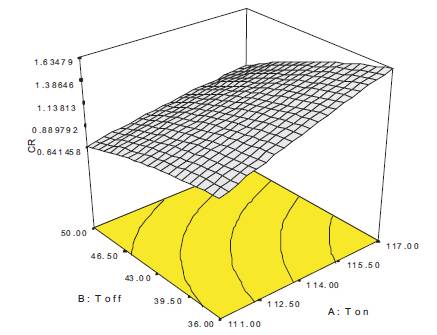
Figure 4(a). 3D Interaction Plot for CR(Ton & Toff)
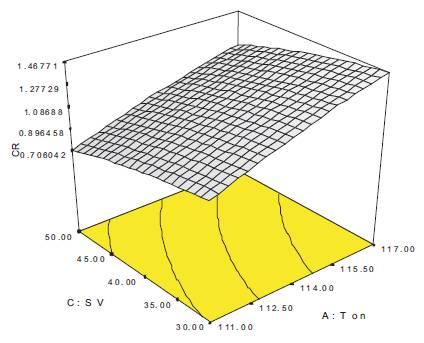
Figure 4(b). 3D Interaction Plot for CR (Ton & SV)
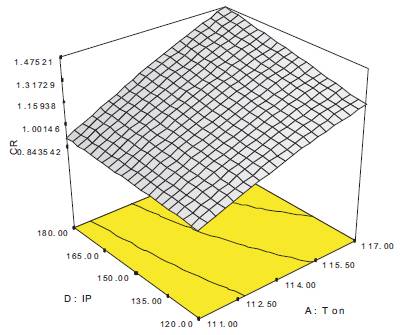
Figure 4(c). 3D Interaction Plot for CR(Ton & IP)
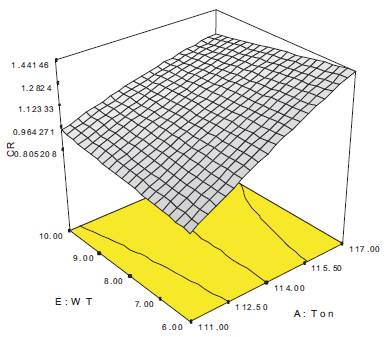
Figure 4(d). 3D Interaction Plot for CR (Ton & WT)
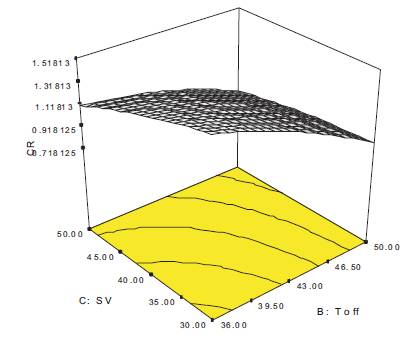
Figure 4(e). 3D Interaction Plot for CR(Toff & SV)
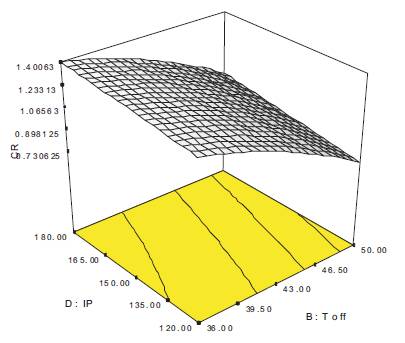
Figure 4(f).3D Interaction Plot for CR (Toff & IP)
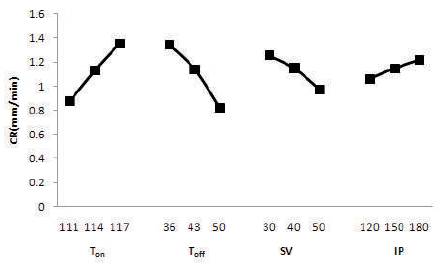
Figure 5. Main effects of control factors at three levels on cutting rate
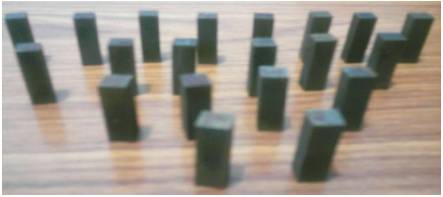
Figure 6. Some Specimens of High Strength low alloy Steel
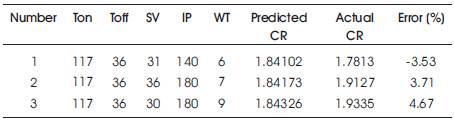
Table 4. Confirmation Test
In this paper influence of process parameters on cutting speed is investigated. The parameters and their combinations affecting the process were obtained using ANOVA. From the analysis, it is concluded that: