Discrimination between Burr Type X Distribution Versus Log - Logistic and Weibull - Exponential Distributions
M. S. Ravikumar * R. R. L. Kantam **
* Associate Professor, Department of Community Medicine, Konaseema Institute of Medical Sciences & Research Foundation/ General Hospital, Amalapuram, Andhra Pradesh, India.
** Former Professor, Department of Statistics, Acharya Nagarjuna University, Nagarjunanagar, Andhra Pradesh, India.
Abstract
The well known Burr type X distribution is considered as a null population. Log-logistic and Weibull-Exponential (Dubey - 1966) distributions are taken as alternative populations. Two test statistics based on population quantiles, Likelihood Ratio (LR) type criteria are suggested to discriminate between the considered null and alternative populations. The percentiles of the proposed test statistics are evaluated. The performance of the test procedures are compared through the respective values of computed power functions.
Keywords :
- Burr type X Distribution,
- Log-logistic Distribution,
- Weibull- Exponential Distribution,
- Order Statistics,
- Population Quantiles,
- Likelihood Ratio Type Criterion,
- Power Function
Introduction
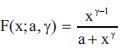
The frequency curve of Burr (1942) type X distribution for k=2 resembles the Log-Logistic Distribution (LLD) with shape parameter  , and the Weibull-Exponential Distribution (WED) with parameters
  of Dubey (1966) as shown in Figures 1 and 2. Moreover, the genesis of Burr type X may be regarded as from Weibull distribution which in a way is a generalisation to Exponential distribution. These remarks motivate us to study the discrimination between the following pairs of probability distributions (Burr type X (k=2), log-logistic distribution β=8); (Burr type X distribution (k=2), Weibull-Exponential distribution .
For a ready reference the expressions of Probability Density Function (pdf) and Cumulative Distribution Function (cdf) of the above distributions in their standard form are given below.
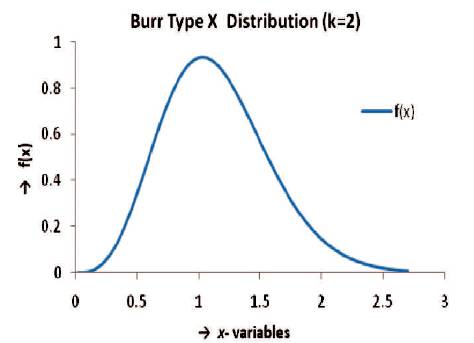
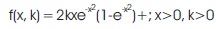
Figure 1. Parameter of Burr Type Distribution
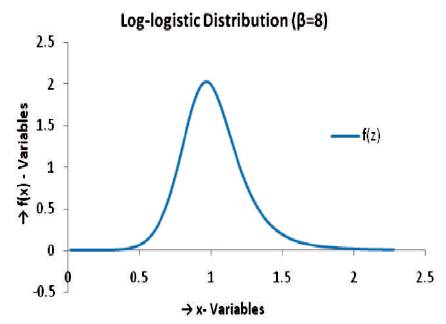
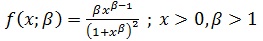
Figure 2. Parameters of Log-Logostic Distribution
Burr Type X Distribution
pdf is given by
and cdf is given by
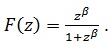
Log-Logistic Distribution
pdf is given by
and cdf is given by
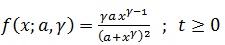
Weibull – Exponential Distribution
pdf is given by
and cdf is given by
It is known that, methods of point estimation in Burr type X distribution do not yield closed form expression as estimate of their parameter. The authors are therefore motivated to explore the possibility, if any other popular probability model be taken as an alternative to Burr type X distribution with a reasonable power of closeness between the chosen pairs of distributions. This motivation leads us to the formulation of a problem in the testing of statistical hypothesis say “A given sample of a specified size belongs to a Burr type X distribution”. In this sense Burr type X distribution becomes a null population for the sample under consideration with another suitable alternative. The procedure of identifying the given sample with Burr type X distribution or an alternative distribution with small risks and reasonably larger powers will be discussed in this paper. Such studies based on Likelihood Ratio (LR) type criteria are made by many researchers with respect to other standard reliability models that include Gupta et al. (2002), Gupta and Kundu (2003a), Gupta and Kundu (2003b), Kundu and Manglick (2005), Kundu, et al. (2005), Kundu(2005), Gupta and Kundu (2006), Kundu and Raqab (2007), Dey and Kundu(2009a), Dey and Kundu (2009b), Dey and Kundu (2012a), Dey and Kundu (2012b) and the references therein. Also, Sultan (2007), Srinivasa Rao and Kantam (2013), Srinivasa Rao and Kantam (2012), Kantam et al. (2014) are the articles in which similar hypotheses are tested based on test criteria using moments of order statistics and population quantiles.
In this paper the authors adopt both the approaches, namely population quantiles and LR type criterion. Precisely they suggest the two test criteria to identify whether a given sample has come from Burr type X distribution against the alternative models chosen as log-logistic distribution, Weibull - Exponential distribution. They name the first criterion as quantile based approach and second as likelihood ratio type approach. For a ready reference we describe these two approaches in general in Section 1. The quantile based approach is adapted to our chosen null and alternative populations to get the critical values and power of the test in Section 2. The likelihood ratio type criterion for the chosen null and alternative populations is applied to get the critical values and power values in Section 4. A comparative study of the proposed test criteria in the case of the respective chosen null and alternative populations is presented in Section – 4 and conclusion is given in Section 5.
1. Discrimination between Distributions - Quantile Based / Likelihood Ratio Type Approach
1.1 Quantile Based Approach
Let P0 , P1 denote two probability distributions of continuous type to be regarded as null, alternative populations, respectively. Let x(1) , x(2) ,... x(n) be an ordered random sample of size 'n' (ordering is mandatory as the method indicates). We want to test the null hypothesis
H0 : The sample has come from the population P0 against the alternative hypothesis.
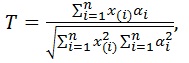
H1 : The sample has come from the population P1 . Sultan (2007) suggested a test statistic given by the formula,
where X(i) - ith ordered observation in the sample.
αi- the expected value of ith standard order statistic in a sample of size n from the null population.
If x(1) , x(2) ,.... x(n) is truly a sample from the null population the formula for 'T' would serve as a test statistic to discriminate a null (1) (2) (n) population and the corresponding alternative population with the help of its critical values.
Hence, the sampling distribution of 'T' and its percentiles there from are essential to make use of the test statistic 'T'. Since the sampling distribution of 'T' involves non linear functions of order statistics it cannot be generally tractable analytically in the case of all populations, necessitating one to go for empirical sampling distributions, empirical percentiles of 'T' through simulation. Sultan (2007) did the same with generalised exponential distribution as null population.
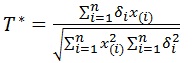
The statistic 'T' defined in equation (7) is based on moments of order statistics in samples from null population which may not always be available in all cases. This motivated Srinivasa Rao and Kantam (2013) to suggest the statistic 'T' with a replaced by i the corresponding population quantiles which are available analytically for all populations with invertible cumulative distribution functions. They further established T based on population quantiles is more powerful than that based on moments of order statistics in their selected models. We adopt the same in the present paper for Burr type X as null population, because moments of order statistics for these null population is not available either analytically or computationally for ready use.
1.2 Likelihood Ratio Type Approach
In this approach also we test the null hypothesis.
H0 : The sample has come from the population P0 against the alternative hypothesis.
H1 : The sample has come from the population P1.
The procedure is described as follows:
Let L1 denote the value of the likelihood function of the sample x(1) , x(2) ,.... x(n) with reference to the population P1 . L1 is arrived at as follows. Considering x(1) , x(2) ,.... x(n) as a sample from P1 its parameters are estimated with some method of point estimation using the P1 as the probability model. Substituting the values of the estimates so obtained and the sample observations x(1) , x(2) ,.... x(n) in L1 we get a value of L1 from the sample x(1) , x(2) ,.... x(n) with respect to P1 . Using the same sample x(1) , x(2) ,.... x(n) with P0 as the model one can get estimates of the parameters of P0 thereby getting the value of the likelihood function in relation to P0 at x(1) , x(2) ,.... x(n) and at the estimates of the parameters of P as estimated using x(1) , x(2) ,.... x(n) . L0 is thus the value of likelihood function obtained by substituting the same sample x(1) , x(2) ,.... x(n) and the estimates of parameters of P0 in it. Thus for the same sample x(1) , x(2) ,.... x(n) we get two values of likelihood function with respect to P0 and P1.
Generally in likelihood ratio test procedure, we substitute the Maximum Likelihood Estimates (MLEs) of the parameters in L1 and L0 and get the value of L1 /L0 at a given sample x(1) , x(2) ,.... x(n). Since likelihood is also joint probability of the sample x(1) , x(2) ,.... x(n) if the sample belonged to P0 the ratio L1 /L0 tends to be very small. If it is the other way, that is, the sample is truly from P1 then the ratio P1/P0 tends to be very large. In the proposed method of testing Burr type X distribution vs. log-logistic/ Weibull - Exponential and Burr type XII distribution vs. Weibull – Exponential distribution, they use point estimates of the parameters in both null and alternative populations by any other method of point estimation instead of the classical ML method because MLEs of parameters of Burr type distributions are mostly iterative in nature. Similar testing process was adopted by other researchers also ( Gupta & Kundu, 2003a ; Kundu et al., 2005). The authors therefore name their method as LR Type Criterion. Thus the critical values of the likelihood ratio type test statistic would be necessary to decide the acceptance or otherwise of the proposed null hypothesis which in turn require the percentiles of the proposed test statistic. In the present situation for chosen null and alternative populations, the likelihood ratio type criterion is adopted and its critical values and power values were evaluated in Section 3.
2. Discrimination between Burr Type X Model and Some Alternatives - Quantile Based Approach
2.1 Burr Type X as Null Population
Let x(1) , x(2) ,.... x(n) be an ordered random sample of size n. Here we test the Null hypothesis.
H0 : The sample has come from Burr type X distribution with k=2 against the two alternative hypotheses in succession.
H1 : The sample has come from log-logistic distribution with
H1 : The sample has come from Weibull - Exponential distribution with . 1
A statistic proposed similar to 'T ' based on population quantiles as,
where, 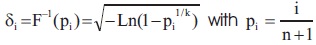
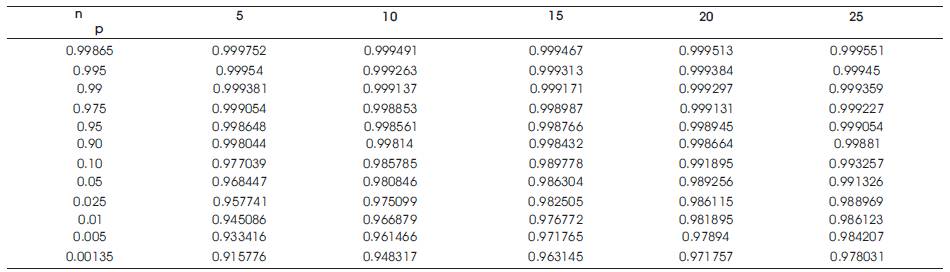
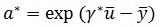
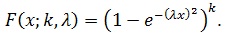
They have tabulated the percentiles of empirical sampling distributions of 'T ' for n=5(5) 25, k=2 through 10,000 Monte-Carlo simulation runs and are given in Table 1, which serve as critical values to test null hypothesis that a given sample comes from Burr type X distribution. The powers of this test statistic with log-logistic γ =8/ Weibull - Exponential as alternatives in succession are evaluated as follows:
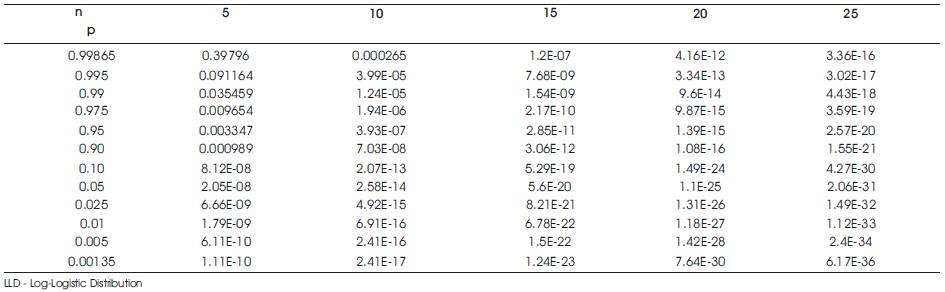
10,000 random samples of size n= 5(5) 25 from log-logistic distribution (γ=8) are generated and the values of ‘T*', are calculated at each sample. While calculating T* for each sample drawn from log-logistic distribution (γ=8) the δ's in the formula for T* are i retained as those of the null population, that is, Burr type X only. The proportions of values of 'T*', that fall above a specified percentile, say, 90th , 95th , 99th percentiles out of 10,000 samples are noted down, which represent the power of the statistic 'T*' corresponding to respective levels of significance. These are given in Table 2 for n=5(5) 25. In a similar manner, the powers of T*, when the alternative population is Weibull – Exponential are also given in Table 2.
3. Likelihood Ratio (LR) Type Criterion for Testing
Burr Type X Distribution (Single Parameter Case) as Null Population
In order to use a likelihood ratio type formula as a test statistic we should have the estimated likelihood function. As mentioned earlier, the sampling distribution of LR type test statistic is not explicitly available. Hence the authors resorted to Monte-Carlo Simulation. The methodology and the corresponding mathematical structures for both null and alternative populations are described below.
Let x(1) , x(2) ,.... x(n) be an ordered random sample of size n. Here we test the null hypothesis.
H0 : The sample has come from Burr type X distribution with k=2 against the two alternative hypotheses in succession.
H1 : The sample has come from log-logistic distribution with 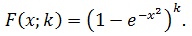 .
.
H1 : The sample has come from Weibull - Exponential distribution with .
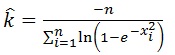
A random sample of size n is generated from a standard Burr type X distribution (P0) with parameter k=2. Using that sample the parameter k is estimated by ML method as given from the formula,
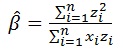
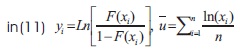
The estimate so obtained is substituted in L0 along with the sample observations used to get the estimate. Thus we have an estimated value of L0. Using the same sample we estimate the parameter β appearing in P1 the – log-logistic distribution by a regression type method given by (Srinivasa Rao and Kantam, 2012),
where  for log-logistic distribution and xi is the ith ordered sample observation in a sample of size n.
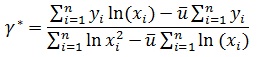
Using the same sample, they estimate the parameters a, γ appearing in P1 the - Weibull - Exponential distribution by a pseudo least squares type method and these are given by Dubey (1966).
where  with F(.) denoting the CDF of the Weibull – Exponential distribution in equation (6).
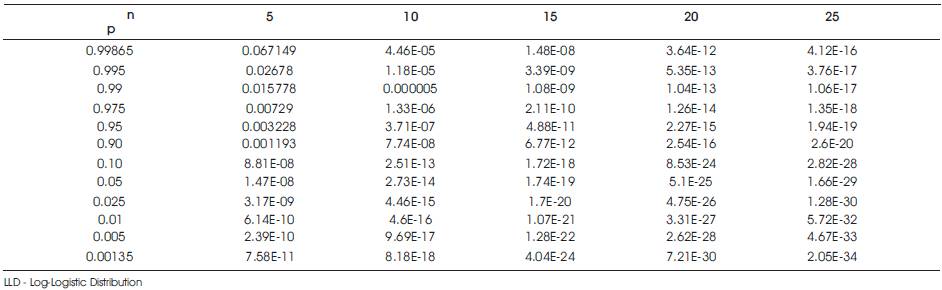
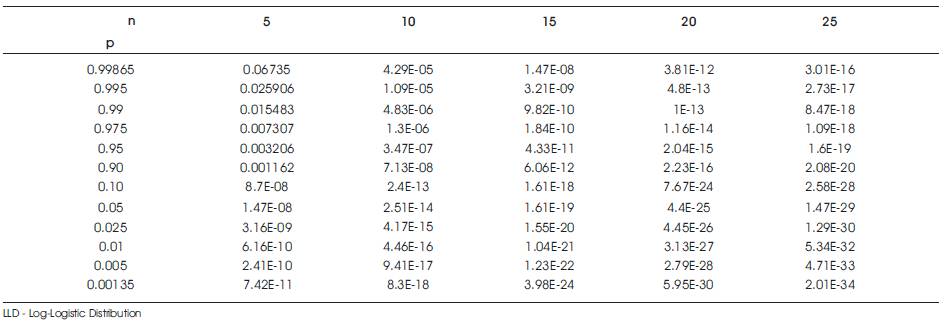
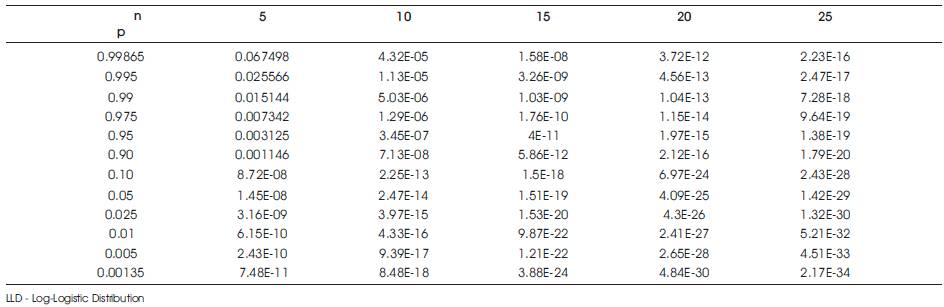
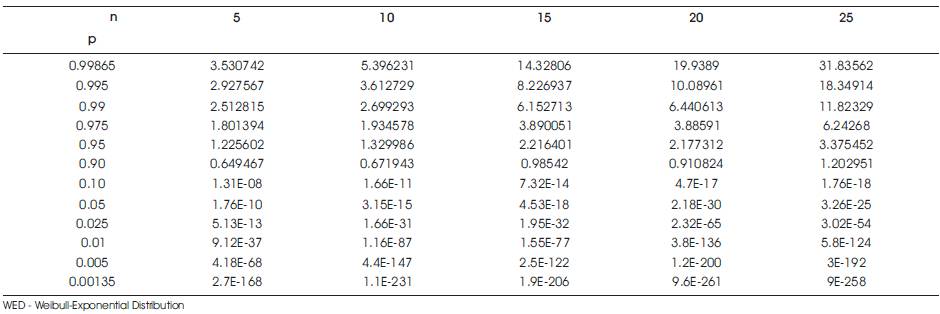
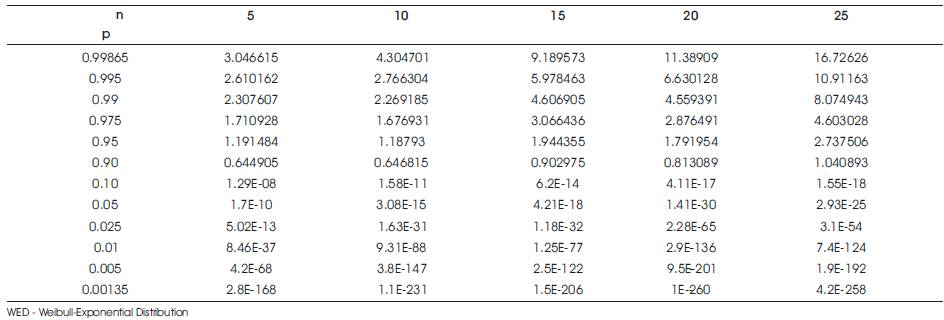
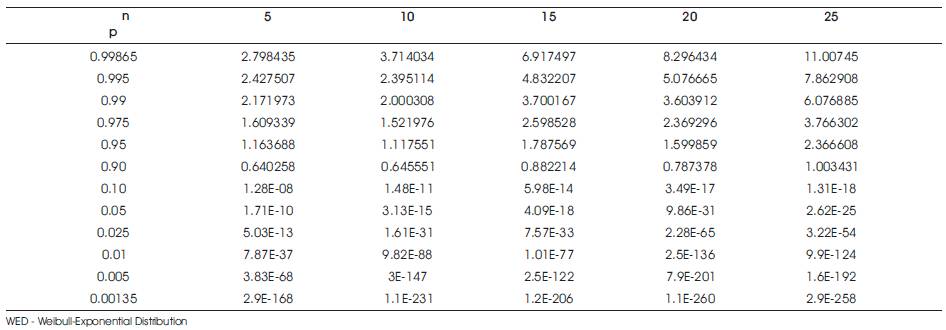
The estimates of the parameters of P1 (log-logistic/ Weibull –Exponential distributions) so obtained are then substituted in L1 along with the sample observations used to get the estimates. Thus we get estimated likelihood function L of the respective alternative populations. The ratio L1/L0 for different samples with the same parameter combinations as described above iscalculated for each sample. Thus in all, we get as many values of L1/L0 as the number of repetitions that are done, generally called the simulation runs. This procedure is repeated 10,000 times. Various specified cut off points (percentiles) of the ordered 10,000 values of L1/L0 would form the critical values of the test statistic L1/L0. These percentiles are given in Tables 3 and 4 for n=5(5) 25, for log-logistic distribution, Weibull exponential distribution as alternatives, respectively. The power of the proposed LR type criterion is evaluated as follows.
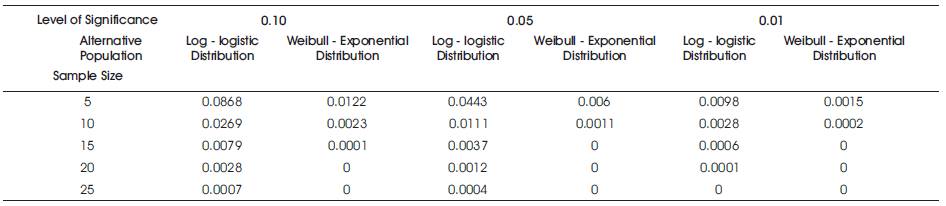
10,000 random samples of a specified size are generated from the alternative population P1 (log-logistic distribution, Weibull– Exponential distribution) and the estimation of L1/L0 as described above is evaluated. Out of these 10,000 values of L1/L0 the proportion that exceed a specified percentile of L1/L0 say 90th ,95th , 99th of Tables 3, 4 would give the power of L1/L0 at 10%, 5%, 1% levels of significance, respectively, for the chosen alternative. The powers are given in Table 5.
Burr Type X Distribution (Two Parameter Case) as Null Population
In above the parameter k of the null population is only assumed to be unknown to construct the test criterion L1/L0 . Here we consider a two parameter Burr type X distribution as null population given by the following probability density function and cumulative distribution function.
pdf is given by,
and cdf is given by ,
The authors have already proposed a two step estimation procedure for estimating the parameters λ and k along with their relative efficiencies in Section 5. They make use of those estimates of λ and k in the present LR criterion to construct the percentiles and powers of L1/L0 with a two parameter Burr type X distribution as null population and log – logistic distribution (8) and Weibull-Exponential distribution (1, 2) as alternatives in succession. Accordingly the null and alternative hypotheses are,
H0 : The given sample has come from a two parameter Burr type X distribution.
H1 : The sample has come from log-logistic distribution with β=8.
H1 : The sample has come from Weibull - Exponential distribution with .
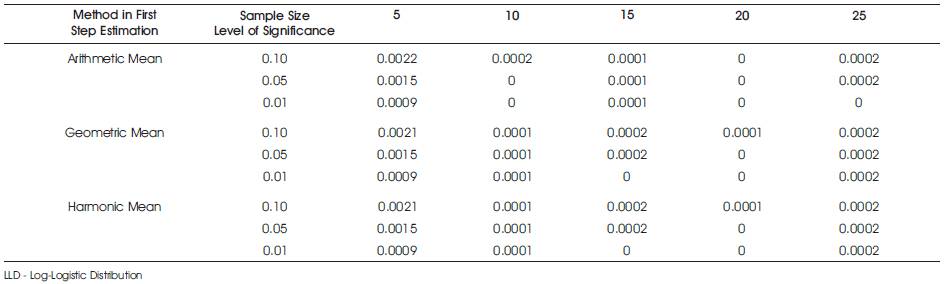
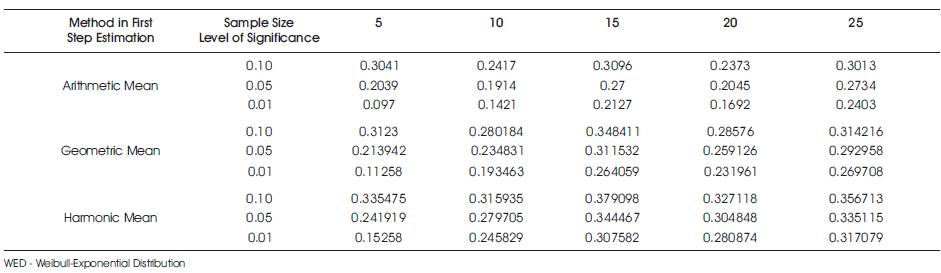
The evaluation procedures of the percentiles and powers of L1/L0 are just similar to what are described for the case of single parameter Burr type X null population except that the two unknown parameters λ, k are estimated by the two step method of estimation. It may be recalled that in two step method of estimation the parameter λ is estimated by considering the Arithmetic Mean, Geometric Mean, Harmonic Means of the observations in the lower half and upper half of a divided ordered random sample into two halves. Accordingly the parameters λ, k will have three sets of estimates for a given sample when estimated by two step method of estimation for the null population and its L0. The percentiles of L1/L0 and powers are therefore accommodated in eight distinct tables namely, Tables 6 through 13.
4. Findings on Discrimination
In this paper, the authors have proposed two test criteria to test a null hypothesis that a given sample has come from a specific population against another specific alternative population. The criteria are based on (i) Quantiles of null population, (ii) Ratio of likelihood functions. The considered null populations are single parameter Burr type X distribution, two parameter Burr type X distribution. The alternative populations are log-logistic distribution and Weibull-Exponential distribution. The specific pairs of null versus alternative populations are as follows.
- Single parameter Burr type X (k=2) vs. log-logistic distribution (8).
H0 : The sample has come from Burr type X distribution with k=2.
H1 : The sample has come from log-logistic distribution with .
- Single parameter Burr type X (k=2) vs. Weibull - Exponential distribution with .
H0 : The sample has come from Burr type X distribution with k=2.
H1 : The sample has come from Weibull-Exponential distribution with .
- Two parameter Burr type X (λ=1,k=2) vs. log-logistic distribution (8).
H0 : The sample has come from Burr type X distribution with λ=1, k=2.
H1 : The sample has come from log-logistic distribution with β =8.
- Two parameter Burr type X (λ =1,k=2) vs. Weibull - Exponential distribution with .
H0 : The sample has come from Burr type X distribution with λ=1, k=2.
H1 : The sample has come from Weibull-Exponential distribution with .
- Two parameter Burr type XII (c=2,k=1) vs. Weibull - Exponential distribution with .
H0 : The sample has come from Burr type XII distribution with c=2,k=1.
H1 : The sample has come from Weibull - Exponential distribution with ().
Tables 2 and 5 relate to powers of the two proposed test criteria to test Burr type X Vs log-logistic/ Weibull-Exponential distributions. The LR criterion is more powerful than the quantile based criterion consistently at all levels of significance for the hypotheses Burr type X vs. Weibull - Exponential. When the alternative is log-logistic both the criteria yield very poor power indicating that the two models are indistinguishable with the confidence ranging from 0.9132 to 1. The same is supported by the frequency curves of Burr X and log-logistic distributions as given in Figures 1 and 2. On the other hand, to test Burr X Vs Weibull-Exponential distributions, LR criterion is giving a significant power of more than about 50%, whereas, the quantile based statistic is giving a very poor power. Figures 3 and 4 of the frequency curves of concerned Burr type X distribution and Weibull-Exponential distribution models, respectively also support that Burr type X distribution and Weibull-Exponential distribution remain as two mutually distinct populations.
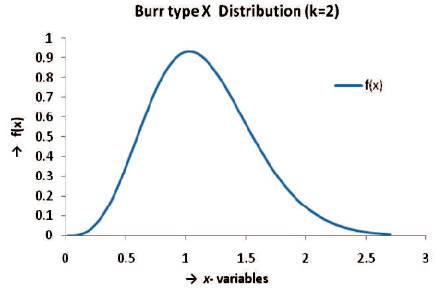
Figure 3. Burr Type Distribution Parameter
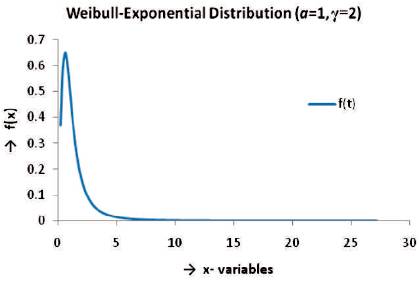
Figure 4. Weibull - Exponential Distribution Parameter
When the two parameter Burr type X distribution is null population, Tables 9 and 13 give the powers of LR criterion with log-logistic distribution, Weibull-Exponential distribution as the respective alternatives. For the former alternative, the recorded powers are very poor ranging from 0 to 0.0022 reaffirming the indistinguishability between Burr type X and log-logistic distributions. When the alternative is Weibull – Exponential the readings in Table 13 give a clear discrimination between Burr type X and Weibull - Exponential though less powerful than the case of single parameter Burr type X vs. Weibull – Exponential with the power ranging from 9% to 37.9%.
Conclusion
Thus the authors may arrive at the following broad conclusions on the basis of our proposed test criteria.
- Log-logistic distribution can be a reasonable alternative to Burr type X distribution.
- A given sample clearly discriminates between Burr type X distribution and Weibull-Exponential distribution.
References
[1]. Burr, I. W. (1942). Cumulative frequency functions. The Annals of Mathematical Statistics, 13(2), 215-232.
[2]. Dey, A. K. & Kundu, D. (2009a). Discriminating among the log-normal, weibull, and generalized exponential distributions. IEEE Transactions on Reliability, 58(3), 416-424.
[3]. Dey, A. K. & Kundu, D. (2009b). Discriminating between the log-normal and log-logistic distributions. Communications in Statistics-Theory and Methods, 39(2), 280-292.
[4]. Dey, A. K. & Kundu, D. (2012a). Discriminating between the bivariate generalized exponential and bivariate Weibull distributions. Chilean Journal of Statistics (ChJS), 3(1).
[5]. Dey, A. K. & Kundu, D. (2012b). Discriminating between the Weibull and log-normal distributions for Type-II censored data. Statistics, 46(2), 197-214.
[6]. Dubey, S. D. (1966). Transformations for Estimation of Parameters. Journal of Indian Statistical Association, 4(3 and 4), 109-124.
[7]. Gupta, R. D. & Kundu, D. (2004). Discriminating between gamma and generalized exponential distributions. Journal of Statistical Computation & Simulation, 74(2), 107-121.
[8]. Gupta, R. D. & Kundu, D. (2003a). Closeness of gamma and generalized exponential distribution. Communications in Statistics-Ttheory and Methods, 32(4), 705-721.
[9]. Gupta, R. D. & Kundu, D. (2003b). Discriminating between Weibull and generalized exponential distributions. Computational Statistics & Data Analysis, 43(2), 179-196.
[10]. Gupta, R. D. & Kundu, D. (2006). On the comparison of Fisher information of the Weibull and GE distributions. Journal of Statistical Planning and Inference, 136(9), 3130-3144.
[11]. Gupta, R. D., Kundu, D., & Manglick, A. (2002). Probability of correct selection of gamma versus GE or Weibull versus GE based on likelihood ratio statistic. In Recent Advances in Statistical Methods (pp. 147-156).
[12]. Kantam, R. R. L., Priya, M. C., & Ravikumar, M. S. (2014). Discrimination between linear failure rate distribution and Rayleigh distribution. Journal of Reliability and Statistical Studies, 7, 9-17.
[13]. Kundu, D. (2005). Discriminating between the normal and Laplace distributions. In Balakrishnan, N., Nagaraja, H. N., & Kannan, N. (Eds.) Advances in Ranking and Selection, Multiple Comparisons, and Reliability (PP. 65-78), Birkhauser, Boston.
[14]. Kundu, D. & Manglick, A. (2005). Discriminating between the log-normal and gamma distributions. Journal of the Applied Statistical Sciences, 14, 175-187.
[15]. Kundu, D., & Raqab, M. Z. (2007). Discriminating between the generalized Rayleigh and log-normal distribution. Statistics, 41(6), 505-515.
[16]. Kundu, D., Gupta, R. D., & Manglick, A. (2005). Discriminating between the log-normal and generalized exponential distributions. Journal of Statistical Planning and Inference, 127(1), 213-227.
[17]. Srinivasa Rao, B. & Kantam, R. R. L. (2014). Discriminating between log-logistic and rayleigh distributions. Pakistan Journal of Statistics and Operation Research, 10(1), 1-7.
[18]. Srinivasa Rao, B. & Kantam, R. R. L. (2013). Acceptance sampling plans for percentiles of half logistic distribution. International Journal of Reliability, Quality and Safety Engineering, 20(05), 1350016.
[19]. Srinivasa Rao, G. & Kantam, R. R. L. (2012). Two-stage Estimation In Log-logistic Model. Pakistan Journal of Statistics, 28(3), 331-339.
[20]. Sultan, K. S. (2007). Order statistics from the generalized exponential distribution and applications. Communications in Statistics-Theory and Methods, 36(7), 1409-1418.