Extreme Value Control Chart for Burr Type XII Distribution
M.S. Ravikumar * R.R.L. Kantam **
* Associate Professor, Department of Community Medicine, Konaseema Institute of Medical Sciences & Research Foundation, Amalapuram, Andhra Pradesh, India.
** Retired Professor, Department of Statistics, Acharya Nagarjuna University, Nagarjunanagar, Andhra Pradesh, India.
Abstract
Variable control charts are based on subgroup statistics and variation in the values of the subgroup statistics between subgroups. In this paper, sampling distribution of extreme order statistics for a given sample from Burr Type XII Distribution are considered and its percentiles are used to develop an extreme value control chart for a process variate. The approximation to Normal Distribution of the Burr Distribution is explored to develop the technique of popular ANalysis Of Means (ANOM) through Burr Distribution. Comparative study of the approximations are made. The results are explained by an illustration.
Keywords :
- Burr Type XII Distribution,
- Extreme Value Control Chart,
- Extreme Order Statistic,
- ANOM,
- Shewart Control Charts.
Introduction
Variable Control Chart for any quality characteristic is based on a methodological sequential order, namely, specifying a probability model for the quality variable, collecting observations on measurements on the quality varies in a production process, formulating the rational subgroups of equal size preferably for the quality observations, considering a statistic and calculating its value for observations in each subgroup called subgroup statistics, say tn where, n is the common subgroup size, finding the percentiles of tn from its sampling distribution. Parallel to Shewart principle, we generally construct the 0.9973 two-tailed, equitailed probability limits of tn .
The median or mean of tn shall be chosen as criterion for central target value. Shifts in the process quality characteristic is indicated by deviations of the value of tn from their median or mean. The larger is the deviation, the poorer is the quality. The limits of deviation are generally called UCL & LCL. These sequences of steps are generally followed for deciding the in control of a process on the basis of control chart as in [1] -[5] and [7]-[10]. The name of the control shall be generally the name of the statistic tn like  - chart if tn is , range chart if tn is range, the S-chart if tn is standard deviation,……etc. If the specified probability model and the statistic tn are not convenient to derive the sampling distribution of tn and hence its 0.9973 probability limits, the theory of extreme order statistics can be explored in developing a control chart. The present paper is based on this principle and hence named as extreme value control charts. The basic model is Burr Type XII Distribution (BTXIID). The suggested theory of extreme order statistics for control charts with reference to BTXIID is presented in Section 1. The developed control limits and the control chart constants along with the associated control limits are given in Section 2. The results are explained in Section 3.
1. Extreme Value Control Chart
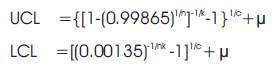
In the introduction, the authors said that if the statistic tn of a subgroup falls within the probability limits of its sampling distribution, the process is said to be in control. Alternatively, this can be viewed as follows. Since a statistic is a function of all sample observations, they may conclude, that in control of the process quality, all the subgroup observations of each subgroup fall between a reasonably wide probability limits. In other words, they propose two limits; in such a way that the maximum of each subgroup is not above an upper limit and the minimum of each subgroup is not below a lower limit. That is, they need the percentiles of extreme order statistics in a subgroup of size n, that would serve as control limits. With this back drop they can use 0.99865 percentile of the highest order statistic and 0.00135 percentile of the least order statistic of a sample of size n assumed to follow a specified probability model as 0.9973 control limits for the subgroup as above. Accordingly, this paper specifies Burr XII with parameters c and k as probability model and subgroups of size n from it as a statistical quality control data for process control. In terms of c and k, the percentiles of extreme order statistics are,
The median of BTXII is taken as the central line. These three would develop a variable control chart for rational subgroups, which are assumed to follow BTXII Distribution.
2. Construction of Control Limits
It is well known that a Burr Type XII Distribution variable with parameters c=4.874 and k=6.158 follows a normal distribution with mean 0.83576 and standard deviation 0.40093.
2.1 Methodology and Objectives
Using this result, if is the mean of a subgroup of size n from a BTXII Distribution, then  is a standard normal variate. From this, the authors can find the probability limits of the subgroup is . If this has l such subgroups, the extreme value control limits for subgroup mean are given by the probability identity
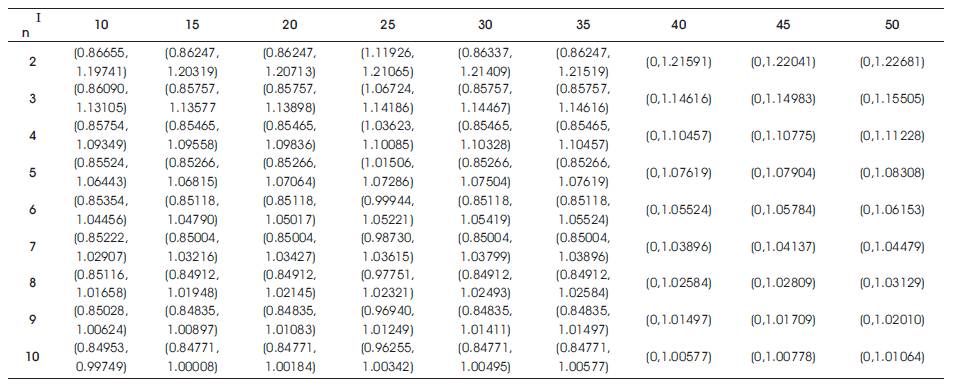
 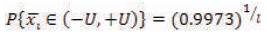 with the help of areas of standard normal tables and the specified subgroup size and the number of subgroups that is fixing n and l, they get the probability limits +U and –U in the above identity. These are evaluated for different values of l and n and are given in Table 1. The in control of the process is verified by finding the minimum and maximum of each subgroup and if both of them fall within the control limits chosen for the given subgroup size and number of subgroups. The authors say that the process is in control over the process out of control. Using the same principle and relation between BTXII and normal distributions, they can develop the control charts for the mean of BTXII distribution also without going on to the number of subgroups. These limits are given in Table 2. If one wants to use extreme value to control limits, they have to go for Table 1 corresponding a given subgroup size, and the number of subgroups. On the other hand, the control chart for mean that is chart one can use Table 2.
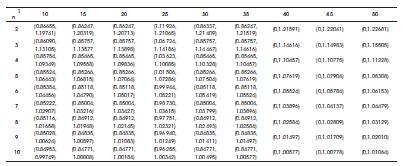
Table 1. Extreme Value Control Chart Limits

Table 2. Extreme Value Control Limits
This procedure of using Table 3 is given by illustration borrowed from as in [6].
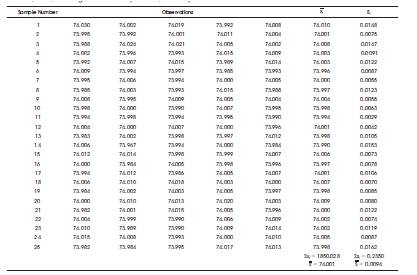
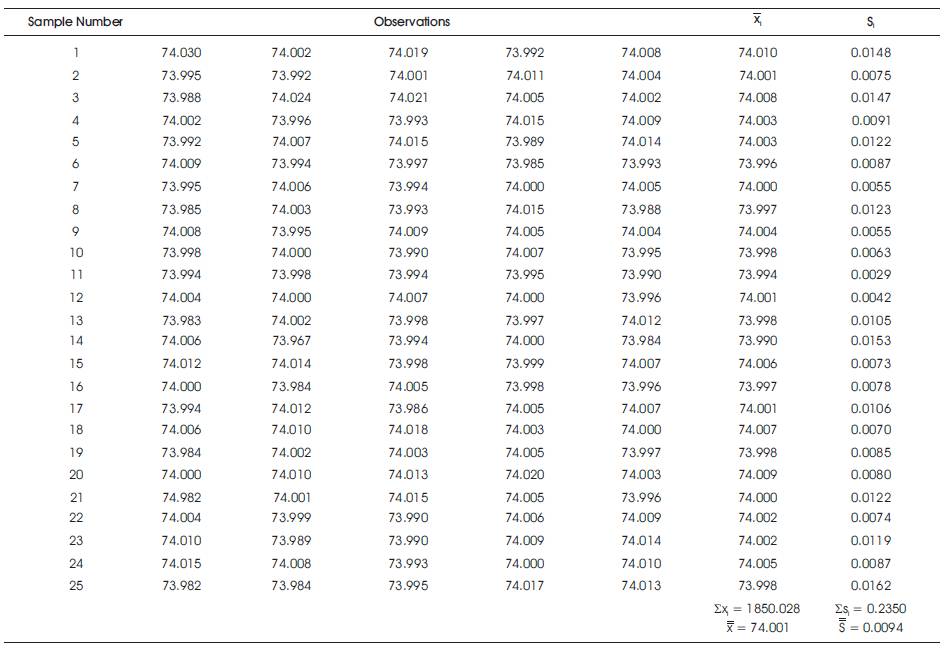
Table 3. Inside Diameter Measurements (mm) for Automobile Engine Piston Rings
3. Illustration
In this example (Table 3), number of subgroups l=25, subgroup size n=5. These are given in Table 3, to find the individual observations in each subgroup, their mean and standard deviation also.
3.1 Conclusion of Extreme Value Control Chart
From Table 1 corresponding to n=5, and l=25, the pair of control limits is (1.01506, 1.07286). Find the mean of minimum of each subgroup say  , similarly, find the mean of the highest (maximum) observation of each subgroup let it be
  . The process will be in control if the least of all subgroup observations fall above and the maximum of all subgroup observations fall below . It will be out of control otherwise.
If it uses only subgroup means of a common subgroup size say n limits of Table 2 are to be multiplied by the grand mean of the data  . The LCL and UCL are . CL , . CU . where CL , CU is the table values in Table 2 corresponding to a given subgroup size n.
3.2 Calculations
Let n=5, l=25 ; Readings of Table 1 are (1.01506,1.07286).
From the given data, mean of all minima of the 25 subgroups = =73.98964.
Mean of all maxima of the 25 subgroups = = 74.05096.
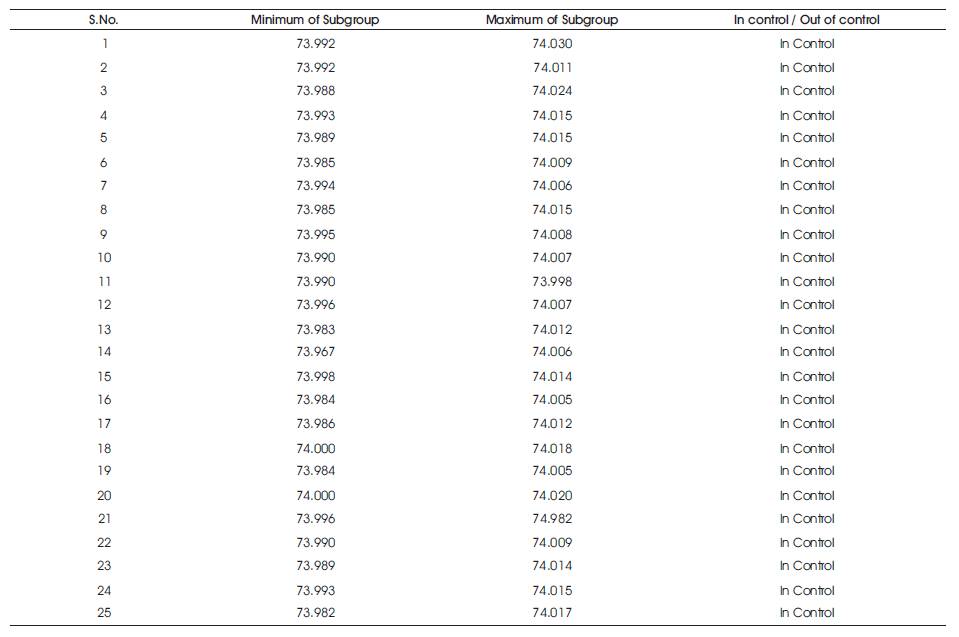
The control limits of Extreme Value Control Limits are (1.01506 , 1.07286 ) = (75.10392, 79.44631). All the 25 size subgroups of Table 3 has to show with the extreme value limits of minimum and maximum subgroups to be identified with the conditions of in control and out of control as presented in Table 4.
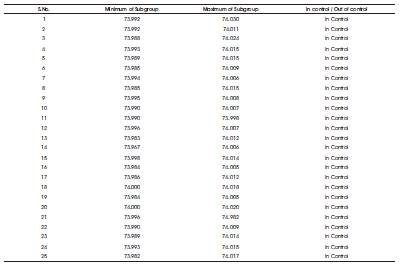
Table 4. Control Limits of Extreme Value Control Limits
Conclusion
This paper concludes the construction of extreme value limits, other than a normal distribution approximation, which is used in Burr Type XII Distribution through Analysis of Means (ANOM) by this suggested way.
References
[1]. John A. Austin, Jr. (1973). “Control Chart Constants for Largest and Smallest in Sampling from a Normal Distribution using the Generalized Burr Distribution”. Technometrics, Vol.15, No.4, pp.931-933.
[2]. Kantam, R.R.L and Ravikumar, M.S. (2013). “Variable Control Charts in Inverse Gaussian Distribution”. Proceedings of National Conference on Mathematical Sciences and Applications, pp.161- 164.
[3]. Kantam, R.R.L and Ravikumar, M.S. (2013). “Time Control Chart – Some IFR Models”. InterStat, pp.1-10.
[4]. Kantam, R.R.L and Ravikumar, M.S. (2013). “Time Control Chart - Burr Distribution”. Collection of Recent Statistical Methods and Applications, A Publication of Department of Statistics, University of Kerala, pp.307-314.
[5]. Kantam, R.R.L., SriRam, B., and Srinivas, V. (2013). “Extreme Value Control Charts in Some Life Testing Models”. International Journal of Scientific and Research Publications, Vol.3, No.9, pp.1-4.
[6]. Montgomery Douglas C. (2001). Introduction to Statistical Quality Control. Third Edition, WSE, pp.213.
[7]. Raid W. Amin and Hans W. Wolff. (2007). “The Behavior of an Extreme - Value Control Charts in the Case of Mixture Alternatives”. The Case of Mixture Alternatives, Sequential Analysis-Design Methods and Applications, Published online (Taylor & Francis Online), pp.35-51.
[8]. Rungsarit Intaramo, and Adisak Pongpullponsak, (2012). “Development of Fuzzy Extreme Value Theory Control Charts Using α -cuts for Skewed Populations”. Applied Mathematical Sciences, Vol.6, No.117, pp.5811-5834.
[9]. Srinivasa Rao, B., Pratapa Reddy, J., and Sarath Babu, G. (2012). “Extreme Value Charts and Analysis of Means (ANOM) Based on the Log Logistic Distribution”. Journal of Modern Applied Statistical Methods, Vol.11, No.2, pp.493-505.
[10]. Srinivasa Rao B. and Kantam, R.R.L. (2012). “Extreme value charts and analysis of means based on half logistic distribution”. International Journal of Quality & Reliability Management, Vol.29, No.5, pp.501-511.