The Mathematics of the Tri–Squared Triangulation Algorithmic Model
James Edward Osler II
Associate Professor, Department of Curriculum and Instruction, North Carolina Central University, USA.
Abstract
This work provides a mathematical and an epistemological rational for the transformative process of qualitative data into quantitative outcomes through the Tri–Squared Test. The design of fixed-parameter algorithms for research engineering can prove to be beneficial to a variety of fields of learning. This novel methodology provides statistical power and mathematical elegance to research outcomes. It is a comprehensive approach that has a wide range of applicability as it practically addresses important and relevant problems with sample sizes that are small and research arenas that are rather complex. This research is the continuation of a dynamic mixed methods approach that is a transformative process which changes qualitative data into quantitative outcomes through the Tri–Squared statistical measure first introduced in i-manager's Journal of Mathematics.
Keywords :
- Algorithmic Model,
- Algorithmics,
- Cartesian Coordinates,
- Geometric Vectors,
- Models,
- Research Engineering,
- Triangulation,
- Trichotomy,
- Tri–Squared,
- Vector.
Introduction
The Tri–Squared Test is an efficient and elegant technique that was introduced in 2012. It is a four step process for determining the appropriate Research Effect Size, Sample Size, and Alpha Level (Osler, 2012). The Tri–Squared research procedure consists of a four step approach designed to provide the researcher with a clear and precise set of data to conduct research, analyze data, and determine the level of significance required to either validate or reject the initial research hypothesis.
One of the most challenging areas of research in education involves the construction of specific instruments that are designed to measure qualitative outcomes and data. Although there are a great many measurement tools that analyze the cognitive and psychomotor domains, there remains a vacuum in the number of instruments especially designed to accurately measure the affective domain (the learning domain that contains attitudes, opinions, emotions, perception, and perspectives). This void is further expanded when the specific event under investigation is unique, specialized, has specific characteristics, serious legal constrictions, and issues regarding time. This often requires the research investigator to design an instrument that ideally measures the variables under investigation (Osler, 2012). Researcher Orlich details this in terms of educational research as he goes on to state in his book “Teaching Strategies: A Guide to Effective Instruction” specifically that, “Teachers know they need to analyze how they teach in terms of what they are teaching and to whom they are teaching it” (Orlich, et al., 2004).
1. The Origins of the term“Trichotomy”
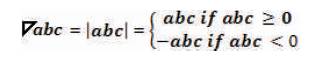
The term is pronounced ['trahy-kot-uh-mee'], spelled “trichotomy”, and is a noun with the plural written form “trichotomies”. A “Trichotomy” in terms of philosophy can be referred to as a threefold method of classification. Philosopher Immanuel Kant adapted the Thomistic acts of intellect in his trichotomy of higher cognition — (a) understanding, (b) judgment, (c) reason — which he correlated with his adaptation in the soul's capacities — (a) cognitive faculties, (b) feeling of pleasure or displeasure, and (c) faculty of desire (Kant, 2007). In terms of mathematics, Apostol in his book on calculus defined “The Law of Tricohotomy” as: Every real number is negative, 0, or positive. The law is sometimes stated as “For arbitrary real numbers a and b, exactly one of the relations a < b, a = b, and a > b holds” (Apostol, 1967).
It is important to note that in mathematics, the law (or axiom) of trichotomy is most commonly the statement that for any (real) numbers x and y, exactly one of the following relations holds. Until the end of the 19th century, the law of trichotomy was tacitly assumed true without having been thoroughly examined (Singh, 1997 and 2002). A proof was sought by Logicians and the law was indeed proved to be true. If applied to cardinal numbers, the law of trichotomy is equivalent to the axiom of choice. More generally, a binary relation R on X is trichotomous if for all x and y in X exactly one of xRy, yRx or x = y holds. If such a relation is also transitive it is a strict total order; this is a special case of a strict weak order. For example, in the case of three elements the relation R given by aRb, aRc, bRc is a strict total order, while the relation R given by the cyclic aRb, bRc, cRa is a non–transitive trichotomous relation. In the definition of an ordered integral domain or ordered field, the law of trichotomy is usually taken as more foundational than the law of total order, with y = 0, where 0 is the zero of the integral domain or field. In set theory, trichotomy is most commonly defined as a property that a binary relation < has when all its member  satisfy exactly one of the relations listed above. Strict inequality is an example of a trichotomous relation in this sense. Trichotomous relations in this sense are irreflexive and antisymmetric (Sensagent, 2012). It is from these logical and mathematical definitions that the author derives the definition of “Research Trichotomy” and applies it to the qualitative and quantitative analysis of the affective domain of learning.
2. The Psychometrics of Trichotometric Analysis
One of the most challenging areas of research in education involves the construction of specific instruments that are designed to measure qualitative outcomes and data. Although there are a great many measurement tools that analyze the cognitive and psychomotor domains, there remains a vacuum in the number of instruments especially designed to accurately measure the affective domain (the learning domain that contains attitudes, opinions, emotions, perception, and perspectives). This void is further expanded when the specific event under investigation is unique, specialized, has specific characteristics, serious legal constrictions, and issues regarding time. This often requires the research investigator to design an instrument that ideally measures the variables under investigation (Osler, 2013a & 2013b).
The process of designing instruments for the purposes of assessment and evaluation is called “Psychometrics”. Psychometrics is broadly defined as the science of psychological assessment (Rust & Golombok, 1989). The Tri–Squared Test pioneered by the author, factors into the research design a unique event–based “Inventive Investigative Instrument”. This is the core of the Trichotomous–Squared Test. The entire procedure is grounded in the qualitative outcomes that are inputted as Trichotomous Categorical Variables based on the Inventive Investigative Instrument. The specific assessment of the variables is completely dependent upon the outcomes determined by the researcher's instrument. The creation, production, and deployment of the Inventive Investigative Instrument requires that the research investigator adopts the role of a “Trichotomous Psychometrician” or “Trichotometrician”. A “Trichotomous Psychometrician” is an Educational Scientist that uses trichotomous–based psychometrics to develop a qualitative Inventive Investigative Instrument specifically designed capture qualitative responses during a specific event. A description of the entire Tri–Squared research process follows and is described in detail so that the reader is informed of precisely how an Inventive Investigative Instrument is developed, designed, and ultimately implemented (Osler, 2012).
3. The Triangulation Testing Model
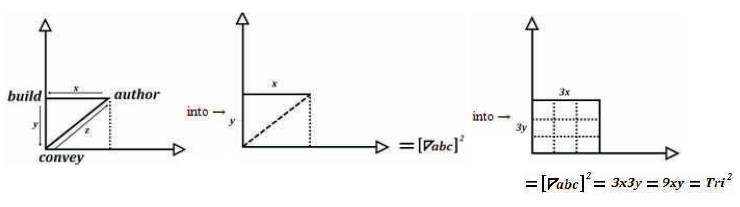
The Algorithmic Model of Triangulation is of the form (Figure 1):
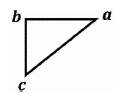
Figure 1. The Triangulation Algorithmic Model
Where,
Vertex a = ∠a = “authoring” = The Initial Tri–Squared Instrument Design;
Vertex b =∟b = “building” = The Tri–Squared Qualitative Instrument Responses; and
Vertex c = ∠c = “conveying” = The Final Tri–Squared Test Outcomes in a Quantitative Report.
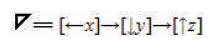
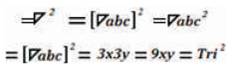
Thus, the Triangulation Model is symbolized by a Right Triangle written as: “ ”. This symbol called “Trine” (meaning a group of three) is written mathematically as “=abc” and is simplified into the mathematic geometric expression: abc(meaning “Triangulation Model abc” or more simply “Trine abc”). This is illustrated in Figure 2 as the “Angular Triangulation Algorithmic Model”.
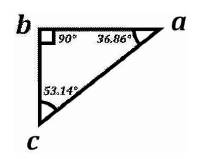
Figure 2. The Angular Triangulation Algorithmic Model
The angles have the following angular measurements in degrees: ∠a = 36.86, ∟b = 90, and ∠c = 53.14, that all add up to the standard 180° of a traditional triangle (36.86° + 90° + 53.14° = 180°). The connective points (i.e., the lines between points a, b, and c respectively are geometric “vectors” (lines with both size [magnitude] and direction) making the model a systemic or cyclic process. This is illustrated in terms of Cartesian Coordinates in Figure 3.
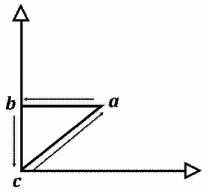
Figure 3. The Triangulation Algorithmic Model in Cartesian Vectors
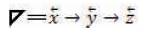
In terms of Vectors, the Triangulation Model Right Triangle  abc is equal to three vectors that illustrate the movement in direction and magnitude from one completed task into another. The entire process is both cyclical and sequential with a “Trine Vector Equation” written as:
Defined as Trine = “Concentration of Vector x into Concentration of Vector y into Concentration of Vector z”, which is simplified into a more standardized Trine Vector Equation form written as:
Where, vectors x, y, and z respectively are indicated on the “Algorithmic Triangulation Data Model” in Figure 4.
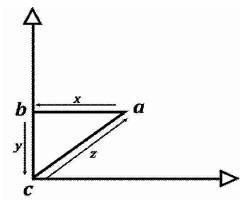
Figure 4. The Algorithmic Triangulation Data Model in Cartesian Coordinates and Cartesian Vectors
Indicating that the standardized form of the vectors x, y, and z are equivalent to the following geometric vectors that are the sequential Cartesian Coordinates relative to the size and magnitude of the research engineering phases that sequentially connect the respective angles ∠a, ∟b, and ∠c. This is written as follows:
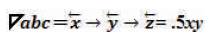
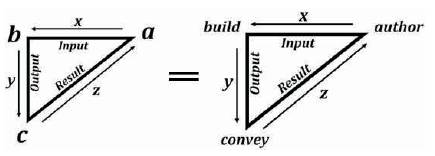
Thus, 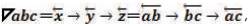 , where, “Right Triangle abc” symbolizes the “Triangulation Data Model of Research Engineering Relative to the Tri–Squared Test” and has angles ∠a, ∟ b, and ∠c that are equal to the following “Trichotomy–Squared Research Design Operational Parameters” ∠a = author, ∟b = build, and ∠c = convey are illustrated in the Triangulation Data Definition Model is illustrated in Figure 5.
Figure 5. The Triangulation Data Definition Model
This detailed researcher engineered model is geometrically written in a Definitive Triangulation Cartesian Coordinate Model (Figure 6).
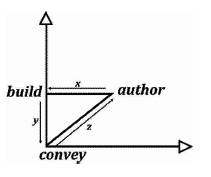
Figure 6. The Definitive Triangulation Cartesian Coordinate Model
Where the Area of the Triangulation Model is abc = 0.5xy, (or ½ xy, where coordinates x and y are the abscissa [base] and ordinate [height] of the right triangle sides) which is equivalent to the area of a triangle which is: “½ base × height”. This in turn creates the complete circuit of the “Algorithmic Model of Triangulation” as the metric for innovative data transformation in the following mathematical vector formula:
Thus, the complete form of the Algorithmic Triangulation Coordinate Model is illustrated in Figure 7.
When the Algorithmic Triangulation Model is replicated, it is actually squared: [abc]2 . This creates a trichotomous rectangle (3x . 3y = 9xy) which is the basis of the Tri–Squared Test. The Tri–Squared Test is a dual data transformation process which involves the investigation of trichotomous variables extracted from the research instrument outcomes as qualitative data that is thereby transformed into quantitative data for purposes of analysis.
The complete form of the Triangulation Model highlighting the vectors x, y, and z in their numeric form (where x = 4, y = 3, and z = 5) is illustrated in (Figure 8).
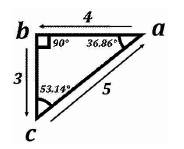
Figure 8. The Complete Form of Algorithmic Triangulation Coordinate Model
4. The Metrics of Innovative Data Transformation
The vectorization between the Operational Parameters a, b, and c each have respective specific vectors which are phase amounts which are:
x=4
y=3
z=5
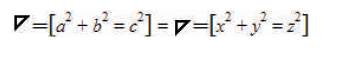
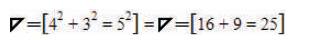
These vector numerics indicate that the Tri–Squared Research Engineering Triangulation Model is a Geometric Right Triangle with vector ratios of 3:4:5 that indicates that the Triangulation Model is mathematically defined as a “Pythagorean Triple”. The Triangulation Model vectors have the properties of the Pythagorean Theorem (a2 + b2 = c2 ) as indicated in the following equations:
Which is equal to:
The Triangulation Model is also an Algorithmic Model. The ratios of the Triangulation model are indicative of the vector phases that occur between the “Vertexes” or “Angular Operational Parameters” that are sequential and a part of the entire Tri–Squared Test (as a cyclic research engineering process). Each phase is a sequential vector (having size and magnitude) that numerically represents the steps in the overall research design process that must sequentially occur to deliver the final outcome of the research investigation. Thus, the Algorithmic Model of Triangulation is represented as in Figure 9.
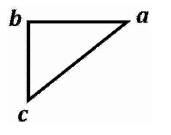
Figure 9. The Triangulation Algorithmic Model
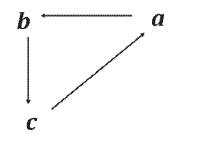
Figure 10. The Triangulation Algorithmic (Functional) Cyclical Model
That leads to a function that is Cyclical Model presented in Figure 10.
Where,
x=4;
y=3; and
z=5.
The connective points between a, b, and c are vectors (lines that have both size [magnitude] and direction [aim]) making the model a systemic process that is both sequential and cyclic.
5. The Dynamic Functions of the Triangulation Model
Thus, the Triangulation Model is symbolized by a Right Triangle written as: “ ”. This symbol called “Trine” (meaning a group of three) is written mathematically as “=abc” (with the “abc” symbolizing the 3 Triangulation angles or vertices) and is simplified into the mathematic geometric expression: abc (meaning “Triangulation Model abc” or more simply “Trine abc”). The vectors of the Triangulation Model follow the same parameters as the vertices with theRight Triangle also written as: “”, symbolizing “=xyz” (with the “xyz” symbolizing the 3 Triangulation vectors). This is also simplified into the mathematic geometric expression: xyz (meaning “Triangulation Model xyz” or more simply “Trine xyz”).
In terms of Cartesian Coordinates, the Trine Function of abc (or “Trine abc”) =abc. The Trine Function of abc is composed of:
The Trine Function of a =a;
The Trine Function of b = b; and
The Trine Function of c = c.
Similar to the Trine Function of abc (which describes the holistic relationship between the three Triangulation Model angular vertices), there is a Function that describes the holistic relationship between the three Triangulation Model geometric vectors x, y, and z. This function is called the “Triangulus Function”. The term “Triangulus” is derived from a portmanteau of the two terms “Triangle” (referring to the Triangulation Model Right Triangle) and the term “Modulus” (which refers to the absolute value of a given number or value (and is always positive). The Triangulus Function is a parallel sequential operator that is a geometric function that describes the process of transforming inputted qualitative data values into outputted quantitative data outcomes as a part of the Tri–Squared Test.
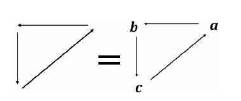
Figure 11. The Triangulus Function Equivalent to the Triangulation Cyclical Model
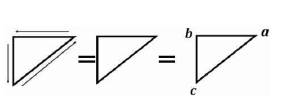
Figure 12. The Vector Equivalent Relationships to the Triangulation Model
The Triangulus Function has a geometrical vector cyclical model that is of the following form, as illustrated in (Figure 11).
This vector relationship is holistically represented by the Triangulation Model Right Triangle as illustrated in Figure 12.
Where a, b, and c are the respective Operational Research Parameters of the Research Engineering process of the Tri–Squared Test. The geometric vectors of all of the aforementioned models are x, y, and z respectively. As such, the relationship between abc and xyz in the Algorithmic Triangulation Model is of the mathematical form a over x = (or a/x), b over y = (or b/y), and c over z = (or c/z). Whereby, abc is the sequential series of Operational Parameters and xyz are the methods or Operational Phases used to reach each respective Operational Parameter. Thus,  where x must follow a, y must follow b, and z must follow c. A model of this relationship is illustrated in the Complete Cyclical Triangulus Function as in Figure 13.
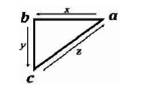
Figure 13. The Complete Cyclical Triangulus Function Model
In terms of geometric vector absolute values for Operational Vertices Parameters abc (referred to as “mods” for the plural form of “modulus” and uses the  “ ” brackets) and Operational Vector Phases xyz (referred to as “norms” and uses the
  “ ” brackets), the mathematical equations are written in the following manner:
The Triangulus Function aids in the overall comprehension of the meaning of each of the Algorithmic Triangulation Model Operational Parameters and Phases. For example, Operational Research Engineering Parameter “a” = “author” creates the Trichotomous–Squared Test Inventive Investigative Instrument. This is illustrated in the following example taken from a research investigation in which Tri–Squared hypothesis was investigated and an innovative Inventive Investigative Instrument was developed and deployed.
The Initial Research Hypotheses were, H0 : There are significant differences in the perception of the success of Ninth Grade Academy Models in terms of graduation rates, dropout rates, high stakes testing, retention, and attendance by high school administrators; and H1 : There are no significant differences in the perception of the success of Ninth Grade Academy Models in terms of graduation rates, dropout rates, high stakes testing, retention, and attendance by high school administrators. The Initial Research Mathematical Hypotheses were:
H0:X2 = 0
H1:X2 ≠ 0
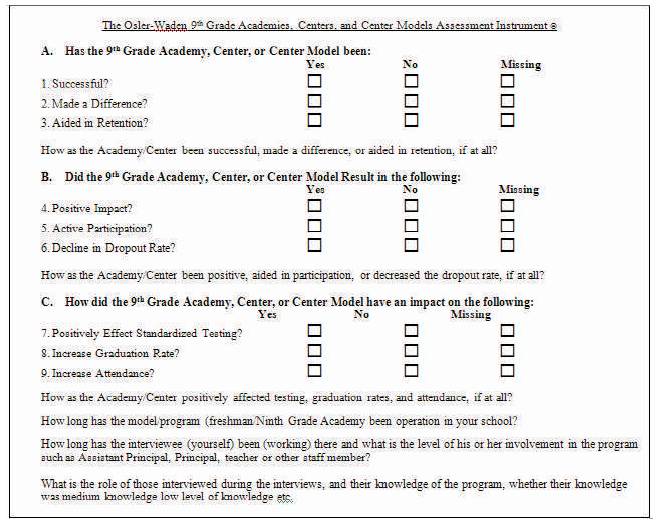
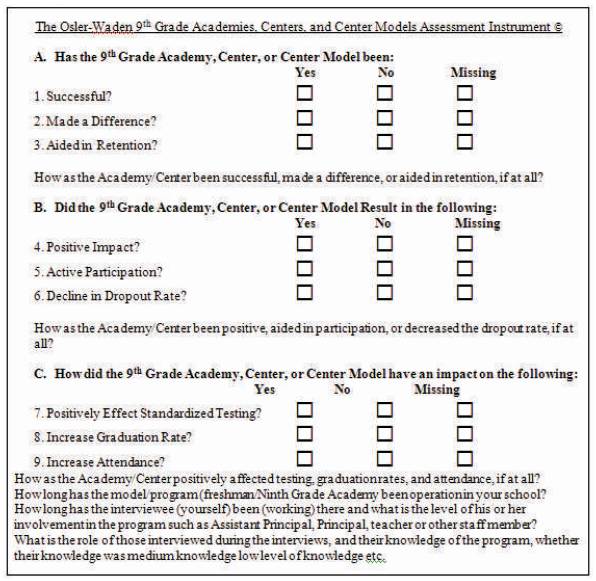
The Research Inventive Investigative Instrument that was deployed was: The Osler – Waden 9th Grade Academies, Centers, and Center Models Assessment Instrument ©. The investigators used interviews derived from a novel researcher–designed “Disposition Assessment Instrument” (Figure 1). The instrument was given to schools that had 9th Grade Academies, Centers, and Center Models. The instrument and interview questions derived from the instrument obtained data from high school personnel: Principals and Assistant Principals. The instrument was qualitative in nature analyzed quantitatively to accurately statistically analyze the level of significance of participant's responses to the research questions (Figure 14).
Figure 14. The Osler-Waden Tri–Squared Triple–I Research Instrument
The instrument presented as, (Figure 14) was also obtained from administrator's answers to research questions relating to the impact of Ninth Grade Centers, Academies or similar models on minority ninth grade student academic achievement. The purpose of this instrument was to provide data from 9th Grade Academies, Centers, and Center Models for non–parametric quantitative data analysis. Data that was not responded to was reported as “Missing” (a separate Categorical Variable designed to report all research results).
6. Mathematically Defining the Triangulus Function in Terms of Modulus and Norm
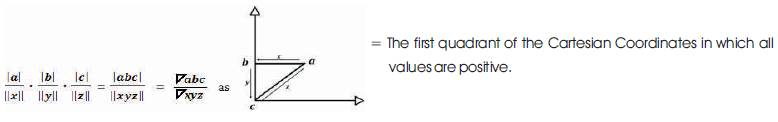
The division of the modulus (absolute value) Operational Vertex Angular Parameters a, b, and c by Operational Geometric Vector Phases x, y, and z are defined in the following series of definitions and equations:
6.1 Mathematical Definition
= Trine for the = The Triangulus Function = abc (The Triangulus Function of abc)
Where, the following proof (via equations) is true:
Thus,  is always positive and this also applies to
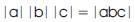
In terms of Geometric Vectors, Trine xyz = abc is the absolute value (called a “norm”) of vectors x, y, and z respectively, thus, Trine xyz = abc has the following properties:
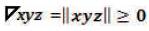 or Non–Negativity;
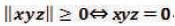 , or Positive–Definiteness;
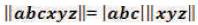 , or Positive Scalability;
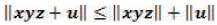 , or The Triangle Inequality which is a consequence of the Pythagorean Theorem for Right Triangles;
Thus is always positive, and this also applies to
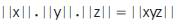
Note: The “norm” of a geometric coordinate vector is also called its “length” or its “magnitude”. As a result of the aforementioned mathematical definitions and equations, the following model can now be better understood and fully articulated as follows (Figure 15).
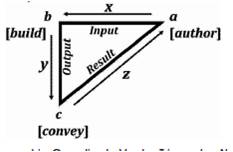
Figure 15. The Geometric Coordinate Vector Triangular Algorithmic Model
The entire process of “Operational Tri–Squared Research Engineering” (as illustrated in Figure 15) is now holistically defined as: a as  = Trine a = a = “author” research Inventive Investigative Instrument, followed by x as
  = Trine x = x = construct research Inventive Investigative Instrument, into b as
  = Trine b = b = “build” research investigation by Deploying the Inventive Investigative Instrument, followed by y as
  = Trine y = y = conduct Qualitative Data Aggregation from the research Inventive Investigative Instrument into the Input Qualitative Standard Tri–Squared 3 × 3 Table, into c as
  = Trine c = c = “convey” the Results of the Tri–Squared Test via the Output Quantitative Standard Tri–Squared 3 × 3 Table, into z as
  = Trine z = z = complete research investigation by Reporting the Outcome of Tri – Squared Statistical Hypothesis Test. This completes the Algorithmic Triangulation Model as abc = = Trine abc = abc which put into operation as the Triangulus Function
 = Trine abc over Trine xyz.
7. The Complete Triangulation Model
The three numeric Vector Operational Phases of the Triangulation Model are defined in Figure 16 in the following manner:
The entire Triangulation Model is defined in Figure 16 as a Research Engineering methodology begins with a breakdown of the Trine [] Operational Research Engineering Parameters and Geometric Vectors in the following manner:
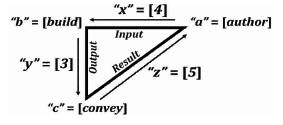
Figure 16. The Operational Phases Vector Triangular Algorithmic Model
7.1 The Tri–Squared Triangulation Model Research Engineering Process (highlighting the Operational Parameters and Phases of the Tri–Squared Test)
Geometric Vertex a = ∠a = “authoring” = The Initial Tri–Squared Instrument Design = Operational Parameter “a” = “author” = absolute value of a = “modulus a” = = “Trine a” = a = The creation of the Tri–Squared Inventive Investigative Instrument. This process can be seen in the following model (Figure 17).
Figure 17. The Cartesian Coordinate Model into the Tri–Squared 3 by 3 Standard Table
This in turn, leads into [→] vector x = Geometric Vector x = “←x” =  =
= = The Initial Tri–Squared Instrument Construction = Operational Phases “x” = absolute value of vector x = “norm x” == “Trine x” = x = The creation of the Tri–Squared Inventive Investigative Instrument = The Pythagorean Triple of the Triangulation Model = “4” = The 4 Phases of Tri–Squared Inventive Investigative Instrument Construction which is composed of the following 4 Operational Phases:
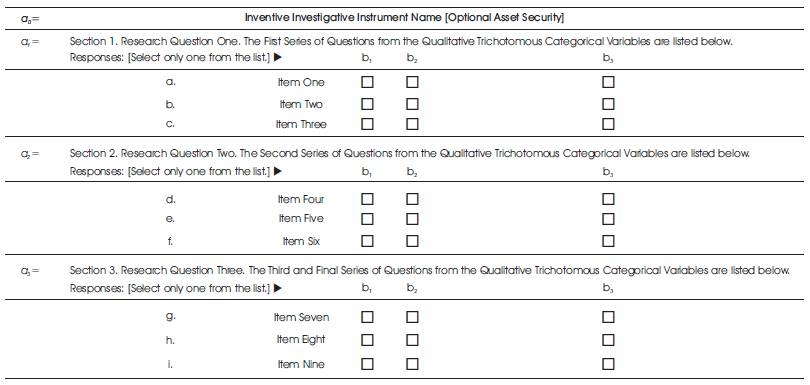
1. a0 = The Instrument Name (Asset Security Optional);
2. a1 = Section One of the Research Instrument. Constructed from the first series of instrument items (a. through c.) derived from the research investigation questions as the Qualitative Trichotomous Categorical Variables (as the Initial Investigation Input Variables), evaluated via the Qualitative Trichotomous Outcomes (as the Resulting Outcome Output Variables = b1 , b2 and b3 respectively);
3. a2 = Section Two of the Research Instrument. Constructed from the second series of instrument items (d. through f.) derived from the research investigation questions as the Qualitative Trichotomous Categorical Variables (as the secondary Investigation Input Variables), evaluated via the Qualitative Trichotomous Outcomes (as the Resulting Outcome Output Variables = b1 , b2 , and b3 respectively); and
4. a3 = Section Three of the Research Instrument. Constructed from the third series of instrument items (g. through i.) derived from the research investigation questions as the Qualitative Trichotomous Categorical Variables (as the tertiary Investigation Input Variables), evaluated via the Qualitative Trichotomous Outcomes (as the Resulting Outcome Output Variables = b1 , b2 , and b3 respectively);
Figure 18. The Construction Model for the Tri–Squared Inventive Investigative Instrument
Figure 18 provides the metrics for the construction of the Inventive Investigative Instrument following the parameters indicated in phases 1. through 4. of the first vector [x = ab = 4] of the Triangulation Model.
This Tabular Triangulation Model can be fully exemplified in the aforementioned example provided by Figure 18. This is followed by Figure 19, which is an illustrated enlarged formof the concepts provided in the initial Tabular Triangulation Model to illustrate a sample completed Inventive Investigative Instrument holistically provided in Figure 19.
The aforementioned Tri–Squared research instrument (which is defined in the first “Operational Geometric Vector” of the Triangular Algorithmic Model) as created by the “Operational Construction Model” for the Tri–Squared Research Instrument” as illustrated in Figure 20.
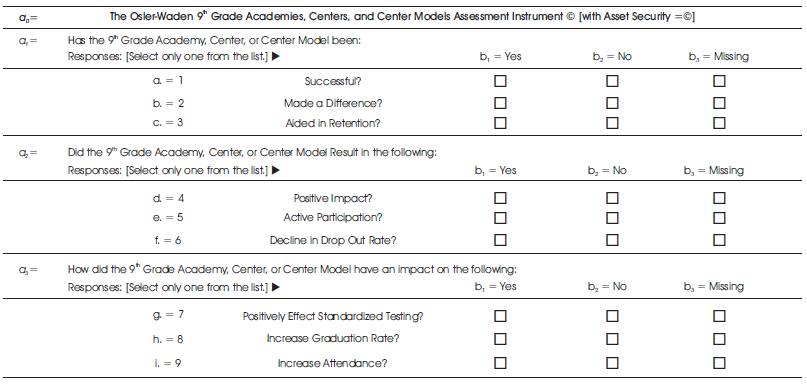
Where, the Operational Geometric Vector phases of the Operational Construction Model are defined respectively as:
ao =The Osler–Waden 9th Grade Academies, Centers, and Center Models Assessment Instrument ©;
a1 =Has the 9th Grade Academy, Center, or Center Model been
a2 =Did the 9th Grade Academy, Center, or Center Model Result in the following;
a3 =How did the 9th Grade Academy, Center, or Center Model have an impact on the following;
b1 = Yes;
b2 = No; and
b3 = Missing.
This is followed by: Geometric Vertex b =∟b = “build” = The Tri–Squared Qualitative Instrument Responses = Operational Parameter “b” = “build” = absolute value of b = “modulus b” =  = “Trine b” = b = The effective deployment of the Tri–Squared Inventive Investigative Instrument to elicit responses and aggregate the response data. This process can be seen in the following model in Figure 21.
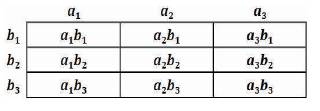
Figure 21. The Rows and Columns of the Tri–Squared of the Outcomes of the Inventive Investigative Instrument
Figure 21 illustrates the Standard 3 × 3 Tri–Squared Table of Comprehensive Inputted Qualitative Research Responses would resemble the following: Where, Tn = The Total Number of Responses (based upon a one to one ratio of each Trichotomous Testing Input Variables contrasted directly with each Trichotomous Results Output Variable) in each of the individual cells of the Standard 3 × 3 Tri–Squared Table as illustrated in Figure 22.
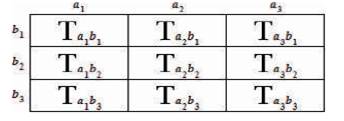
Figure 22. The Calculated Total Methodology of the Rows and Columns to determine the Tri–Squared Data Research Outcomes of the Inventive Investigative Instrument
The total calculations per cell (of Figure 22) corresponds sequentially as follows:
Ta1 b1 = Total Number of Responses for Cell One in the Standard 3 × 3 Tri–Squared Table
Ta2 b1 = Total Number of Responses for Cell Two in the Standard 3 × 3 Tri–Squared Table;
Ta3 b1 = Total Number of Responses for Cell Three in the Standard 3 × 3 Tri–Squared Table;
Ta1 b2 = Total Number of Responses for Cell Four in the Standard 3 × 3 Tri–Squared Table;
Ta2 b2 = Total Number of Responses for Cell Five in the Standard 3 × 3 Tri–Squared Table;
Ta3 b2 = Total Number of Responses for Cell Six in the Standard 3 × 3 Tri–Squared Table;
Ta1 b3 = Total Number of Responses for Cell Seven in the Standard 3 × 3 Tri–Squared Table;
Ta2 b3 = Total Number of Responses for Cell Eight in the Standard 3 × 3 Tri–Squared Table; and
Ta3 b3 = Total Number of Responses for Cell Nine in the Standard 3 × 3 Tri–Squared Table;
These outcomes in turn, lead into [→] vector y = Geometric Vectory = “↓y” =  =
=  = The Initial Tri–Squared Instrument Construction = Operational Phases “y” = absolute value of vector y = “norm y” = = “Trine y” = y = The creation of the Tri–Squared Inventive Investigative Instrument = The Pythagorean Triple of the Triangulation Model = “3” = The 3 Phases of Tri–Squared Inventive Investigative Instrument Deployment which is composed of the following 3 Operational Phases:
1. Inventive Investigative Instrument Deployment;
2. Inventive Investigative Instrument Completion; and lastly
3. Inventive Investigative Instrument Data Aggregation.
The Tri–Squared Test Standard 3 × 3 Table is used to aggregate and report the Qualitative Data outcomes and it is written in the following research table format (as illustrated in Table 1).
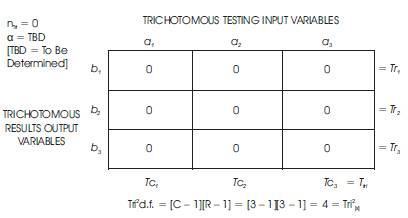
Table 1. Sample Research Report Table: An Example of the 3 × 3 Table of the Qualitative Input Outcomes of the Tri–Squared Test
Table 1 displays the Tri–Square Test Formula for the Transformation of Trichotomous Qualitative Outcomes into Trichotomous Quantitative Outcomes to Determine the Validity of the Research Hypothesis:
Tri2 Critical Value Table = TBD (with d.f. = 4 at α = TBD). For d.f. = 4, the Critical Value for p > TBD is TBD. The calculated Tri–Square value is TBD, thus, the null hypothesis (Ho ) is rejected by virtue of the hypothesis test which yields the following: Tri–Squared Critical Value of TBD < or > TBD based upon the Calculated Tri–Squared Value. This is followed by: Geometric Vertex c = ∠c = “convey” = The Final Tri–Squared Test Outcomes in a Quantitative Report = Operational Parameter “c” = “convey” = absolute value of c = “modulus c”= = “Trine c” = c = The creation of the Tri–Squared Inventive Investigative Instrument. This process can be seen in the following tabular format displayed in Figure 23.
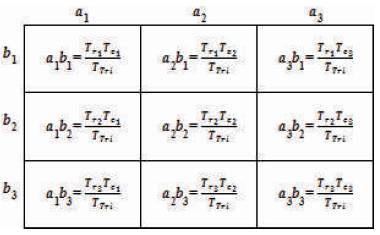
Figure 23. Tabular Tri–Squared Calculations for the Tri–Squared Test
As illustrated in Figure 23, the calculations displayed are represented in the Triangular Algorithmic Model (which is also the “Triangulus” function) as the [→ ] vector z = Geometric Vector z = “↑ z” = == The Initial Tri–Squared Instrument Construction = Operational Phases “z” = absolute value of vector y = “norm z” =  = “Trine z” = z = The transformation of the Tri–Squared Inventive Investigative Instrument Qualitative Data into Quantitative Data for the purposes of determining the outcome of the Tri–Squared Hypothesis Test = The Pythagorean Triple of the Triangulation Model = “5” = The 5 Phases of the Final Tri–Squared Test which is composed of the following 5 Operational Phases:
1. Detail the Previously Determined Tri–Squared Hypothesis Test: Response Number, Alpha Level, Sample Size;
2. Convert the Tri–Squared Inputted Qualitative Values into Outputted Quantitative Values;
3. Conduct the Tri–Squared Test Calculation to determine the Hypothesis Test Calculated Value;
4. Conduct the Tri–Squared Hypothesis Test (Comparing the Tri–Squared Calculated and Critical Values); and finally
5. Report the Final Outcome of the Tri–Squared Hypothesis Test.
The Tri–Squared Test Standard 3 × 3 Transformation Table is used to transform the inputted Qualitative Data outcomes into outputted Quantitative Data Results and it is written in the following format (as shown in Table 2):
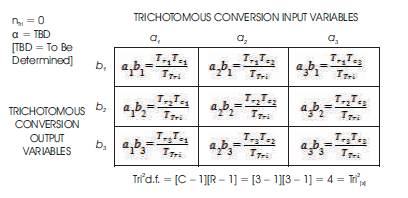
Table 2. An Example of the 3 × 3 Table of the Quantitative Output Outcomes of the Tri–Squared Test
Table 2 displays the Tri–Square Test Formula for the Transformation of Trichotomous Qualitative Outcomes into Trichotomous Quantitative Outcomes to Determine the Validity of the Research Hypothesis:
Tri2 Calculated Tri–Squared = [0] + [0] + [0] + [0] + [0] + [0] + [0] + [0] + [0] = 0 (with d.f. = 4 at α = TBD). For d.f. = 4, the Critical Value for p > TBD is TBD. Thus, we can reject the null hypothesis (Ho ) by virtue of the hypothesis test if: Tri–Squared Critical Value of TBD < or > TBD based on the Calculated Tri–Squared Value.
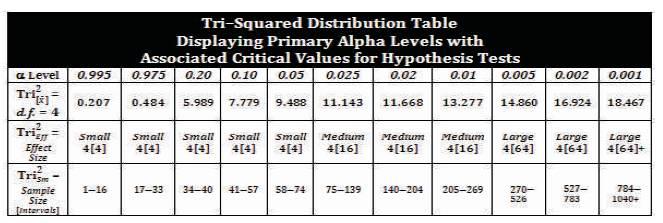
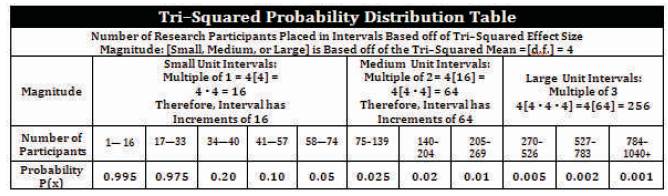
Note: Comprehensive lists of Tri–Squared Tables are available that display and label Critical Values, Alpha Levels, and Sample Sizes based upon all calculated Tri–Squared Effect Sizes. The Tables for Hypothesis Testing and Probability Distribution follow (Figures 9 and 10 respectively). Together these two Tables summarize the entire outcome and relevance of the multi–test application development process that is analyzed through the Tri–Squared Statistical methodology. The “Three by Three Standard Tri–Squared Table is used to determine the precise factors required for the Tri–Squared Hypothesis Test: The Tri–Squared Distribution Table Displaying the: 1) Alpha Level; 2) Effect Size; 3) Sample Size; and 4) Probability in tabular format (as shown in Figures 24 and 25 respectively).
8. Trine Squared [abc2] as the Extension of the Algorithmic Triangulation Model into Coordinates to create the Standard 3 × 3 Tri–Squared Table
The data–enriched and data–immersed Algorithmic Triangulation Model is a mathematical function (the “Triangulus Function”) that yields the rectangular front face or first planar vector of a volumetric cuboid that is derived from squared reversal recursion (literally the process of repeating items in a self–similar way) of the initial Triangulation Model. The Standard 3 × 3 Tri–Squared Table is derived from the 0.5 (one half) section of the front facing of the rectangular planar field which is positioned in the rectilinear vertical upper left–hand corner of the rectangle as a Right Triangle (with associated Cartesian Coordinates x and y).
The relationship between the Algorithmic Triangulation Model (Research Design Conceptual Model) and the Tri–Squared Test (Research Investigation Operational Model) is illustrated in the following series of Figure 26 sequential parameters:
Where, Tri2 = 9xy =  = The Standard 3 by 3 Tri–Squared Table.
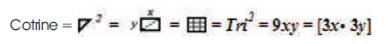
As presented in Figure 26, the rectangular Standard 3 × 3 Tri–Squared Table is a Trine Squared Model. The Trine Squared Model (also called “Cotrine”) = [2 = abc2] and exemplifies the reversal recursion of the Triangulation Model and Triangulus Function to create the Standard 3 × 3 Tri–Squared Table. The reversal recursion of Trine Squared [2] creates a double opposing rectangle of dual Right Triangles that is eternally and equally composed of 18 smaller dual Trichotomous Triangulation Models that creates the 9 cells of the Standard 3 × 3 Tri–Squared Table. The Cotrine Algorithmic Model transforms the dual opposing rectangular Triangulation Models from the individual Triangulation Model ratio into the dual adverse Right Triangles that together create the parallel 9 individual cells (each composed of individual “Microcotrines”) and together collaboratively create the overall rectangular structure which is the Standard 3 × 3 Tri–Squared Table (in the two positive Cartesian Coordinates x and y).
Figure 26. The Sequential Relationships between the Algorithmic Triangulation Model and the Tri–Squared Test
The duality of Cotrine or Trine Squared comes from the nature of the term. It is a portmanteau of the three terms “Collaborate”, “Cooperate”, and “Trine”. It literally means the “Collaborative Cooperative Trine” which is equal to “Trine2”. Trine2 details in Cartesian vectors the research engineering methodology as a cyclic systemic process that defines the in caption, implementation, aggregation, and transformation of inputted qualitative results into outputted quantitative data. This is a transformation of the initial Trine Triangulation Algorithmic Model that has a holistic qualitative ratio of 3:4:5 into the Trine2 Model that has a dual quantitative ratio 3:3 (the 3 of coordinate x is greater in length than coordinate y due to the time differential of vectors x and y) in the respective x and y Cartesian Coordinates (thus, x = 3 and y = 3) to create the Standard 3 × 3 Tri–Squared Tabular format.
Thus, the relationship of Triangulation to Tri–Squared data reporting that transforms the Triangulation Model into the Standard 3 × 3 Tri–Squared Table is explained in the following series of mathematical formulae:
Trine = = Trine for the = The Triangulus Function = abc (The Triangulus Function of abc = 3:4:5 Holistic Qualitative Ratio Defining the entire Tri–Squared Research Engineering Process = The complete form of the Triangulation Model highlighting the vectors x, y, and z in their numeric form (where = 4, = 3, and  = 5) [→] quantitatively transforms into [→] Cotrine = 3:3 ratio = 3 × 3 Tabular Format (where, x = 3 and y = 3) = 2=
  = = Tri2 = 9xy = [3x • 3y].
Cotrine (the squaring of Trine) transforms Trine from the inital 3:4:5 (“x:y:z”) ratios to a more condensed 3:3 (“x:y”) ratio to create a tabular reporting field. This process is referred to as “Cotrining Trine”. Cotrining also creates a dual inverse of the transformed Trine to create the rectangular planar table which is then dilated by a factor of 3 for the purposes of reporting all of the research outcomes of the Tri–Squared Test. The Cotrine Algorithmic Model is extracted from the end of the aforementioned mathematical formulae and presented for purposes of simplification in the following series of sequential equations:
The Cotrine Cartesian Coordinate Model illustrates the above equation as it dilates into the Standard 3 × 3 Tri–Squared Table by a factor of three as follows in Figure 27.
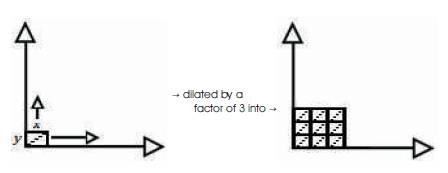
Figure 27. The Cotrine Cartesian Coordinate Models
On a larger scale, the Cotrine Cartesian Coordinate Model is dilated into the Standard 3 × 3 Tri–Squared Table by a factor of three in the following manner in Figure 28.
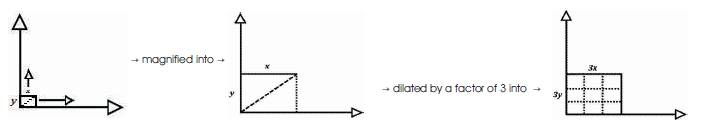
Figure 28. The Scalar Sequential Cotrine Cartesian Coordinate Models
Thus,
Where, Tri2 = 9xy = = The Standard 3 by 3 Tri–Squared Table.
Note: The 9 “Microcotrines” are of the form: which in turn becomes Table 3 (The Standard 3 × 3 Table of the Tri–Squared Test).
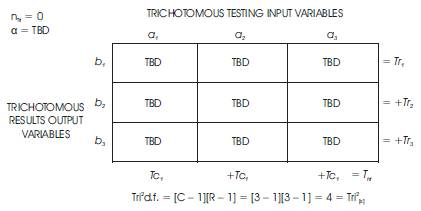
Table 3. The Standard 3 × 3 Table of the Tri–Squared Test
In Table 3, the Tri–Square Test Formula for the Transformation of Trichotomous Qualitative Outcomes into Trichotomous Quantitative Outcomes to Determine the Validity of the Research Hypothesis:
Tri2 = Tsum[(Trix - Triy) 2:Triy].
Tri2 Critical Value Table = TBD (with d.f. = 4 at α = TBD). For d.f. = 4 (a constant as the 3 × 3 Table is static and never changes), the Critical Value for p > TBD is TBD. The calculated Tri–Square value is TBD, thus, the null hypothesis (H0 ) is rejected by virtue of the hypothesis test which yields the following: Tri–Squared Critical Value of TBD < or > TBD based upon the Calculated Tri–Squared Value. To conduct the Tri–Squared calculations, a transformation table is needed that can warehouse the transformed inputted qualitative data into outputted quantitative data. This table is “The Standard 3 × 3 Table Tri–Squared Test Calculations Table”. This table is used to extract and report the transformation from qualitative responses into quantitative outcomes so that the Tri–Squared Test calculation can take place (to determine the outcome of the Tri–Squared Hypothesis Test). This Table has more of a functional calculation capacity and can be but is not always reported in the final draft of the Tri–Squared reporting documentation (which can be but is not limited to: research reports, research articles, research white papers, comprehensive cumulative measurements, etc.).
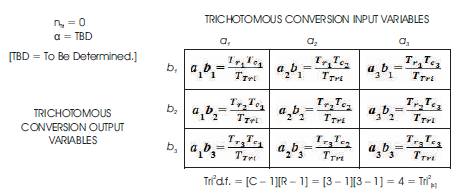
Table 4. The Standard 3 × 3 Table Tri–Squared Test Calculations
The Tri–Square Test Formula for the Transformation of Trichotomous Qualitative Outcomes into Trichotomous Quantitative Outcomes to Determine the Validity of the Research Hypothesis:
Tri2 = Tsum[(Trix - Triy) 2:Triy].
Tri2 Calculated Tri–Squared = [0] + [0] + [0] + [0] + [0] + [0] + [0] + [0] + [0] = 0 (with d.f. = 4, which is permanently static as the Tri–Squared Test does not change, at α = TBD, alpha level is based upon the predetermined research design and sample size). For d.f. = 4, the Critical Value for p > TBD is TBD. Thus, we can reject the null hypothesis (H0 ) by virtue of the hypothesis test if: Tri–Squared Critical Value of TBD < or > TBD based on the Calculated Tri–Squared Value.
Note: Comprehensive lists of Tri–Squared Tables are available that display and label Critical Values, Alpha Levels, and Sample Sizes based upon all calculated Tri–Squared Effect Sizes. The Tables for Hypothesis Testing and Probability Distribution follow (Figures 9 and 10 respectively). Together these two Tables summarize the entire outcome and relevance of the multi–test application development process that is analyzed through the Tri–Squared Statistical methodology.
9. The Application of the Triangulation Model: A Rationale for the Psychometrics of Trichotometric Analysis
The process of designing instruments for the purposes of assessment and evaluation is called “Psychometrics”. Psychometrics is broadly defined as the science of psychological assessment (Rust & Golombok, 1989). The Tri–Squared Test pioneered by the author, factors into the research design a unique event–based “Inventive Investigative Instrument”. This is the core of the Trichotomous–Squared Test. The entire procedure is grounded in the qualitative outcomes that are inputted as Trichotomous Categorical Variables based on the Inventive Investigative Instrument. The specific assessment of the variables is completely dependent upon the outcomes determined by the researcher's instrument. The creation, production, and deployment of the Inventive Investigative Instrument requires that the research investigator adopts the role of a “Trichotomous Psychometrician” or “Trichotometrician”. A “Trichotomous Psychometrician” is an Educational Scientist that uses trichotomous–based psychometrics to develop a qualitative Inventive Investigative Instrument specifically designed capture qualitative responses during a specific event. A description of the entire Tri–Squared research process follows and is described in detail so that the reader is informed of precisely how an Inventive Investigative Instrument is developed, designed, and ultimately implemented.
10. The Procedures of Trichotometric Analysis: The Steps of the Tri–Squared Test
The Tri–Squared research methodology: A four step process for determining the appropriate Research Effect Size, Sample Size, and Alpha Level (Osler, 2012). The Tri–Squared research procedure consists of a four step approach designed to provide the researcher with a clear and precise set of data to conduct research, analyze data, and determine the level of significance required to either validate or reject the initial research hypothesis. The four Tri–Squared steps are as follows:
- Design of an Inventive Investigative Instrument that has Trichotomous Categorical Variables and Trichotomous Outcome Variables.
- Establish the Research Effect Size, Sample Size with associated Alpha Level.
- Establish Mathematical Hypotheses.
- Use the Tri–Squared Test as the Data Analysis Procedure following implementation.
11. The Tri–Squared Research Design
Step One: Design of an Inventive Investigative Instrument that has Trichotomous Categorical Variables and Trichotomous Outcome Variables.
Step Two: Establish the Research Effect Size, Sample Size with associated Alpha Level. Using the: The Tri–Squared Effect Size Formula =
Tri2Eff =[TCR- (TCTR:nTri2)]:CSR< sub>S9nTri2-1)
Step Three: Establish Mathematical Hypotheses. Sample Tri–Squared Mathematical Hypotheses:
Ho:Tri2 =0
Ho:Tri2 ≠0
Step Four: Use the Tri–Squared Test as the Data Analysis Procedure following implementation.
Conclusion
The purpose of this paper is to provide support for the use of the Tri–Squared Test in terms of the Triangulation of its Research Engineering methodology. The Tri–Squared Test Algorithmic Model and associated Statistical Methodology were provided to illustrate and display how this method can be put to use both practically and rapidly. The Total Transformative Trichotomy–Squared Research Design Methodology is a universally applicable in–depth investigative procedure that is an ideal way of examining the unique, diverse, and many times specialized procedures inherent to a variety of research models and investigative inquiry. Qualitative outcomes can be transformed into measurable quantitative outcomes to determine the outcome of research hypotheses. Both qualitative and quantitative methods are seamlessly incorporated into a unified data analysis methodology that delivers a reporting procedure that specifically aligns with the initial research objectives, hypotheses, and variables of the investigator. This method of statistical analysis allows the researcher to use an integration of qualitative and quantitative research methodologies by seamlessly combining the two opposing branches of research investigation for maximized statistical power. This provides “Eduscientists” with a discrete and comprehensively stringent data analysis tool that is purely objective, extremely reliable, and very valid. Thus, investigative inquiry will grow, the body of knowledge will continue to expand, thereby empowering present and future generations of researchers.
References
[1]. Apostol, T. M. (1967). Calculus, Second Edition, Volume One: One-variable Calculus, with an Introduction to Linear Algebra. Waltham, MA: Blaisdell.
[2]. Kant, I. (2007). Critique of Pure Reason (based on Max Müller's translation). P. Classics a Division of Pearson PLC. New York, NY.
[3]. Orlich, et al. (2004). Teaching Strategies: A Guide to Effective Instruction. Houghton Mifflin. Boston, Mass.
[4]. Osler, J. E. (2013a). “The Psychometrics of Educational Science: Designing Trichotomous Inventive Investigative Instruments for Qualitative and Quantitative for Inquiry”. i- manager's Journal on School Educational Technology. Vol.8, No.3, Print ISSN 0973-2217, E-ISSN 2230-7133, pp.15-22.
[5]. Osler, J. E. (2013b). “The Psychological Efficacy of Education as a Science through Personal, Professional, and Contextual Inquiry of the Affective Learning Domain”. i-manager's Journal on Educational Psychology, Vol.6, No.4, Print ISSN 0973-8827, E-ISSN 2230-7141, pp.36-41.
[6]. Osler, J. E. & Waden, C. (2012). “Using Innovative Technical Solutions as an Intervention for At Risk Students: A Meta–Cognitive Statistical Analysis to Determine the Impact of Ninth Grade Freshman Academies, Centers, and Center Models upon Minority Student Retention and Achievement”. i- manager's Journal on School Educational Technology, Vol. 8, No.2, Print ISSN 0973-2217, E-ISSN 2230-7133, pp.11-23.
[7]. Osler, J. E. (2012). “Trichotomy–Squared – A novel mixed methods test and research procedure designed to analyze, transform, and compare qualitative and quantitative data for education scientists who are administrators, practitioners, teachers, and technologists”. i-manager's Journal on Mathematics, Vol.1, No.3, Print ISSN 2277-5129, E-ISSN 2277-5137, pp.23-32.
[8]. Rust, J. & Golombok, S. (1989). Modern Psychometrics: The Science of Psychological Assessment (2nd ed.). Florence, KY, US: Taylor & Frances/Routledge.
[9]. Sensagent, (2012). Retrieved, May 9, 2012: http://dictionary.sensagent.com/trichotomy+ (mathematics)/en-en/
[10]. Singh, S. (1997). Fermat's Enigma: The Epic Quest to Solve the World's Greatest Mathematical Problem. A. Books-a Division of Random House. New York, NY.
[11]. Singh, S. (2002). Fermat's Last Theorem. Hammersmith, London, UK: Harper Collins Paperback.