Trichotomy–Squared – A Novel Mixed
Methods Test And Research Procedure Designed To
Analyze, Transform, And Compare Qualitative And
Quantitative Data for Education Scientists Who
Are Administrators, Practitioners, Teachers,
and Technologists
Abstract
This monograph provides an active discourse and overview on a new and innovative research methodology that
incorporates, infuses, and integrates the best of qualitative and quantitative data analysis. It combines, compares, and
analyzes data to determine the validity of the research hypothesis through a dynamic and investigative strategy. This
strategy can be used as a practical model for in–depth investigations in education and the social behavioral sciences.
The innovative field of “Education Science” is defined and described which makes use of the Trichotomy–Squared Test
and its associated research methodology.
Keywords :
- Trichotomy,
- Tri–Squared,
- Education Science,
- Eduscience,
- Statistics,
- Data Analysis.
Introduction
Many statistical measures used in education are experimental research designs that require strict scientific methodologies.
Many of these methods cannot be implemented in educational institutions without violating legal policies or severely
disturbing the learning environment. The time has come for education to provide its own scientific field that has its own
measures. This novel field should be grounded in longstanding educational research, fundamental educational theory, and
innovations in qualitative, quantitative, and mixed methods research designs native to the specifics of pedagogy and
andragogy. This paper provides a definition for the establishment of this new field called: “Education Science”. A
comprehensive statistical test for the field of Education Science is Trichotomy–Squared.
Education Science
The field of “Education Science” is also represented by the term “Eduscience” which is a portmanteau of the two terms
“Education” and “Science”. Similar to the field of “Bioscience”, Eduscience is the study of education wherein applicable
sciences (such as ergonomics, statistics, technology, etc.) are applied to enhance and improve learning. The primary
purpose of the field of Eduscience is the study and application of solutions to improve and enhance the learning
environment and learning in general. Eduscience is solution–driven and is actively concerned with the transfer and
dissemination of knowledge.
Education Science is a broad field and its professionals are directly involved in the field. Those who are actively involved in
Eduscience can be referred to as “Education or Educational Scientists”. Educational Scientists or “Eduscientists” are
multifaceted professionals in a variety of areas of expertise. They can assume many or multiple roles in the educational
environment and can serve in a variety of offices or in a multitude of capacities. The primary positions in the learning
environment that Eduscientists assume are in the following areas: Administration (which includes Leaders, Organizational Heads, and Organizational Management Professionals), Instruction (which includes Teachers, Professors, and Facilitators),
Practice (which includes Practitioners in a variety Specified Areas and Arenas), and Technology (which includes Educational
Technologists, Instructional Technologists, and Information Technologists). In these positions Eduscientists effectively use,
analyze, study, and deploy novel instructional and learning theories, methodologies, strategies, solutions, tools, and
techniques in both traditional or virtual pedagogical and adragogical settings to bring about learning. Educational
Scientists strive to make the process of knowledge transfer transitive. A transitive knowledge transfer process is seamless and
as harmonious as possible in an effort to empower, enhance, and improve learning.
Eduscientists are masters of teaching who also are also highly proficient practitioners who are able draw from personal and
professional experiences to make the learning environment more viable (Accessible), usable (Ergonomic), teachable
(Instructional), engaging (Relevant), approachable (Adaptive), exploration–based (Discovery), and inspirational
(Transformative). The Total Transformative Trichotomy–Squared Test is a comprehensive multi–step research methodology that is
employed by Eduscientists. It is especially designed to conduct qualitative and quantitative investigations in education.
“Trichotomy” Origins
The term is pronounced ['trahy-kot-uh-mee'], spelled “trichotomy”, and is a noun with the plural written form “trichotomies”. A
“Trichotomy” in terms of philosophy can be referred to as a threefold method of classification. Philosopher Immanuel Kant
adapted the Thomistic acts of intellect in his trichotomy of higher cognition — (a) understanding, (b) judgment, (c) reason —
which he correlated with his adaptation in the soul's capacities — (a) cognitive faculties, (b) feeling of pleasure or displeasure,
and (c) faculty of desire — of Tetens's trichotomy of feeling, understanding, will. (Teo, 2005). In terms of mathematics, Apostol in
his book on calculus defined “The Law of Tricohotomy” as: Every real number is negative, 0, or positive. The law is sometimes
stated as “For arbitrary real numbers a and b, exactly one of the relations a < b, a = b, and a > b holds” (Apostol, 1967)
It is important to note that in mathematics, the law (or axiom) of trichotomy is most commonly the statement that for any
(real) numbers x and y, exactly one of the following relations holds. Until the end of the 19th century the law of trichotomy was
tacitly assumed true without having been thoroughly examined (Singh, 2002). A proof was sought by Logicians and the law
was indeed proved to be true. If applied to cardinal numbers, the law of trichotomy is equivalent to the axiom of choice.
More generally, a binary relation R on X is trichotomous if for all x and y in X exactly one of xRy, yRx or x = y holds. If such a
relation is also transitive it is a strict total order; this is a special case of a strict weak order. For example, in the case of three
elements the relation R given by aRb, aRc, bRc is a strict total order, while the relation R given by the cyclic aRb, bRc, cRa is a
non–transitive trichotomous relation. In the definition of an ordered integral domain or ordered field, the law of trichotomy is
usually taken as more foundational than the law of total order, with y = 0, where 0 is the zero of the integral domain or field. In
set theory, trichotomy is most commonly defined as a property that a binary relation < has when all its members  satisfy exactly one of the relations listed above. Strict inequality is an example of a trichotomous relation in this sense.
Trichotomous relations in this sense are irreflexive and antisymmetric (Sensagent, 2012).It is from these logical and mathematical definitions that the author derives the definition of “Research Trichotomy” and applies it to the qualitative and
quantitative analysis of the affective domain of learning.
satisfy exactly one of the relations listed above. Strict inequality is an example of a trichotomous relation in this sense.
Trichotomous relations in this sense are irreflexive and antisymmetric (Sensagent, 2012).It is from these logical and mathematical definitions that the author derives the definition of “Research Trichotomy” and applies it to the qualitative and
quantitative analysis of the affective domain of learning.
The term “Trichotomy” is defined in Trichotomy–Squared in the following manner: “Trichotomy”: is pronounced ['trahy-kot-uhmee'],
spelled “trichotomy”, and is a noun with the plural written form “trichotomies”. “Trichotomy” has the following threefold
definition: (1) Separation or division into three distinct parts, kinds, groups, units, etc.; (2) Subdivision or classification of some
whole into equal sections of three or “trifold segmentation”; and (3) Categorization or division into three mutually exclusive,
opposed, or contradictory groups, for example – “A trichotomy between thought, emotions, and action.”
Tri–Squared Foundations
Tri–Squared comprehensively stands for the “Total Transformative Trichotomous–Squared Test” (or “Tri–Squared”). The Total Transformative Trichotomous–Squared Test provides a methodology for the transformation of the outcomes from qualitative
research into measurable quantitative values that are used to test the validity of hypotheses. The advantage of this research
procedure is that it is a comprehensive holistic testing methodology that is designed to be static way of measuring
categorical variables directly applicable to educational and social behavioral environments where the established
methods of pure experimental designs are easily violated. The unchanging base of the Tri–Squared Test is the 3 × 3 Table
based on Trichotomous Categorical Variables and Trichotomous Outcome Variables. The emphasis on three distinctive
variables provides a thorough and rigorous robustness to the test that yields enough outcomes to determine if differences
truly exist in the environment in which the research investigation takes place.
Tri–Squared is grounded in the combination of the application of the research by two mathematical pioneers and the
author's research on two dimensional foundational and three dimensional Instructional Design. The aforementioned
pioneers in mathematical research includes the original dissertation of optical pioneer Ernst Karl Abbe who derived the
distribution (Abbe, 1863) that would later become known as the chi square distribution and the original research of
mathematician Auguste Bravais who pioneered the initial mathematical formula for correlation in his research on
observational errors (Bravais, 1846).. The Tri–Squared research procedure uses an innovative series of mathematical
formulae that do the following as a comprehensive whole: (1) Convert qualitative data into quantitative data; (2) Analyze
inputted trichotomous qualitative outcomes; (3) Transform inputted trichotomous qualitative outcomes into outputted
quantitative outcomes; and (4) Establish an effect size and corresponding sample size with an associated alpha level to test
the validity of an established research hypothesis.
The basis of Tri–Squared is similar to the Meta–Cognitive Analysis method of Snell and Marsh that was designed to replace
Meta–Analysis as a more effective means analyzing data in the social and behavioral sciences (Snell & Marsh, 2003).
Interestingly enough, the Chi–Square Test that is used in Meta–Cognitive Analysis was implemented by Karl Pearson who
credited Ernst Karl Abbe with the original discovery of the mathematics of that led to the Chi Square distribution and the
subsequent test. Tri–Squared differs from Chi–Square in its complete use of trichotomy as criterion values. It also differs in its
infusion of the sample size and subsequent alpha level in its initial calculations (thereby enabling the educational scientist to
calculate effectively and determine statistical significance rapidly based of off the initial research conditions).
To effectively use Tri–Squared in a research investigation one must first develop a series of “trichotomous categorical
variables” based on associated “trichotomous outcome variables”. This is the first initial and crucial step to using Tri–Squared
as a valid, reliable, and objective means of analyzing data. Second, a specific “trichotomy-engineered” or “Inventive” (i.e.,
original) Investigative Instrument must be created and implemented based on the initial trichotomous categorical variables
and outcomes. This insures that the research investigation is consistent throughout the study and that the later Tri–Squared
computations are validly reporting what actually took place in the research environment. The “Inventive Investigative
Instrument” can be psychometrically delivered as a test, qualitatively delivered in the form of a research questionnaire,
provided anonymously as a survey, given as in–depth questions during an interview, or evaluated as a comprehensive
metric via an assessment rubric. As long as the trichotomous categorical variables are measured according to the
established associated trichotomous outcome variables then the research has merit within the strict confines and rigorous
requirements of the Tri–Squared Test.
The Tri–Squared statistic transforms qualitative data into quantitative data and then measures the difference between the
two to determine the validity of the initial research hypothesis. If no relationship is determined to exist between the qualitative
and quantitative trichotomous categorical and outcome variables, then the Tri–Squared statistic equals zero. Adversely, the
greater the relationship between the variables, the greater the value will be of the final Tri–Squared calculation. Statistics by
nature is a methodical and selective science that requires specific and precise steps and it is cautious when dealing with
uncertainty. Thus, Tri–Squared is very comprehensive in its structure taking into account: an exact number of measures, rigorous mathematical accountability through trichotomous metrics, precision in determining the research study effect size,
specification in determining the ideal research sample size, and strict methodology in hypothesis testing.
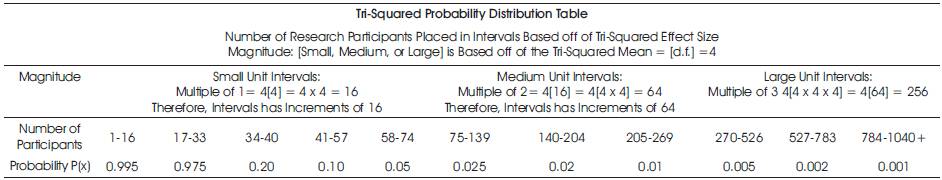
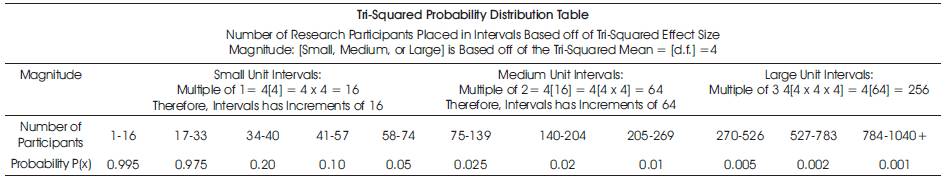
1. The Tri–Squared Distribution
The Tri–Squared distribution is a static mathematical extraction out of the Chi Square distribution. This test is not the only test
based on the Chi Square distribution (as it is a mathematical distribution that is frequently used directly or indirectly in many
tests of significance). Similar to the Chi Square distribution the Tri–Squared distribution has the following characteristics: (1) It
has only a single parameter (the distribution Degrees of Freedom written as “d.f.”); (2) The entire distribution is positively
skewed; and (3) The Degrees of Freedom are mathematically written, “[C – 1][R – 1]” which is equal to the distribution mean.
Unlike, the Chi Square distribution the Tri–Squared distribution has the following characteristics: (1) The distribution Degrees of
Freedom never changes, therefore, it never approaches the Normal Gaussian Distribution (the bell curve); (2) As a static test
the Tri–Squared Degrees of Freedom is always [C – 1][R – 1] = [3 – 1][3 – 1] = [2][2] = 4 = the distribution mean; (3) The
distribution mode is always [d.f. – 2] = [4 – 2] = 2; (3) The distribution median is always approximates [d.f. – 0.7] = [4 – 0.7] =
3.3; (4) Due to the static or unchanging nature of the distribution, the distribution skew is always positive with the d.f. always
equaling 4; and (5) The distribution formulae uses brackets “[ ]” (similar to the science of chemistry) in its formulaic notations to
emphasize and imply “concentration” or “a concentration on” for purposes of clarity. The Tri–Squared distribution is the
foundation for the Tri–Squared Test which comprehensively incorporates the following Tri–Squared formulae: The Calculated
Column Standard Deviation, The Calculated Row Standard Deviation, and The Sample Effect Size. The Tri–Squared Test is
designed to create a comprehensive holistic research methodology from calculations conducted on the Standard 3 × 3
Tri–Squared Table which produces the following: (1) A positive result; (2) No information on the variable relationship direction;
and (3) Associated Effect Size, Sample Size, and Alpha Levels.
2. The Tri–Squared Research Design Methodology: A Four Step Process
Step One: Design of an Inventive Investigative Instrument that has Trichotomous Categorical Variables and Trichotomous
Outcome Variables.
To effectively use Tri–Squared in a research investigation the researcher must first develop a series of trichotomous
categorical variables based on associated trichotomous outcome variables. This is the first initial and crucial step to using
Tri–Squared as a valid, reliable, and objective means of analyzing data. Second, an “Inventive Investigative Instrument”
must be created and implemented in a manner compliant with the initial trichotomous categorical variables and
outcomes stated at the outset of the research investigation. This insures that the research investigation is consistent
throughout the study and that the later Tri–Squared computations are validly reporting what actually took place in the
research environment during the time period in which the actual study was conducted. As previously stated the “Inventive
Investigative Instrument” can be psychometrically delivered as a test or qualitatively delivered in the form of a research
questionnaire, survey, interview or another type of data acquiring metric. As long as the trichotomous categorical variables
are measured according to the established associated trichotomous outcome variables then the research has merit within
the confines and strict requirements of the Tri–Squared Test.
Step Two: Establish the Research Effect Size, Sample Size with associated Alpha Level.
The Tri–Squared Effect Size Comprehensive Analytical Mathematical Formula
The Comprehensive Mathematical Formula of the Standard Deviation for the Standard 3 × 3 Tri–Squared Table Columns
The Comprehensive Mathematical Formula of the Standard Deviation for the Standard 3 × 3 Tri–Squared Table Rows
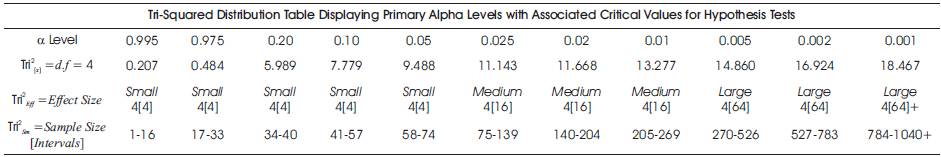
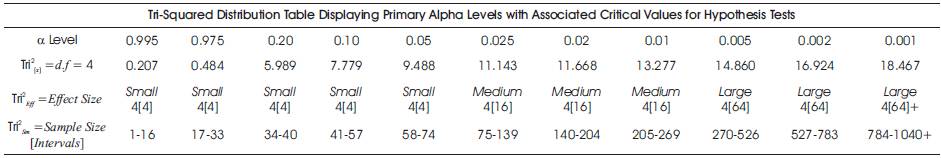
The Comprehensive Tri–Squared Formulae Definitions for the Standard 3 × 3 Tri–Squared Table
The result of the Tri–Squared Effect Size for the Standard 3 × 3 Tri–Squared Table is calculated to be 0.125. This means that an
alpha level of 0.10 is the standard for Tri–Squared hypothesis test for a research investigation designed to have a small
sample size (specifically identified as 41 to 57 participants for = 0.10). This is further illustrated in the following Tri–Squared
Distribution Two–Tailed Mathematical Hypotheses and Standard Tri–Squared 3 × 3 Tabular Format Data Analysis
Computation Methodology (Table V):
Step Three: Establish Mathematical Hypotheses.
Two–Tailed Mathematical Hypotheses for the Tri–Squared Test
Step Four: Use the Tri–Squared Test as the Data Analysis Procedure following implementation.
This is the final step in the Tri–Squared Test. An example of the research design reporting methodology follows in the Standard
Tri–Squared 3 × 3 Tabular Format.
Sample Outcomes of the Computational Tri–Squared Test
Figure 1 shows the Sample Trichotomy–Squared Test illustrating the standard 3 × 3 Tri–Squared Formula and qualitative table
of outcomes reporting results using the standard Tri–Squared 3 × 3 Format. Sample data analyzed using the Trichotomous–Squared Three by Three Table was designed to analyze the research questions from an Inventive Investigative
Instrument with the following Trichotomous Categorical Variables: a1 = Cognitive [Knowledge]; a2 = Affective [Dispositions];
and a3 = Psychomotor [Skills]. The 3 × 3 Table has the following Trichotomous Outcome Variables: b1 = Affirmative [Yes]; b2 =
Negative [No]; and b3 = Inapplicable [Irrelevant]. The Inputted Qualitative Outcomes are reported as follows:

Figure 1. Sample Outcomes of the Computational Tri–Squared Test
The Tri–Square Test Formula for the Transformation of Trichotomous Qualitative Outcomes into Trichotomous Quantitative
Outcomes to Determine the Validity of the Research Hypothesis:
Tri2 Critical Value Table = 7.779 (with d.f. = 4 at α = 0.10). The calculated Tri–Square value is 8.180, thus we can reject the null
hypothesis by virtue of the hypothesis test which yields the following: Critical Value of 7.779 < 8.180 the Calculated Value.
Table One illustrates the mathematical application and statistical analysis of the Trichotomous–Squared (also referred to as
“Total Transformative Trichotomy–Squared”, or more simply as “Trichotomy–Squared”, “Tri–Squared” or “Tri–Square”)
procedure using sample data. “Tri–Squared” is the mathematical transformation of qualitative data into quantitative data
for the purpose of validating a research hypothesis. The paragraph that immediately follows the Table reports the Table's
findings (which would appear in this sample paragraph). It is important to note that a researcher is not limited to the standard
calculated sample size in from the base calculation in the range of 41–57 participants and may select a larger sample size
and associated alpha level based upon research design and needs. The mathematical formula for Trichotomy–Squared
can be broken down into specific components or “elements” that illustrate the value of the entire trichotomous research
design methodology. These same elements illustrate and validate the process of transforming qualitative data into
quantitative data as a means of true in–depth mixed methods for the purposes of discrete data analysis. To provide a
clearer understanding of the Trichotomous Tri–Squared Test as a Total Transformative Trichotomy the following elements of
the Tri–Squared formula are provided with their specific meanings:
The Comprehensive Tri–Squared Test Mathematical Computational Formulae Definitions
Definition of the Trichotomous–Squared formula provides the foundation for a more detailed definition of the mathematical
formula which is: “Trichotomy–Squared is equal to the total summation of the concentrated ratio of trichotomous qualitative
outcomes with transformed transitive trichotomous quantitative outcomes subtracted from trichotomous quantitative outcomes squared.” This can be simplified into, “Tri–Squared is the total concentrated sum of the ratio of the square of the
difference between inputted qualitative outcomes and associated outputted quantitative outcomes” (Figure 2).

Figure 2. A Graphical Model Representing the Standard Tri–Squared Distribution

Table 1. The Effect Size Table for the Standard 3 × 3 Table from the Tri–Squared Effect Size Formula
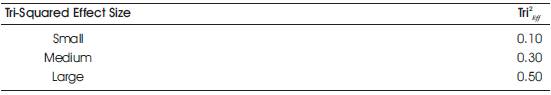
Table 2. The Outcome of the Tri–Squared Effect Size Formula on the Tri–Squared Effect Size Table
Conclusion
The advent of Education Science heralds a new day of independence in education. Education is no longer regulated to
defining its research methods by the tools and techniques of other disciplines. Often the statistical measures that are
currently in use do not match the specific needs or requirements of the educational learning environment. The Tri–Squared
Test exemplifies this new movement towards research independence by effectively empowering the field of Eduscience.
The Total Transformative Trichotomy–Squared Research Design Methodology is a universally applicable in–depth
investigative procedure that is an ideal way of examining the unique, diverse, and many times small educational and social
behavioral settings that are a part of academia. This process allows researchers to validate qualitative methods by
transforming data into measurable quantitative outcomes. Both qualitative and quantitative methods are seamlessly
incorporated into a unified data analysis methodology that delivers a reporting procedure that specifically aligns with the
initial research objectives, hypotheses, and variables. This method of statistical analysis resolves the age old issue of choice
between qualitative or quantitative research designs. It does so by seamlessly combining the two opposing branches of
research for maximized statistical power. This provides Educators, Practitioners, Technologists, and Social and Behavioral
Scientists with a discrete comprehensively stringent data analysis tool that is purely objective, extremely reliable, and very
valid. All of the latter are critical components for the acceptance of novel research in the academy and places added value
on investigative research in specified academic disciplines. Tri–Squared is designed to empower 21st Century researchers who
are seeking statistical tools that validate their research. It enables investigations designed for educational institutions, specialized
environments, and distinctive situations. It illustrates the value of analyzing small groups, sample sizes, and individuals without
sacrificing statistical power or the value of research due to the uniqueness of the environment under examination. This novel
tool effectively validates the new and emerging field of Educational Science by undergirding it in a comprehensive
methodology of qualitative and quantitative data analysis. This thereby insures that future research has a well–grounded
foundation from which new and innovative investigative methods can draw upon. Thus allowing researchers in the future to
extend their investigations into new and groundbreaking vistas that will not only improve education but learning as a whole.
References
[1]. Abbe, E.K. (1863). Über die gesetzmässigkeit der vertheilung der fehler bei beobachtungsreihen. Hab. schrift, Jena.
[2]. Apostol, T.M. (1967). Calculus, second edition, Volume one: One-variable calculus, with an introduction to linear
algebra. Waltham, MA: Blaisdell.
[3]. Bravais, A. (1846). Analyse mathématique sur les probabilités des erreurs de situation d'un point. Mémoires présentés par
divers savants à l'Académie royale des sciences de l'Institut de France. Paris, France: 9, 255-332.
[4]. Sensagent, (2012). Retrieved, May 9, 2012: http://dictionary.sensagent.com/trichotomy+(mathematics)/en-en/
[5]. Singh, S. (2002). Fermat's last theorem. Hammersmith, London, UK: Harper Collins Paperback.
[6]. Snell, J.C. & Marsh M. (2003). Meta–cognitive analysis: an alternative to literature reviews and meta–analysis for the
sciences and the arts. Education, Vol. 124. Winter, 2003.
[7]. Teo, T. (2005). The critique of psychology: from Kant to postcolonial theory. New York, NY: Springer Science+Business
Media, Inc.