
This monograph provides an epistemological rational for the Trinova Post Hoc test methodology. Trinova is an in–depth [Trichotomous Nomographical Variance] statistical procedure for the internal testing of the transformative process of qualitative data, into quantitative outcomes through the Tri–Squared Test first introduced in i-manager’s Journal on Mathematics, and further detailed in i-manager’s Journal of Educational Technology, i-manager’s Journal on School Educational Technology, and in i-manager’s Journal on Educational Psychology. Trinova is an advanced statistical measure that is designed to check the validity and reliability of a Tri–Squared Test. This is a novel approach to advanced statistical post hoc Tri–Squared data analysis. It adds considerable value to the mixed methods approach of research design that involves the holistic combination and comparison of qualitative and quantitative data outcomes. A sequential Trinova mathematical model is provided, that illustrates the entire process of advanced statistical Trichotomous inquiry.
The term “Nomograph” (also referred to as a “Nomogram”) is a graphic representation of the numerical relations of a system. A nomograph enables a researcher to determine the relationship between a dependent variable and an independent variable through graphic illustrations. A good example of a nomograph is a graph, table, or chart that enables a researcher to measure in increments, a research study dependent variable in “y” Cartesian Coordinates and compare them to the research independent variables in “x” Cartesian Coordinates. In terms of the Post Hoc TRINOVA statistic, the “Trichotomous Nomograph” is represented by the Comprehensive TRINOVA Analysis Calculation Nomograph. The acronym TRINOVA literally stands for “Trichotomous Nomographical Variance” with the “TRI” representing an abbreviated form of the term “Trichotomous”; “NO” representing an abbreviated form of the term “Nomographical”; and “VA” representing an abbreviated form of the term “Variance”.
Nomographics has historically been used in a variety of research designs, mathematics, and statistical models to provide graphical solutions to a variety of complex problems. For example in his research article “Nomographical Determination of the Complex and Real Roots of the Stability of Biquadratic Equations” Katuhiko Morita provides a graphically dynamic series of solutions to biquadratic problems. Morita presented a dual solution in detailed graphical format and an accompanying mathematical rationale (using matrix algebra) as a full–nomographic mathematical methodology for calculating biquadratic equations (Morita, 1952). Researchers Stang and Taylor (1961) used nomographical analysis methods in their investigation entitled,“The Prediction of Thermal Hazards in Propellants by a Nomographical Technique” for the United States Navy. Nomographical instrumentation was used by G. F. Hamilton (1944) in his research on“The cranial capacity of the living, calculated automatically by a nomographical instrument”. Lastly, the field of engineering has historically used nomography to solve problems involving invention, design, building, and areas of maintenance to improve structures, machines, devices, systems, materials and processes. An example of this is engineer Morris Ojalvo's 1965 research regarding, “The Use of Nomography in the Solution of Beam-column Problems” at Princeton University, New Jersey in the Department of Graphics and Engineering Drawing. Ojalvo sought to use nomography to resolve the pertinent set of conditions for a buckling column when the nature of the equilibrium changes may be expected to include column length, shape of cross section, mechanical properties of the material, compressive load, and end movement (Ojalvo, 1965).
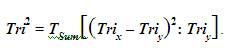
Tri–Square or Tri–Squared comprehensively stands for “The Total Transformative Trichotomous–Squared Test” (or “Trichotomy–Squared”). The Total Transformative Trichotomous–Squared Test provides a methodology for the transformation of the outcomes from qualitative research into measurable quantitative values that are used to test the validity of hypotheses. It is based on the mathematical “Law of Trichotomy”. In terms of mathematics, Apostol in his book on calculus defined “The Law of Tricohotomy” as: Every real number is negative, 0, or positive. The law is sometimes stated as “For arbitrary real numbers a and b, exactly one of the relations a
It is important to note that in mathematics, the law (or axiom) of trichotomy is most commonly the statement that for any (real) numbers x and y, exactly one of the following relations holds. Until the end of the 19th century, the law of trichotomy was tacitly assumed true without having been thoroughly examined (Singh, 1997). A proof was sought by Logicians and the law was indeed proved to be true. If applied to cardinal numbers, the law of trichotomy is equivalent to the axiom of choice. More generally, a binary relation R on X is trichotomous if for all x and y in X exactly one of xRy, yRx or x = y holds. If such a relation is also transitive, it is a strict total order; this is a special case of a strict weak order. For example, in the case of three elements, the relation R given by aRb, aRc, bRc is a strict total order, while the relation R given by the cyclic aRb, bRc, cRa is a non–transitive trichotomous relation. In the definition of an ordered integral domain or ordered field, the law of trichotomy is usually taken as more foundational than the law of total order, with y = 0, where 0 is the zero of the integral domain or field. In set theory, trichotomy is most commonly defined as a property that a binary relation < has when all its members,
The foundational idea of a “Trichotomy” has a detailed long history that is based on discussions surrounding higher cognition, general thought and descriptions of intellect. Philosopher Immanuel Kant (2007) adapted the Thomistic acts of intellect in his trichotomy of higher cognition:
The Total Transformative Trichotomous–Squared Test provides a methodology for the transformation of the outcomes from qualitative research into measurable quantitative values that are used to test the validity of hypotheses. The advantage of this research procedure is that it is a comprehensive holistic testing methodology that is designed to be static way of holistically measuring categorical variables directly applicable to educational and social behavioral environments where the established methods of pure experimental designs are easily violated. The unchanging base of the Tri–Squared Test is the 3 × 3 Table based on Trichotomous Categorical Variables and Trichotomous Outcome Variables. The emphasis on the three distinctive variables provides a thorough rigorous robustness to the test that yields enough outcomes to determine if differences truly exist in the environment in which the research takes place (Osler, 2013a).
Tri–Squared is grounded in the combination of the application of the research to mathematical pioneers and the author's research in the basic two dimensional foundational approaches that ground further explorations into a three dimensional Instructional Design. The aforementioned research includes the original dissertation of optical pioneer Ernst Abbe who derived the distribution, that would later be known as the chi square distribution and the original research of mathematician Auguste Bravais (1996) who pioneered the initial mathematical formula for correlation in his research on observational errors. The Tri–Squared research procedure uses an innovative series of mathematical formulae that do the following as a comprehensive whole:
The process of designing instruments for the purposes of assessment and evaluation is called “Psychometrics”. Psychometrics is broadly defined as the science of psychological assessment (Rust & Golombok, 1989). The Tri–Squared Test pioneered by the author, factors into the research, design a unique event based “Inventive Investigative Instrument”. This is the core of the Trichotomous–Squared Test. The entire procedure is grounded on the qualitative outcomes that are input as Trichotomous Categorical Variables based on the Inventive Investigative Instrument (Osler, 2013c). Osler (2012a) initially defined the Tri–Squared mathematical formula in the Journal on Mathematics article entitled, “Trichotomy–Squared – A novel mixed methods test and research procedure designed to analyze, transform, and compare qualitative and quantitative data for education scientists who are administrators, practitioners, teachers, and technologists” as follows:
The Tri–Squared distribution is a static mathematical extraction out of the Chi Square distribution. This test is not the only test based on the Chi Square distribution (as it is a mathematical distribution that is frequently used directly or indirectly in many tests of significance). Similar to the Chi Square distribution, the Tri–Squared distribution has the following characteristics:
The Tri–Squared distribution is the foundation for the Tri–Squared Test which comprehensively incorporates the following Tri–Squared formulae. The Calculated Column Standard Deviation, the Calculated Row Standard Deviation, and the Sample Effect Size.The Tri–Squared Test is designed to create a comprehensive holistic research methodology from calculations conducted on the Standard 3 × 3 Tri–Squared Table which produces the following:
It is important to note that the research instrument used in Tri–Squared is an invariant (unchanging) fixed static Test.
In Table 1 TRINOVA seeks to determine the differences in group means for Trichotomous Outcome Variables [Between] and Trichotomous Categorical Variables [Within]. Due to the invariant structure of Trichotomous Inventive Investigative Instruments (are always in a 3 × 3 tabular format) the mean comparisons are in column form. TRINOVA is similar to a 3 × 1 Factor ANOVA in its process of analyzing group means to determine a difference overall in treatment effects. In this case, the researcher is attempting to show the differences in the three Trichotomous Outcome Variables and Trichotomous Categorical Variables to validate the initial results of the post hoc significant Tri–Squared Test (and thereby validate the outcomes of the Inventive Investigative Instrument which were designed and ultimately deployed based upon an overarching research question). In addition, the TRINOVA research methodology also validates the differences in the post hoc 3 × 3 Standard Table mean on the between and within Trichotomous Outcomes of the initially significant Tri–Squared Test.
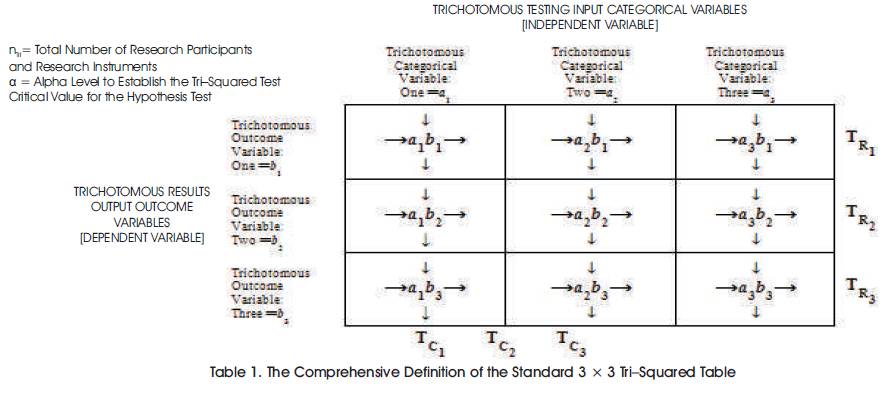
Table 1. The Comprehensive Definition of the Standard 3 × 3 Tri–Squared Table
Components of the post hoc advanced statistical TRINOVA research design are as follows:
Where,
nTsq = The Total number of Tri–Squared 3 × 3 Standard Table Cells = 9
Tri2R=C = The number of Tri–Squared 3 × 3 Standard Table [Rows = Columns] = 3


Note: From the above Equation, the following example is representative of a single individual portion of the formula and is therefore true of the two portions of the equation:


d.f. = TRINOVA “Degrees of Freedom”.
The Trivariant Analysis Research Hypotheses are based upon three different groups of research questions drawn from an overall overarching research question (the universal dependent variable), that formulates the Tri–Squared Inventive Investigative Instrument (according to the Inventive Investigative Instrument Invariant Equation). The Inventive Investigative Instrument includes 3 groups of instrument items that are of the following form: Group 1 Row Outcomes of 3× 3 Standard Tri–Squared Table Cells versus Group 2-Row Outcomes of 3× 3 Standard Tri–Squared Table versus Group 3-Row Outcomes of 3× 3 Standard Tri–Squared Table Cells. All three groups of Row Trichotomous Outcome Variables are equal because nTSq = 9 is the same for the entire research instrument Tri–Squared Standard 3 × 3 Table which is the research data analysis procedure provided during the data aggregation of the research investigation (because all participants answered the same set of questions on different aspects of the universal dependent variable, thus, nTSq is equal for all three groups of Inventive Investigative Instrument items).
H0 : There is no significant difference in the Post Hoc Tri–Squared Means for each of the Trichotomous Categorical and Outcome Variables of the Standard 3× 3 Tri–Squared Table for the Inventive Investigative Instrument delivered to nTri = 17 during the initial research investigation
H1: There is a significant difference in the Post Hoc Tri–Squared Means for each of the Trichotomous Categorical and Outcome Variables of the Standard 3× 3 Tri–Squared Table for the Inventive Investigative Instrument delivered to nTri = 17 during the initial research investigation.
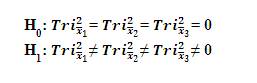
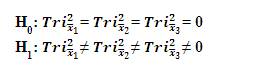
H0 : Tri–Squared mean of [Group 1] = Tri–Squared mean of [Group 2], and Tri–Squared mean of [Group 3] = 0 or
H1 : Tri–Squared mean of [Group 1] ≠ Tri–Squared mean of [Group 2] ≠ Tri–Squared mean of [Group 3]≠ 0
An Example of Two–Tailed TRINOVA Analysis Mathematical Hypothesis:s
This Model is skewed positively and very closely resembles the Tri–Squared Distribution Model (Osler, 2012a). Figure 1 illustrates the Critical Region of the TRINOVA Test = Critical Region of the Trivariant Test that is necessary to significantly reject the null hypothesis. It is a graph of the density function of the TRINOVA/Trivariant Distribution that is similar to the one factor Analysis of Variance [ANOVA] statistical procedure, that analyzes the “spread scores” around a research group mean (Searle, Casella, & McCullock, 1992). From Tables (2-12), the distribution has the following Degrees of Freedom Parameters that are equal to a significant Tri–Squared Test with a 3 x 3 Standard Table with a calculated External Invariant Variation always equal to d.f. 1 = 2 and a Tri–Squared 3 x 3 Standard Table calculated Internal Invariant Variation always equal to d.f. = 6. The area in the “right tail” of the distribution has been colored in grey to indicate that, this particular test had an alpha level = 0.05 which is equivalent to a probability that is equal to P = 0.05. The TRINOVA/Trivariant Critical Value Tables that follow are listed sequentially and are directly parallel to the initial Tri–Squared Critical Value Alpha Level Tables. During TRINOVA, the Critical Value α Level is equivalent (or “corresponds”) to the initial Tri–Squared research α Level because the TRINOVA research seeks to validate the initial research instrument outcomes via Tri–Squared Table—Trichotomous Categorical Variable and Trichotomous Outcome Variable Mean Square Analysis.

Figure 1. The TRINOVA Distribution = TheTrivariant Distribution Model Illustrating a Final Calculation=TRINOVA Distribution(2, 6) = Trivariant Distribution(2, 6)
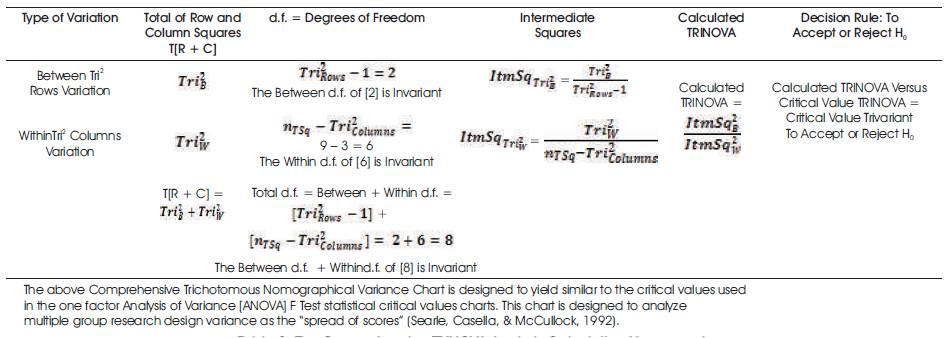
Table 2. The Comprehensive TRINOVA Analysis Calculation Nomograph
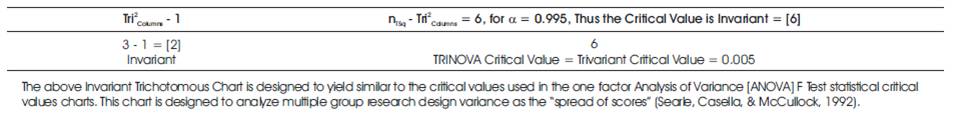
Table 3. The TRINOVA Invariant Critical ValueNomograph = TrivariantAnalysis Invariant Critical Value Table for the α = 0.995 Significance Level with a Probability of P = 0.995
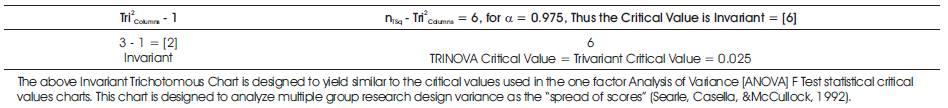
Table 4. The TRINOVA Invariant Critical ValueNomograph = TrivariantAnalysis Invariant Critical Value Table for the α = 0.975 Significance Level with a Probability of P = 0.975
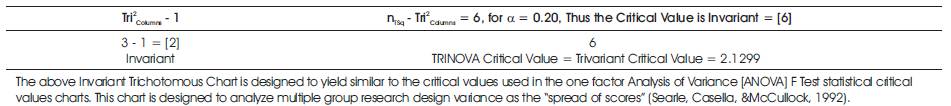
Table 5. The TRINOVA Invariant Critical ValueNomograph = TrivariantAnalysis Invariant Critical Value Table for the α = 0.20 Significance Level with a Probability of P = 0.20
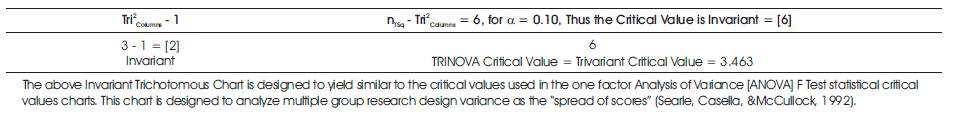
Table 6. The TRINOVA Invariant Critical ValueNomograph = TrivariantAnalysis Invariant Critical Value Table for the α = 0.10 Significance Level with a Probability of P = 0.10
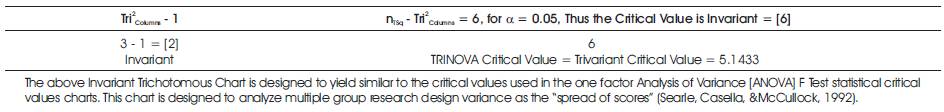
Table 7. The TRINOVA Invariant Critical ValueNomograph = TrivariantAnalysis Invariant Critical Value Table for the α = 0.05 Significance Level with a Probability of P = 0.05
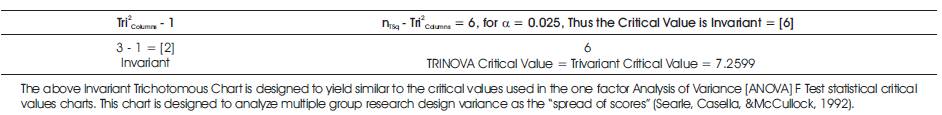
Table 8. The TRINOVA Invariant Critical ValueNomograph = TrivariantAnalysis Invariant Critical Value Table for the α = 0.025 Significance Level with a Probability of P = 0.025
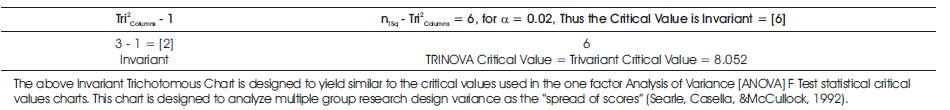
Table 9. The TRINOVA Invariant Critical ValueNomograph = TrivariantAnalysis Invariant Critical Value Table for the α = 0.02 Significance Level with a Probability of P = 0.02
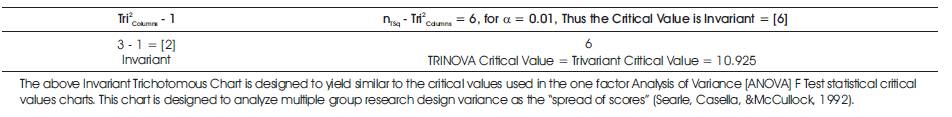
Table 10. The TRINOVA Invariant Critical Value Nomograph = TrivariantAnalysis Invariant Critical Value Table for the α = 0.01 Significance Level with a Probability of P = 0.01
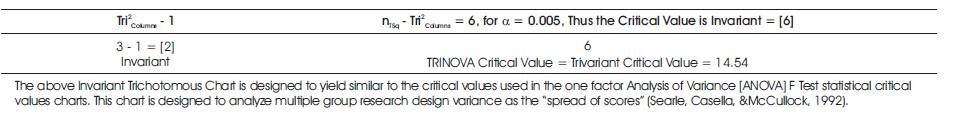
Table 11. The TRINOVA Invariant Critical ValueNomograph = TrivariantAnalysis Invariant Critical Value Table for the α = 0.005 Significance Level with a Probability of P = 0.005
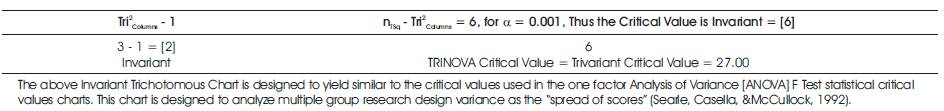
Table 12. The TRINOVA Invariant Critical Value Nomograph= TrivariantAnalysis Invariant Critical Value Table for the α = 0.001 Significance Level with a Probability of P = 0.001
The data from the initial significant study was made into trichotomous or “trivariate” through the grouping of the initial research instrument questions into the following three Trichotomous Categorical Variables: a1 = Successful via: Impact and Positive Testing [the summation of the outcomes of the assessment instrument item 1]; a2 = Made a Difference via: Participation and Graduation Rate [the summation of the outcomes of the assessment instrument item 2]; and a3 = Aided in Retention via: Drop Out Rate and Attendance [the summation of the outcomes of the assessment instrument item 3].The Standard Tri–Squared 3 × 3 Table has the following Trichotomous Outcome Variables: b1 = Yes, b2 = No, and b3 = Unknown. The Tri–Squared Statistical model was used to analyze data to determine the attitudes and perceptions of faculty as leaders. The quantitative mathematical application of the Trichotomous–Squared (“Trichotomy–Squared”, “Tri–Squared” or “Tri–Square”) statistical analysis procedure (Osler, 2012a) had the following results: Tri2 Calculated Tri–Squared = [0.581] + [0] + [0.581] + [0.760] + [0.030] + [0.482] + [2.561] + [0.025] + [3.111] = 8.131 (with d.f. = 4 at α = 0.975). For d.f. = 4, the Critical Value for p > 0.975 is 0.484. Thus, we can reject the null hypothesis (H0 ) by virtue of the hypothesis test: Tri–Squared Critical Value of 0.484 < 8.131, the Calculated Tri–Squared Value. “Tri–Squared” is the mathematical transformation of qualitative data into quantitative data for the purpose of validating a research hypothesis (clearly illustrated in this Table). Table 2 illustrates and validates the process of transforming qualitative data into quantitative data as a means of in–depth mixed methods for the purposes of discrete data analysis. In Table 2, 3 × 3 Table reports the transformed quantitative outcomes based on the Inventive Investigative Instrument Trichotomous Categorical Variables according to participant responses as the Trichotomous Outcome Variables. Table Two data displays that participants primarily and overwhelmingly selected the “Yes” Categorical Variable (a1 b1 = 48, a2 b1 = 43, and a3 b1 = 38) rather than the alternative Categorical Variables of either “No” or “Unknown” (the “Unknown” C. V. indicated unselected or inapplicable responses to an item). The mathematical formula for the Tri–Squared is reported illustrating the final outcome of the research hypothesis test: the null hypothesis (H0 ) is rejected at p > 0.975 is 0.484, because the Tri–Squared Test Critical Value of 0.484 < 8.131 is Calculated Tri–Squared Test Value. Many statistical measures used in education are based on experimental research designs that require scientific methodologies and cannot be implemented in educational institutions without violating legal policies or severely disturbing the learning environment associated instructional climate (Osler & Waden, 2012b). To promote the previously mentioned efforts towards empowering faculty in the areas of social justice, empowerment, and environmental equity novel statistical measures and methods are required, that are specifically designed for education and educational environmental needs. The Tri–Squared statistical model provides scientific subsequent measures based on rigor and grounded in the foundation of longstanding educational research, fundamental educational theory, and innovations in qualitative, quantitative, and mixed methods research designs native to the specifics of pedagogy and ragogy (Osler, 2013b).
H0 : Tri2 =0
H1 : Tri2 ≠ 0
The Tri–Squared Test statistical analysis procedure was used to analyze and validate the initial data outcomes that were a result of the initial study (Osler & Waden, 2012b). An alpha–level of 0.975 was considered in light of the research context that was evidence–based in the prescribed schools that had restricted and controlled learning environments that allowed for very few chance factors to affect the outcomes of the research investigation (nTri = 17 with 17× 3 = 51 items per the outcomes of the Trichotomous Variables on the Inventive Investigative Instrument: The Osler–Waden 9th Grade Academies, Centers, and Center Models Assessment Instrument ( c). This was coupled with the data gathered from administrators that allowed for minimal chance factors to affect research outcomes. The 0.975 estimate was reasonable for this particular study based on the calculated Tri–Squared Effect Size. In addition, due to the exploratory context and nature of the research investigation (in an area where little previous research has been done regarding gender, ethnicity, and education administration leadership) a less stringent level of significance of 0.975 was the best fit for the research study. The study yielded the following final results using the Tri–Squared Test in the standard Tri–Squared 3 × 3 tabular format (on the following “Sample Research Results: Outcomes of the Sample Tri–Squared Test”). Table 13 follows and highlights the outcomes of the sample Tri–Squared Test.
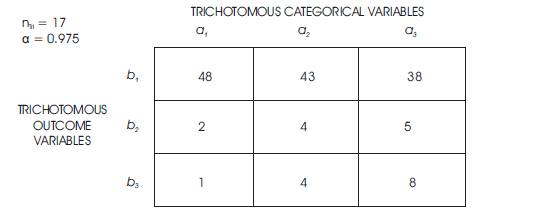
Table 13. Outcomes of the Tri–Squared Tests
Data Analyzed Using the Trichotomous–Squared 3 × 3 Table, designed to analyze the research questions from an Inventive Investigative Instrument with the following Trichotomous Categorical Variables: a1 = Successful via: Impact, and Positive Testing [the summation of the outcomes of the assessment instrument item 1]; a2 = Made a Difference via: Participation, and Graduation Rate [the summation of the outcomes of the assessment instrument item 2]; and a3 = Aided in Retention via: Drop Out Rate, and Attendance [the summation of the outcomes of the assessment instrument item 3]. The 3 × 3 Table has the following Trichotomous Outcome Variables: b1 = Yes; b2 = No; and b3 = Unknown(Osler & Waden, 2012b). The Inputted Qualitative Outcomes are reported as follows:
The Tri–Square Test Formula for the Transformation of Trichotomous Qualitative Outcomes into Trichotomous Quantitative Outcomes to determine the Validity of the Research Hypothesis:
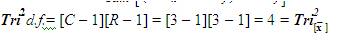
Table 13 illustrates the qualitative mathematical application of the Trichotomous–Squared (“Trichotomy–Squared”, “Tri–Squared” or “Tri–Square”) statistical analysis procedure. The results are: Tri2 Critical Value Table = 8.131 (with d.f. = 4 at α = 0.975). For d.f. = 4, the Critical Value for p > 0.975 is 0.484. The calculated Tri–Square value is 8.131, thus, the null hypothesis (H0 ) is rejected by virtue of the hypothesis test which yields the following: Tri–Squared Critical Value of 0.484 < 8.131 the Calculated Tri–Squared Value. The Table One 3 × 3 Table reports the qualitative outcomes based on the Inventive Investigative Instrument Trichotomous Categorical Variables according to participant responses as the Trichotomous Outcome Variables. Table 13 shows that participants primarily and overwhelmingly selected the “Yes” Categorical Variable (a1b1 = 48, a2b1 = 43, and a3b1 = 38) rather than the alternative Categorical Variables of either “No” or “Unknown” (the “Unknown” C. V. indicated unselected or inapplicable responses to an item). The mathematical formula for the Tri–Squared is reported illustrating the final outcome of the research hypothesis test: the null hypothesis (H0) is rejected at p > 0.975 is 0.484. Table 14 follows and provides the outputted quantitative outcomes of the Tri–Squared Test (Osler & Waden, 2012b).
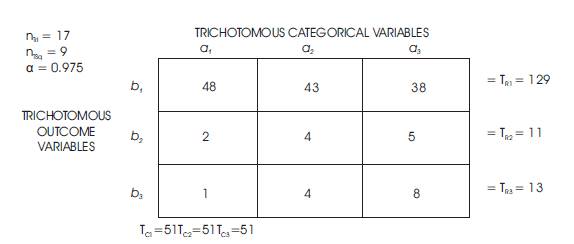
Table 14. Calculations of the Sample TRINOVA Advanced Statistical Methodology
The Tri–Squared Standard 3 × 3 Table is under Trivariate Analysis, thus: nR[1-3] = 3 and nTsq = 9.
The Calculated Sum of Trichotomous Outcome Variable Tri–Squared Row Scores are respectively:
b1 = T2R1 = 5597;
b2 = T2 R2= 45; and
b3 = T2R3 = 81.
The Tri–Squared Standard 3 × 3 Table is under Trivariate Analysis, thus: nc[1-3] = 3 and nTsq = 9.
The Calculated Sum of Trichotomous Outcome Variable Tri–Squared Row Scores are respectively:
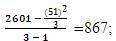
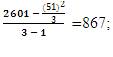
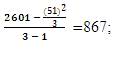
a1 = T2C1 = 2601;
a2 = T2C2 = 2601; and
a3 = T2C3 = 2601.
Tri2Columns = The number of 3 × 3 Standard Tri–Squared Table Rows = 3 and Tri2Rows -1 = 3 - 1 = 2.
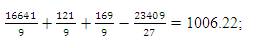
Tri2Ext = Tri–Squared External Row Comparisons =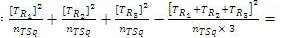
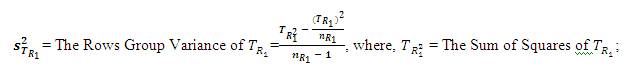
S2TR1 = The Variance of 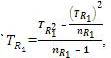 , where, TR21 = The Sum of Squares of TR1 and nR1 = Number of Cells in Row 1, thus,
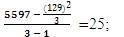
S2TR2 = The Variance of 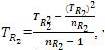 , where, TR22 = The Sum of Squares of TR2 and nR2 = Number of Cells in Row 2, thus,
S2TR3 = The Variance of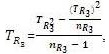 , where, TR23 = The Sum of Squares of TR3 and nR3 = Number of Cells in Row 3, thus,
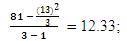

S2TC1 = The Variance of 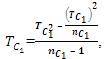 where, TC21 = The Sum of Squares of TC1 and nC1 = Number of Cells in Column 1, thus,
S2TC2 = The Variance of 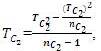 where, TC22 = The Sum of Squares of TC2 and nC2 = Number of Cells in Column 2, thus,
S2TC3 = The Variance of 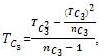 where, TC23 = The Sum of Squares of TC3 and nC3 = Number of Cells in Column 3, thus,
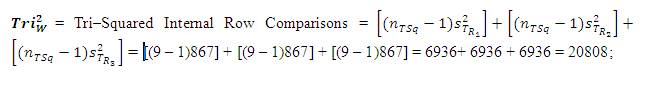
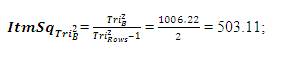
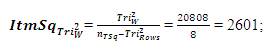
T[R + C]= Total of Row + Column Squares = Tri2B + Tri2W = 1006.22 +20808= 21814.22;
d.f. = TRINOVA “Degrees of Freedom” = Total d.f. =
Calculated Trivariant =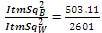 =0.193429 = 0.19 (rounded);
An Example of Two–Tailed TRINOVA Mathematical Hypothesis
(The Final Stage) The Final RINOVA Analysis calculation Nomograph and the invarient critical value nomograph are shown in Table (15 & 16).
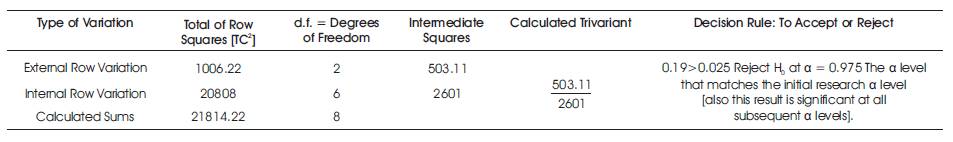
Table 15. The Final Comprehensive TRINOVA Analysis Calculation Nomograph

Table 16. The Final TRINOVA Analysis Invariant Critical Value Nomograph that is Equivalent to the Initially Significant Tri–Squared Research α Level For the α = 0.975 Significance Level with a Probability of P = 0.975
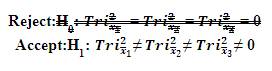
H0 Rejected: There is no significant difference in the Post Hoc Tri–Squared Means for each of the Trichotomous Categorical and Outcome Variables of the Standard 3 × 3 Tri–Squared Table for the Inventive Investigative Instrument delivered to nTri = 17 during the initial research investigation.
H1 Accepted: There is a significant difference in the Post Hoc Tri–Squared Means for each of the Trichotomous Categorical 1 and Outcome Variables of the Standard 3× 3 Tri–Squared Table for the Inventive Investigative Instrument delivered to nTri = 17 during the initial research investigation.
H0 : Tri–Squared mean of [Group 1] = Tri–Squared mean of [Group 2], and Tri–Squared mean of [Group 3] = 0or
H1 : Tri–Squared mean of [Group 1] ≠ Tri–Squared mean of [Group 2] ≠ Tri–Squared mean of [Group 3] ≠ 0
Thus, the following observation can be stated based on the results of the post hoc Tri–Squared TRINOVA calculations: There is enough post hoc evidence via the TRINOVA Advanced Statistical Analysis to support the difference in Tri–Squared Means for each of the Trichotomous Outcome Variables of the Standard 3× 3 Tri–Squared Table for the Inventive Investigative Instrument delivered to nTri = 17. This indicates that the results conducted with the initial research Inventive Investigative Instrument as a measure device for the initial research question is trichotomously valid, reliable, and objective in measuring Between and Within Group Trichotomous participant outcomes (as extracted from the initial significant research sample group of nTri = 17). The evidence of the post hoc TRINOVA also indicates that the initial research data regarding the impact of Ninth Grade Academies, Freshman Academies, and similar models upon ninth grade minority student achievement is statistically significant at α Level = 0.975, thereby supporting the initial research outcomes (also significant at α Level = 0.975 based upon the determined Tri–Squared Test Tabular Sample and Effect Size).
The purpose of this study was to determine if the TRINOVA advanced statistical post hoc testing methodology is a valid way of testing the initial research outcomes of a significant Tri–Squared Test. This advanced statistical metric was used as a follow–up to the initial Meta–Cognitive Analysis as an advanced statistical measure to determine the impact of academic technical solutions called: 9th Grade Academies, Freshman Academies, and similar models upon 9th grade minority student achievement. The initial research study also examined the impact of Smaller Academic Learning Communities such as 9th Grade Academies, Freshman Academies, and similar models on attendance rates, dropout rates, retention rates, and the success rate on end of course or high stakes tests, the graduation rates and overall success of minority 9th grade students as they begin their high school careers. The initial research study and subsequent Tri–Squared Test determined that the research participants for the most part agreed that 9th Grade Academies, Centers, and Center Models were effective in their respective schools (thus, validating the research outcomes of the initial research study). The Tri–Squared Analysis yielded the final outcome of the research hypothesis test: the null hypothesis (H 0) rejected at p > 0.975 is 0.484, because the Tri–Squared Test Critical Value of 0.484 < 8.131 is the Calculated Tri–Squared Test Value. This outcome is supported by the final results of the Meta–Cognitive Analysis Chi–Square analysis in the initial study. The TRINOVA Test conducted here also found significance in the research outcomes conducted on the post hoc Tri- Squared data. Thus, the rejection of the initial research Null Hypothesis can be overwhelmingly supported and it can be accurately stated that 9th Grade Academies, Centers, and Center Models do have a perceived (by professionals who engage in the implementation of these models) and an actual effect on At–Risk student academic success and retention. Thus, the initial research and its associated outcomes are validated and the results of additional statistical measures provide support and more insight into the efficacy of the researcher designed instrument used in the research investigation. These results indicate that the Post Hoc Test metric called TRINOVA is an effective form of Post Hoc analysis of the Tri–Squared Test methodology. This adds greater breadth and depth to Tri–Squared conducted research from an in–depth advanced statistical analytical perspective. Such a perspective sheds even greater light on the inner workings of the Tri–Squared Test, the Tri–Squared Model, and Advanced Post Hoc Tri–Squared Testing Metrics, thereby providing an extensive and exhaustive amount of value to Trichotomous Research as a whole.