 =Sum of Columns as the Trichotomous Categorical Variables or “TCV”;
This paper provides a novel statistical methodology called “Triple or Tri–Sigma” (“Tri-Σ”) that is designed to conceptually add to the research that has been conducted on and with the Tri–Squared Test (Osler, 2012a). The Tri–Sigma Test is an advanced statistical procedure that is used to analyze multiple Tri–Squared Tests that have been delivered at different times. Tripleseries summation provides an innovative way of investigating the data derived from a series of researchbased investigative instruments that are known as “Trichotomous Tri-Squared Test Triple-I's” (Osler and Mansaray, 2013b). The Triple–I is directly derived from specific research questions as an in-depth associated instrument [first introduced in the i-manager's Journal on Mathematics as a part of the “Tri-Squared Test” (Osler, 2012a)]. This new approach to research inquiry lends additional strength to trichotomous research designs. Trichotomous tests can now be offered at multiple stages, multiple times, and in multiple ways with multiple research questions.
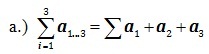
Tri–Sigma Analysis (or “The Triple–Sigma Test”, i.e., “The Tri–Sigma Test” is also referred to as: “Tri–Sigma, “Tri–Σ”, “Tri–Σigma”, or “Triple–Sigma”) is a “Triochotomous–Summation Technique” that involves addition in a trifold series that simplifies and explains: 1) The use of the mathematical “Law of Trichotomy” in research designs; 2) The structural methodology of the Tri- Squared Test 3 × 3 Standard Table format used to transform qualitative data into quantitative data for the “Trichotomous Confirmatory Data Analysis” [or “Tri–CDA”] of trichotomous variables; and 3) The specific analysis of multiple trichotomous “Triple–I” (which is another name for the native psychometric instruments that are Tri–Squared Test researcher designed “Inventive Investigative Instruments”) such as a series of “pre”, “mid”, and “post” tests conducted during a a specified trichotomous research investigation. Tri–Sigma makes use of the traditional mathematical summation in a series (using the capital Greek letter Sigma: “Σ” for “Sum” or “Addition” in traditional mathematical summation notation). Thus, “Triple–Sigma” or “ΣΣΣ” as a trichotomous research testing methodology is the triple sum of trichotomous values that follow the operational definition of the Tri–Squared Test. Therefore, the mathematical definitions of Tri–Sigma are presented in a variable sequence (using summation notation in a computational definition) to illustrate and define the meaning of each of the summations in terms of the Tri-Squared Test. Thus, the order of values in the Tri-Σigma Test are arranged in the following manner:
=Sum of Columns as the Trichotomous Categorical Variables or “TCV”;
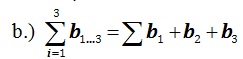 =Sum of Rows as the Trichotomous Outcome Variables or “TOV”; and
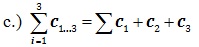 =Sum of Layers as the Trichotomous Test Procedures or “TTP”.
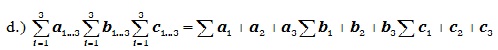
Altogether the explicative mathematical definition of the combination of the aforementioned three mathematical formulae is written:
 =[Tri–Factoring Sigma] =

The primary objective of the narrative outlined in this paper is to introduce the novel statistical methodology called “Triple or Tri–Sigma” (“Tri–Σ”) into the innovative field of “Triostatistics” (Osler, 2014). The major purpose of the “Triple–Sigma Test” is to allow the “triostatistician” to conduct a series of multiple Tri-Squared Tests on the observed phenomena already under study. While this may seem somewhat redundant to an outside observer, the research often finds new and novel evidence within the parameters of their investigation that merits further in-depth inquiry. As such, retesting specified “Trichotomous Categorical and Outcome Variables” (“TCV” and “TOV”, respectively) in a post hoc fashion may shed new light on research previously conducted. An additional outcome of the “Tri–Σ Test” is that it now allows the field of Triostat multiplicity in its research scope that is well beyond the initial specifications of the original Tri–Squared Test (Osler, 2012a). The Tri–Sigma Test also allows a “time series design” to be added into Triostat that is a new realm of investigative inquiry that was previously unavailable for statisticians and researchers who have advanced triostatistical procedures in their battery of statistical tools. Thus, assessments and evaluations conducted over a series of specified times (such as the use of a diverse set of Triple-I tools designed to determine initial inquiry hypothetical merit on several distinctively identified research areas and/or arenas) can be used to analyze multiple Tri–Squared Tests that have been delivered either sequentially or in an indiscriminant pattern.
The term “Trichotomy”: is pronounced ['trahy-kot-uh-mee'], spelled “tri•chot•o•my”, and is a noun with the plural written form “tri•chot•o•mies”. “Trichotomy” has the following threefold definition: 1) Separation or division into three distinct parts, kinds, groups, units, etc.; 2) Subdivision or classification of some whole into equal sections of three or “trifold segmentation”; and 3) Categorization or division into three mutually exclusive, opposed, or contradictory groups, for example - “A trichotomy between thought, emotions and action (Osler and waden, 2012b)”. A “Trichotomy” in terms of philosophy can be referred to as a threefold method of classification. Philosopher Immanuel Kant (in his “Critique of Pure Reason”) adapted the Thomistic acts of intellect in his trichotomy of higher cognition - (a) understanding, (b) judgment, (c) reason - which he correlated with his adaptation in the soul's capacities - (a) cognitive faculties, (b) feeling of pleasure or displeasure, and (c) faculty of desire (Kant, 2007). In terms of mathematics, Apostol in his book on calculus defined “The Law of Trichotomy” as: Every real number is negative, 0, or positive. The law is sometimes stated as, “For arbitrary real numbers a and b, exactly one of the relations a
Triostatistics (or more simply “Triostat”) is the science, field, and study of the application, scale, and measurement of the mathematical “Law of Trichotomy” to research design(s) for in-depth investigative inquiry. It also includes the advanced statistical application of Post Hoc measures to the outcomes of an initial “Confirmatory Data Analysis” Trichotomous Squared Test. As a statistical discipline, Triostat concerns the development and application of specific and uniquely designed advanced Post Hoc statistical tests, methodologies, and techniques. Triostat is used to further investigate the research outcomes initially from statistically significant Tri-Squared Tests. Research studies that analyze data through the use of the Trichotomous Squared Test are the foundation for Triostatistics. Thus, Triostatistics is the further investigation and precise in–depth study of the dynamic data that is the statistically significant Tri-Squared Test results (Osler, 2014).
The word “Triostatistics” is a portmanteau of the terms: “Trichotomous” and “Statistics”; that can also be referred to as “Triostat”, “Advanced Trichotometrics”, or “The Science of Trichotomy”. More definitively, Triostatistics is a branch of the science statistics that is the specific application of statistical methods, techniques, and strategies to a wide range of topics that concern the Tri-Squared Test. At the heart of this statistical discipline is the application of the mathematical “Law of Trichotomy”. The science of Triostatistics encompasses the design of Tri-Squared experiments, especially in education and social behavioral settings. However, the utility and flexibility of Triostat as a body statistical metrics allows it to be applied to a variety of sciences (through the use and application of the mathematical “Law of Trichotomy”). Triostatistics as a discipline is the collection, summarization, and analysis of data from Tri-Squared experiments; and the interpretation of, and inference from, statistically significant Tri–Squared Test results ( Osler, 2013a, 2014).
Table 1 is an exhaustive list of currently published Triostatistical measures in use in investigative inquiry (noting that the vast majority of these tests and metrics can be used beyond Triostatistical research inquiry, however, a few are descriptively highlighted in the list below due to their specific use with extraneous research methods that extend their use beyond the stringencies of trichotomy).
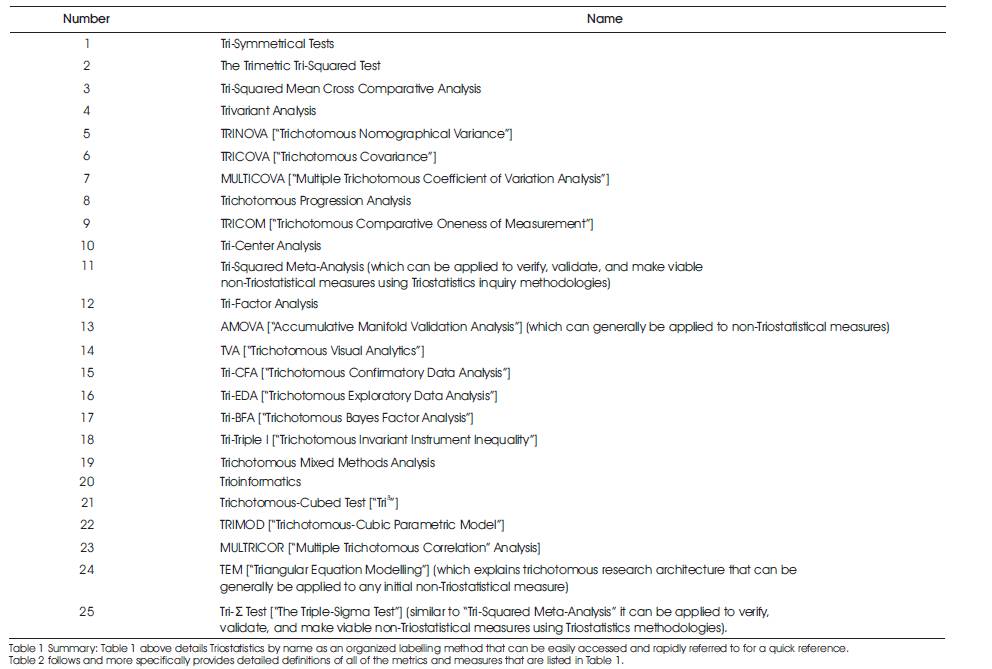
Table 1. An Exhaustive List of Triostatistics Methodologies and Tests
Table 2 details an Triostatistics identity and usability format that specifically provides detailed definitions of all of the metrics and measures that are associated with primary and post hoc trichotomous research and analytics. The next section explains how to use the Triple-Sigma Test by parsimoniously detailing summation in a series and how this model is used in trichotomous analytical measures that ultimately forms the Triple-Sigma Test.
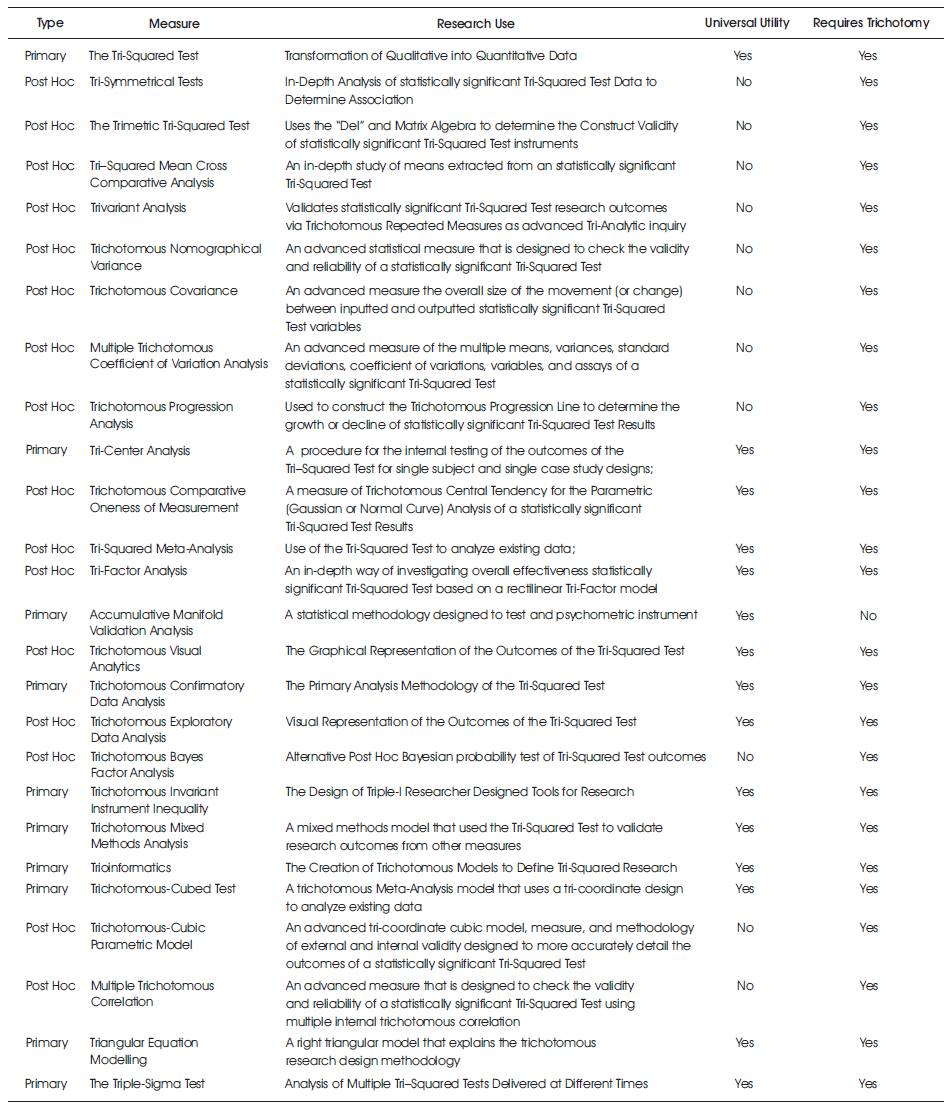
Table 2. The Triostatistics Identity and Usability Table
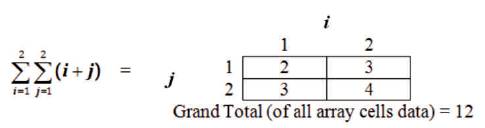
The Origins of Tri-Σ: The Triple-Sigma Test has the functionality to make trichotomous Triple-I psychometrics highly viable and verifiable through its multiple sequential mathematical architecture. Triple summation is the addition of a third summation in a series to an array created by mathematical “Double Summation” (denoted by the use of dual sigma summation in a series notation as “ΣΣ”). A double sigma notation calculation (of the form: “ ”) creates a calculable 2 × 2 array in the following manner:
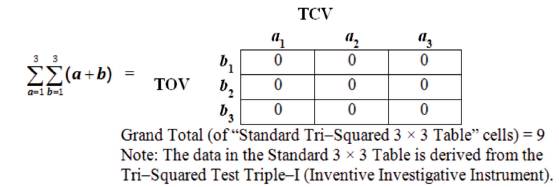
The dual summation methodology can be used to explain the Standard 3 × 3 Table of the Tri-Squared Test, which is the array used to convert trichotomous quantitative data into trichotomous qualitative data (Osler, 2012a) in the following manner:
Similarly, Triple Summation works in the same way with the additional summation in a series creating a third “layer” of calculations. In the case of “Triostatistics” (Osler, 2014), the “third layer” of calculations adds an advanced higher capability, feasibility, verifiability, and overall validity to trichotomous-based research, in particular to the Tri–Squared Test.
The Triple–Sigma Test's computational (summation notation) mathematical formula is of the following form:
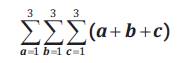
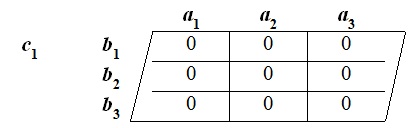
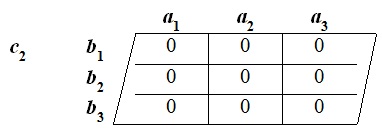
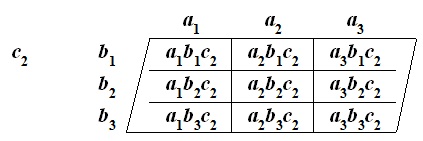
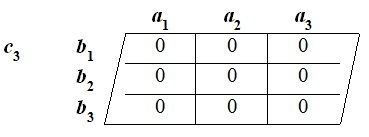
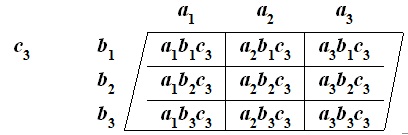
where, a = The Tri–Squared Test Trichotomous Categorical Variables (as “TCV” = “a1 … a3 ”); b = The Tri–Squared Test 1 3 Trichotomous Outcome Variables (as “TOV” = “b1 … b3 ”); c = The Tri–Squared Test Trichotomous Test Procedures (Pre-Test; Mid-Test; and Post-Test as “TTP” = “c1 … c3 ”). This is symbolized in the trifold summation of columns [“a1....3 ”]; rows [“b1....3 ”]; and layers [“c1....3 ”] as illustrated in the following model:
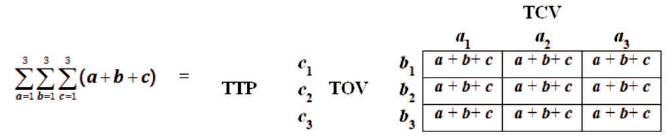
Note: Each of the cells in the model above has the same method of adding together (a + b+ c), which are “TCV” + “TOV” + “TTP” according to numerical sequence respectively, (for example: a[cell one] + b[cell one]+ c [cell one] illustrated in the next section). The data in the Standard 3 × 3 Table above is still derived from the Tri–Squared Test Triple–I (or “Inventive Investigative Instrument”) with the Layers sum factored into each test. Here, the Trichotomous [Categorical, Outcome, and Tests] “Variable Factors” respectively are representative of the Tri-Sigma research methodology as:
a = The variable factor of “Analysis” = Initial Research “Examination” = “TCV”;
b = The variable factor of “Balance” = Secondary Research “Verification” = “TOV”; and
c = The variable factor of “Confirmation” = Tertiary Research “Validation” = “TTP”. The three aforementioned are equal to the Tri-Sigma Summation Factor Calculation:
 which is equivalent to
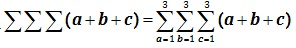
In terms of “Trichotomous Layers” (“c ”) the following calculation models are applied according to the number of Tri-Sigma 1…3 Layers (in this example three that were set at the outset of the research investigation. Thus, Tri-Sigma Test Layer One is presented as:
Tri-Sigma Test Layer One consists of the results of the Pre-Test Tri-Squared Test Triple-I Outcomes in the Standard Tri-Squared 3 × 3 Tabular Format, where the results of Layer One are tabulated as the summation of variables (“a” [Columns] “b” [Rows] “c” [Layers]) = (a + b + c) [separated by numerical indicator] with the additional (+1) added to each cell for “c ” in the following 1 manner:

Followed by Tri-Sigma Test Layer Two, which is presented as:
Tri-Sigma Test Layer Two consists of the results of the Mid-Test Tri-Squared Test Triple-I Outcomes in the Standard Tri-Squared 3 × 3 Tabular Format, where the results of Layer Two are tabulated as the summation of variables (“a” [Columns] “b” [Rows] “c” [Layers]) = (a + b + c) [separated by numerical indicator] with the additional (+2) added to each cell for “c ” in the following 2 manner:
Lastly, Tri–Sigma Test Layer Three is presented as:
Tri-Sigma Test Layer Three consists of the results of the Post-Test Tri-Squared Test Triple-I Outcomes in the Standard Tri-Squared 3 × 3 Tabular Format, where the results of Layer Three are tabulated as the summation of variables (“a” [Columns] “b” [Rows] “c” [Layers]) = (a + b + c) [separated by numerical indicator] with the additional (+3) added to each cell for “c ” in the following 3 manner:
The next and final step in the Tri-Sigma Test computational calculation is to acquire the Grand Total of all three Layers. This is done by first calculating the Tri-Squared Test for all 27 cells of each of the respective Pre-Tests; Mid-Tests; and Post-Tests. Procedurally this is done by computing an individual Tri-Squared Test for each of the three individual test outcomes (as Layer One; Layer Two; and Layer Three). As a result, the final resulting Tri-Squared calculated outcome for each of the three tests is added together to give the “Final Calculated Tri-Sigma Test Value”. This can now be compared to the “Tri-Squared Test Critical Value” for Tri-Σ[nTrl] = (Pre-Test[nTrl] + Mid-Test[nTrl] + Post-Test[nTrl]) at the alpha level (“α”) equal to the pre-set alpha level for all three tests (which are all the same and set at the outset of the research investigation). The “Final Calculated Tri-Sigma Value” can now also be compared to the alpha level associated with the newly calculated “Tri-Σ[nTrl]” to determine the Tri feasibility, verifiability, and overall validity of the Tri-Sigma Test. This then thereby provides a vast amount of tangible evidence for the testing of trichotomous research questions, hypotheses, and/or lemmas.
The following sample data ( from Osler, 2015 and 2016) will be used to conduct a Tri-Σ Test:
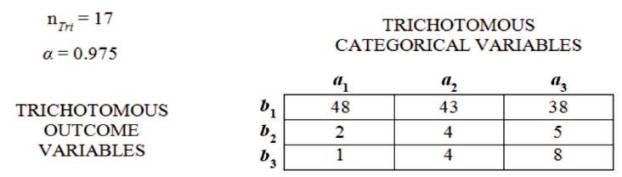
Data Analyzed using the Trichotomous-Squared Three by Three Table designed to analyze the research questions from an Inventive Investigative Instrument with the following Trichotomous Categorical Variables: a1= Successful via: Impact, and 1 Positive Testing [the summation of the outcomes of the assessment instrument item 1]; a2= Made a Difference via: 2 Participation, and Graduation Rate [the summation of the outcomes of the assessment instrument item 2]; and a3= Aided in 3 Retention via: Drop Out Rate, and Attendance [the summation of the outcomes of the assessment instrument item 3]. The 3 × 3 Table has the following Trichotomous Outcome Variables: b1= Yes; b2= No; and b3= Unknown. The Inputted Qualitative 1 2 3 Outcomes are reported as follows:
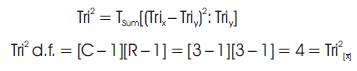
The Tri-Square Test Formula for the Transformation of Trichotomous Qualitative Outcomes into Trichotomous Quantitative Outcomes to determine the Validity of the Research Hypothesis:
The above table illustrates the qualitative mathematical application of the Trichotomous-Squared (“Trichotomy-Squared”, “Tri–Squared”, or “Tri-Square”) statistical analysis procedure. The results are: Tri2 Critical Value Table = 8.131 (with d.f. = 4 at α = 0.975). For d.f. = 4, the Critical Value for p > 0.975 is 0.484. The calculated Tri-Square value is 8.131, thus, the null hypothesis (H ) is rejected by virtue of the hypothesis test which yields the following: Tri-Squared Critical Value of 0.484 < 8.131, the 0 calculated Tri-Squared Value. The 3 × 3 Table reports the qualitative outcomes based on the Inventive Investigative Instrument Trichotomous Categorical Variables according to participant responses as the Trichotomous Outcome Variables. It also shows that participants primarily and overwhelmingly selected the “Yes” Categorical Variable (a1 b1= 48, a2b1 = 43, and a3b1= 38) rather than the alternative Categorical Variables of either “No” or “Unknown” (the “Unknown” C. V. indicated 3 1 unselected or inapplicable responses to an item). The mathematical formula for the Tri-Squared is reported illustrating the final outcome of the research hypothesis test: the null hypothesis (H0) rejected at p > 0.975 is 0.484. The next table follows 0 and provides the outputted quantitative outcomes of the Tri-Squared Test (Osler, 2016).
To accurately and fully implement the power of the Tri-Σigma Test, let us assume that the research investigator had the following initial “Trichotomous Confirmatory Data Analysis” (“Tri-CDA”) ( Osler, 2017) research hypotheses:
H : There is no significant difference on the Pre-Test, Mid-Test, and Post-Test outcomes of the Tri-Squared Test for each of the 0 identified Trichotomous Categorical and Outcome Variables [on the Standard 3 × 3 Tri-Squared Table] as responses to the three Inventive Investigative Instruments delivered during different times to the research participants [nTri= 17] conducted Tri during the designated time period of the research investigation.
[Note: In this particular example, the researcher is delivering the same Triple-I tool three different times and in other investigations, the instrumentation may be subject to change depending upon research needs and circumstances].
H : There is a significant difference on the Pre-Test, Mid-Test, and Post-Test outcomes of the Tri-Squared Test for each of the 1 identified Trichotomous Categorical and Outcome Variables [on the Standard 3 × 3 Tri-Squared Table] as responses to the three Inventive Investigative Instruments delivered during different times to the research participants [nTri 17] conducted Tri during the designated time period of the research investigation.
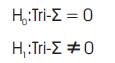
The associated mathematical hypotheses that directly align to the aforementioned research hypotheses are written in the following format:
Tri-Sigma Test Mathematical Hypotheses for the Sample Research
The results of 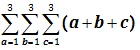 are determined to be as follows:
Tri-Sigma Test Layer One [“Pre-Test”] is presented as:
Tri-Sigma Test Layer Two [“Mid-Test”] is presented as:
Tri-Sigma Test Layer Three [“Post-Test”] is presented as:
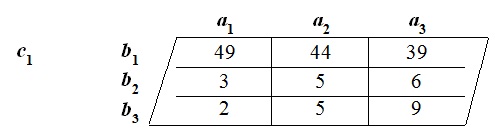
The individual internal Tri-Sigma Tri-Squared Test results for Layer One [“c1 ”] are reported as follows:
The Layer One Tri–Sigma Tri-Squared Test results based upon internal “Tri2 = Tsum[(Trix – Triy )2 : Triy ]2 were: Tri2 Critical Value Table =6.962 (with d.f. = 4 at α = 0.975). For d.f. = 4, the Critical Value for p > 0.975 is 0.484. The calculated Layer One Tri–Square value is 6.962, thus, the initial internal Tri-Sigma null hypothesis (H ) for Layer One [“Pre-Test”] is rejected by virtue of the 0 individual internal Pre-Test “Trichotomous Confirmatory Data Analysis” hypothesis test, which yielded the following: Tri–Squared Critical Value of 0.484 <6.962 [the Calculated Layer One Tri-Squared Value]. The Layer One 3 × 3 Table reports the qualitative outcomes based on the Pre-Test Inventive Investigative Instrument Trichotomous Categorical Variables according to participant responses as the Trichotomous Outcome Variables. Layer One shows that participants primarily and overwhelmingly selected the “Yes” Categorical Variable (a1b1=49, a2b1=44, and a3b1 = 39) rather than the alternative Categorical Variables of either “No” or “Unknown” (the “Unknown” C. V. indicated unselected or inapplicable responses to an item). The mathematical formula for the Layer One Tri-Sigma Tri-Squared Test is reported illustrating the first internal Layer One outcome of the Tri-Sigma research hypothesis test is as follows: the null hypothesis (H0) rejected at p > 0.975 is 0.484.
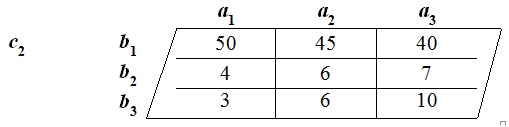
The individual internal Tri-Sigma Tri-Squared Test results for Layer Two [“c2”] are reported as follows:
The Layer Two Tri-Sigma Tri-Squared Test results based upon internal “Tri2 = Tsum[(Trix – Triy )2 : Triy ]2 were: Tri2 Critical Value Table =4.936 (with d.f. = 4 at α = 0.975). For d.f. = 4, the Critical Value for p > 0.975 is 0.484. The calculated Layer Two Tri-Square value is 4.936, thus, the initial internal Tri-Sigma null hypothesis (H ) for Layer Two [“Pre-Test”] is rejected by virtue of the individual 0 internal Mid-Test “Trichotomous Confirmatory Data Analysis” hypothesis test, which yielded the following: Tri-Squared Critical Value of 0.484 < 4.936 [the Calculated Layer Two Tri-Squared Value]. The Layer Two 3 × 3 Table reports the qualitative outcomes based on the Mid-Test Inventive Investigative Instrument Trichotomous Categorical Variables according to participant responses as the Trichotomous Outcome Variables. Layer Two shows that participants primarily and overwhelmingly selected the “Yes” Categorical Variable (a1b1= 50, a2b1 = 45, and a3b1 = 40) rather than the alternative Categorical Variables of either “No” or “Unknown” (the “Unknown” C. V. indicated unselected or inapplicable responses to an item). The mathematical formula for the Layer Two Tri-Sigma Tri-Squared Test is reported illustrating the first internal Layer Two outcome of the Tri-Sigma research hypothesis test is as follows: the null hypothesis (H0) rejected at p > 0.975 is 0.484.
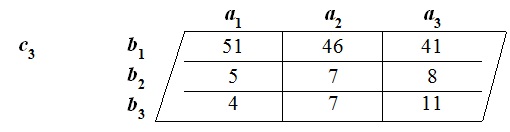
The individual internal Tri-Sigma Tri-Squared Test results for Layer Three [“c3”] are reported as follows:
The Layer Three Tri-Sigma Tri-Squared Test results based upon internal “Tri2 = Tsum[(Trix – Triy )2 : Triy ]2 were: Tri2 Critical Value Table =6.366 (with d.f. = 4 at α = 0.975). For d.f. = 4, the Critical Value for p > 0.975 is 0.484. The calculated Layer Three Tri-Square value is 6.366, thus, the initial internal Tri-Sigma null hypothesis (H0) for Layer Three [“Pre-Test”] is rejected by virtue of the 0 individual internal Post-Test “Trichotomous Confirmatory Data Analysis” hypothesis test which yielded the following: Tri- Squared Critical Value of 0.484 < 6.366 [the Calculated Layer Three Tri-Squared Value]. The Layer Three 3 × 3 Table reports the qualitative outcomes based on the Post-Test Inventive Investigative Instrument Trichotomous Categorical Variables according to participant responses as the Trichotomous Outcome Variables. Layer Three shows that participants primarily and overwhelmingly selected the “Yes” Categorical Variable (a1b1= 51, a2b1= 46, and a3b1 = 41) rather than the alternative Categorical Variables of either “No” or “Unknown” (the “Unknown” C. V. indicated unselected or inapplicable responses to an item). The mathematical formula for the Layer Three Tri-Sigma Tri-Squared Test is reported illustrating the first internal Layer Three outcome of the Tri-Sigma research hypothesis test is as follows: the null hypothesis (H ) rejected at p > 0.975 is 0.484. 0 The final overall external Tri-Sigma Test result is: = (6.962 + 4.936 + 6.366) = 18.264, thus, the overall hypothesis test yields a Tri2 Critical Value Table = 18.264 (with d.f. = 4 at α = 0.975 for internal Layers One through Three and a summative Tri-Σ[nTri] α = 0.20). For d.f. = 4, the Critical Value for the internal Tri-Sigma Test is p > 0.975 is 0.484 and the external Tri overall Tri-Sigma Test is p > 0.20 is 5.989 (for: [nTri= 17] + [nTri= 17] + [nTri= 17] = Tri-Σ[nTri]= 51). Thus, Final Calculated Tri-Sigma Value is 18.264, as such, the final overall external Tri–Sigma Test null hypothesis overwhelmingly is rejected by virtue of the individual internal and final overall external Tri-Sigma Test. In terms of “Trichotomous Confirmatory Data Analysis” the final external hypothesis test yielded the following: Tri-Sigma Test Overall Tri-Squared Critical Value of 5.988<18.264 [the comprehensive Final Calculated Tri-Sigma Value].
The Tri-Sigma Test previously conducted determined that the Tri - Σ hypotheses had more than enough evidence both internally and externally to safely reject the null hypothesis (5.988 < 18.264). Thus, the mathematical hypothesis results of the Trichotomous Confirmatory Data Analysis is written and confirmed as follows: Results of the Tri–Sigma Test Sample Research Mathematical Hypotheses
Therefore, the associated research hypotheses (to the aforementioned mathematical hypotheses) results of the Trichotomous Confirmatory Data Analysis is written and affirmed as follows: [Rejected] H0: There is no significant difference on the Pre-Test, Mid-Test, and Post-Test outcomes of the Tri-Squared Test for each of the identified Trichotomous Categorical and Outcome Variables [on the Standard 3 × 3 Tri-Squared Table] as responses to the three Inventive Investigative Instruments delivered during different times to the research participants [n = Tri 17] conducted during the designated time period of the research investigation [Note: In this particular example, the researcher is delivering the same Triple-I tool three different times and in other investigations, the instrumentation may be subject to change depending upon research needs and circumstances].
[Accepted] H1: There is a significant difference on the Pre-Test, Mid-Test, and Post-Test outcomes of the Tri-Squared Test for each of the identified Trichotomous Categorical and Outcome Variables [on the Standard 3 × 3 Tri–Squared Table] as responses to the three Inventive Investigative Instruments delivered during different times to the research participants [nTri=17] conducted during the designated time period of the research investigation.
The trichotomous research viability, ergonomic validity, and precise verifiability of the Tri-Sigma Test make it a great statistical tool that greatly enhances the utility and overall usability of the Tri-Squared Test. The Tri-Sigma Test allows for a greater TriSquared Test utility as it expands the Tri Test by allowing for a greater number of Triple-I psychometrics to be used and offered at different times during a research investigation. The data from a statistically significant Tri-Σ Test provides, “a plausible statistical measure that allows investigators to interpret the in-depth and rich complexities of Tri-Squared research data” (Osler, 2014). Thus, the Tri-Sigma Analysis methodology allows for a more rigorous set of trichotomous data analysis procedures (that are designed to obey and extend the general conventions of traditional trichotomous statistics). It also, “removes any possible biases that may occur by applying purely subjective observations that do not rely on purely quantifiable data to determine differences in research outcomes” ( Osler, 2014).
The sample used for the Tri-Sigma Test as an example study presented several statistically significant internal findings followed by a final overall significant summative external Tri-Σ. This effectively and efficiently illustrates the benefits of the Triple-Sigma Test. The author makes the following recommendations for the use of the test in the future:
1) The overall utility of the test will be increased with its more widespread use by the research community;
2) Replication of past Trichotomous Squared Test research would benefit from the additional post hoc use of Tri–Σ; and
3) Follow-up studies should be conducted to determine the efficacy of trichotomous-based research.
The purpose of this narrative was to chronicle the applicability, provide an epistemological rationale for, and illustrate the usability of the Triple-Sigma Test (as an advanced Triostatistical Test methodology). As illustrated in the sample data, Tri-Sigma Analysis is a meticulously valid way of determining the multiple implementation of researcher designed trichotomous “Inventive Investigative Instruments”. These “grounded-in-research-inquiry psychometrics” become reliable and verifiable tools that are applied during specified research investigations. To exhibit its utility, [in this particular account] Tri-Sigma was employed as an advanced statistical metric used to determine the utility of three multiple implementations of a Triple-I instrument (that was used to verify internally and overall externally its applicability). This was overwhelmingly confirmed and thereby verified, validated, and established that the Tri-Σ statistic has use with multiple psychometric iterations that can be applied to any trichotomous-based research design. This also established that the Triple-Sigma Test is a very efficient and effective form of Triostatistical analysis within the framework and methodology of the Tri-Squared Test. This new addition to the field and science of Triostatistics there by adds much greater breadth and depth to future trichotomous research investigations from an in-depth and advanced statistical analytical perspective. The methodology Tri–Sigma Test greatly expands the overall usability of the Tri-Squared Test. It provides researchers with a means of broadening their research designs by making their trichotomous research more plausible, more extensive, and much more exhaustive. This in turn, aids in making Triostatistical metrics and measures more enriching and thereby adds value to the field of research inquiry as a whole. As trichotomous-based research continues to be adopted and grow tools, such as the Tri-Sigma Test become indispensable and add greater value to innovative and entrepreneurial research methods in a variety of disciplines, fields, and sciences.