Table 1. Class Diagram Metrics [15]
Source code size is exercised as input to numerous parametric software estimation models. But it is rarely presented at the initial phase of software development. For software project planning, accurately determining the software size estimation at the early stage is a very important parameter. This paper aims to provide a basis for estimating the software size at the early stage of the software development process through a systematic review of previous works. The authors have reviewed the current techniques of size estimation to identify their strengths and weaknesses.
Software size estimation has been a challenging job for software engineering communities. For absolute software project planning, accurate and reliable estimations are required to predict the size of a software project. Many researchers have proposed several metrics suitable for measuring the size and complexity of Object Oriented (OO) system based on the Unified Modeling Language (UML), assessing old or introducing new metrics that contains the concept of OO paradigm. In this paper, the authors survey the precision of source code estimation approaches that uses the information from class diagram to predict the final code size of object oriented system. This paper also presents the eight different modeling techniques in combination with or without an algorithmic transformation to analyze the accuracy of different types of metrics to the prediction model [15]. The different modeling techniques that are considered are linear models, nonlinear models, rule tree based model, and instance based model [12]. Different Inputs given to the considered model are class diagram metric, fast and serious class point, objective class point, predictive object point, object oriented project size metrics, objective class point, and object oriented function point [3][4][5], [11][12][13] .
This section represents different metrics to evaluate the source code size of an object oriented system that can be compiled from its UML class diagram.
Class diagram metric has been commonly employed to predict the source code size of an object oriented system. One of the reasons to use this metric is that it is available at the initial stage of development phase. In order to examine the source code size for an object oriented system at the early stage, it is wise to employ the knowledge from the class diagram [15].
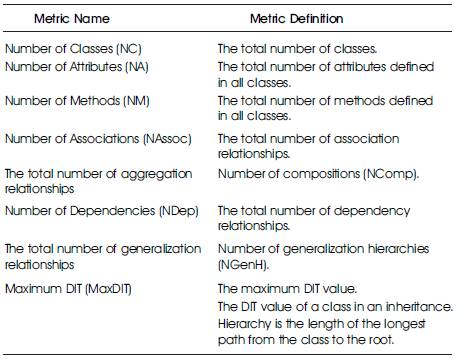
Table 1 summarizes the definitions of the most commonly used CDM available at the analysis phase of an OO software development life cycle.
Table 1. Class Diagram Metrics [15]
The POPs (Predictive Object Points) metric is a size metric developed specifically for object-oriented software by Minkiewicz at PRICE Systems [12] . When sizing an OO system, the POPs metric fulfilled almost all the criteria of OO concepts and was based on the counting scheme of Function Point (FP) method as used in the function/ procedure oriented software development environment. POPs are intended as an improvement over FPs by drawing on well-known metrics associated with an object oriented system. POPs are suitable metrics for estimating the size and subsequently effort [11] .
The OOPS (object-oriented project size points) metric is known as a size metric [3] . It is based on a statistical technique. The main objective of this metric is to obtain the objects point value based on the object component [3], [13] ,[15].
Following steps are used for calculations.
1. Define the name of objects, no. of attributes for each object, method and parameters to those methods
2. For each object Set point value =0.
3. Count each unique token in the object's name, attributes, methods and parameters to the methods. Add it to the Point value. Repeated tokens are not counted.
4. The OOPS metric for the system is the sum of the OOPS points over all classes in the class diagram [15] .
Fast and Serious automatically selects data about the project under analysis from a case tool by Rational Software: Rational Rose 2000 and the steps involved in the process are given in Table 2. This tool is one of the most frequently used case tools in software development organizations for design specification using UML (Unified Modeling Language). The Fast and Serious measurement process involves six major steps, some of them are optional [4].
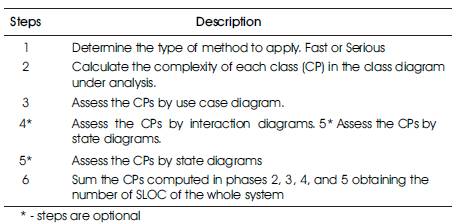
Table 2. Steps Involved in the Fast & Serious Measurement Process
The OCP (Objective Class Points) metric sum up the number of class points in a class diagram [4]. NOT like the other class points [1][2], [4][5], [7][8], [12] . The calculation of OC does not involve any arbitrary factors. For a given class diagram, the OCP metric of the corresponding system is defined as [4]:
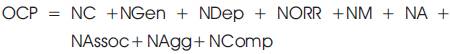
Here
NC = Numbers of Classes,
NGen = Total numbers of Generalization relationships,
NDep = No. of Dependency relationships
NORR = No. of Realization Relationships
NM = No. of Methods,
NA= No. of Attributes
NAssoc = No. of Association relationships
NAgg = No. of Aggregation relationships
NComp = No. of Composition relationships
Since the computation of OCP only uses the information from the class diagram, we may use OCP to build a SLOC prediction model at the early development phase.
Two methods are suggested for predicting the size during the development phase by Antoniol et al. [2]. In the initial phase of the work, utilization of the original FPA methods is recommended. After the design work is over, a method called Object-Oriented Function Points (OOFP) is most advisable. The OOFP method depends on the deliverables of the design phase and attains the advantages of the information, present in the class diagrams. With the help of this method, the gap found between the system abstraction and the abstraction made with class diagrams is likely to be resolved. The method contributes supplementary rules and enables some freedom of choice for the mapping algorithm while class diagrams exhibit complex class hierarchies. The number of attributes and associations with other classes are employed to interpret internal logical file complexity. A straightforward yet indistinguishable rule is employed to deliver the difference between data element types and record element types. The data that are complex are classified as record element types and data types that are simple or primitive are classified as data element types. Transactional functions are recognized according to the methods in the class. These functions are called service requests. Methods that are abstract and inherited are ignored. Number of parameters and global variables referenced in the method determine the method complexity [6] .
G. Antoniol, C. Lokan, G. Caldiera, and R. A. Fiutem (1999) provide the a-means for estimating the size, and subsequently effort and duration, of object oriented software development projects. This tool is proposed to automate the counting method, which helps to find the size predictor. They indicate that OOFP was better than CDM, while forecasting LOC of a system, even though it was unspecified whether their difference was statistically significant.
M. Carbone and G. Santucci (2002) represent a novel method for estimation of OO software projects size using UML diagram. The authors compute the complexity of a system in the form of source lines of code. This paper automates the whole counting process and takes out information regarding UML diagrams from Rational Rose 98 or 2000 petal files. Though this outcome merely based on one system no studies were carry out to inspect whether it can be applied to other systems.
G. Costagliola, G. Ferrucci, G. Tortora, and G. Vitiello (2005) represent an FP-like approach, called class point, which estimate the size of object-oriented products. Two measures are proposed, that are theoretically validated presentation that they fulfill familiar properties necessary for size measures.
From the literature survey it is concluded that there is a powerful requirement to use a large number of systems and modeling techniques to contrast the accuracy of early size estimation approaches.
The authors have analyzed different modeling techniques to examine the accuracy of the metrics used in the paper. They also analyzed which amalgamation of source code size estimation approach and modeling techniques gives the best estimation of source code size. Modeling techniques are explained in Table 3 [15].
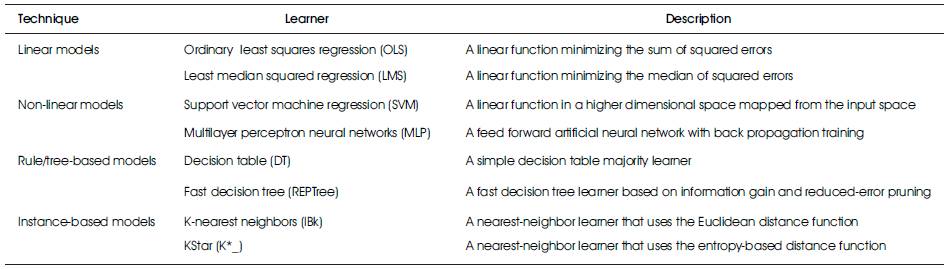
Table 3. Modeling Techniques
These modeling techniques are available in WeKa (Waikato Environment for Knowledge Analysis) open source tool. In the Dataset studied by them, dependent and independent variables present an immensely skewed distribution. As stated in [10] , by applying a natural logarithmic transformation to the data, such skewed distributions could be brought closer to a normal distribution. This might lead to an improvement in the prediction accuracy not only for linear regression models, but also for machine learning models [9][10], [14]. To test the value of the logarithmic transformation, they have reviewed the following models for each modeling technique- the model not along a logarithmic transformation and the model along a logarithmic transformation. With the help of statistical testing, it can predict which models have the remarkably highest accuracy.
This study takes the data from open source Java systems. Study used the Perl API provided by a reverse engineering tool called Understand for Java to analyze its source code to extract the relevant information of the equivalent class diagram.
In this study, the performance measures to evaluate the accuracy of a prediction model: MAR (Mean of Absolute Residuals), MMRE (Mean Magnitude of Relative Error), and Pred(q) (prediction capability at level q). Accuracy measures are based on only two terms, the actual and the predicted values [15].
In this survey, the authors summarize that OOPS is considered to be a leading metric for size estimation and they studied that logarithmic transformation remarkably upgrades the precision of the prediction model. They also studied that SVM model remarkably surpasses every other model besides the OLS model. According to MMRE the best model is OLS. OLS model has remarkably high Pred(25). So it is summarized that model built with integration of OOPS, lograthimic transformation and OLS is optimal for the system size prediction.
Preceding papers emphasis on the validation of the OOPS approach and CDM approach and papers are based on small number of object oriented systems, but the survey emphasis on the immense number of object oriented systems to explore six types of estimation approaches related to size and also used supplementary modeling techniques to examine the accuracy of approaches.
In this study, different modeling techniques are used to build the prediction models for investigating the accuracy of different metrics to estimate SLOC. From all these approaches, object-oriented project size metric behaves excellent when determining code size. It is concluded that the logarithmic transformation in general remarkably improves the Pred(25), MAR and MMRE values for the rule/tree based models, linear and non-linear models. It is true for the DT and MLP models. The model IBk produces worst results when logarithmic transformation is applied. It is recommended that future work can also be extended by using more system and also use some other programming languages, such as Python, Smalltalk and Objective C.