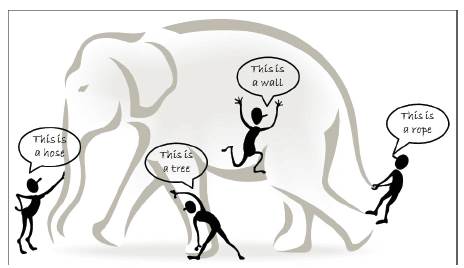
Figure 1. The blind men and the giant elephant: the localized (limited) view of each blind man leads to a biased conclusion
This paper presents the Big Data Mining platforms for parallel computing. Big Data is concerned with large-volume, complex, growing data sets with multiple, autonomous sources. Big Data are now rapidly expanding in all science and engineering domains, including physical, biological and biomedical sciences. In typical data mining systems, the mining procedures require computational intensive computing units for data analysis and comparisons. A computing platform is needed to have efficient access to at least two types of resources: they are data and computing processors. For small scale data mining tasks, a single desktop computer, which contains hard disk and CPU processors, is sufficient to fulfill the data mining goals. Indeed, many data mining algorithms are designed for this type of problem settings. For medium scale data mining tasks, data are typically large (and possibly distributed) and cannot be fit into the main memory. Common solutions rely on parallel computing, collective mining to sample and aggregate data from different sources and then use parallel computing programming. In this paper, the authors have concentrated on the Tier I i.e.,Big Data Mining Platforms by using MapReduce(MR). For this technique the authors follow Distributed Aggregation for Data Parallel computing. Through this technique, there is reduction of network traffic over the network.
Dr. Yan Mo won the 2012 Nobel Prize in Literature. This is probably the most controversial Nobel Prize of this category, as Mo speaks Chinese, lives in a socialist country, and has the Chinese government's support. Searching on Google with “Yan Mo Nobel Prize”, we get 1,050,000 web pointers on the Internet (as of January 3, 2013). “For all praises as well as criticisms,” said Mo recently, “I am grateful.” What types of praises and criticisms has Mo actually received over his 31-year writing career? As comments keep coming on the Internet and in various news media, can we summarize all types of opinions in different media in a real-time fashion, including updated, cross-referenced discussions by critics? This type of summarization program is an excellent example for Big Data processing, as the information comes from multiple, heterogeneous, autonomous sources with complex and evolving relationships, and keeps growing.
Along with the above example, the era of Big Data has arrived (Nature Editorial 2008; Mervis J. 2012; Labrinidis and Jagadish 2012). Every day, 2.5 quintillion bytes of data are created and 90% of the data in the world today were produced within the past two years (IBM 2012). Our capability for data generation has never been so powerful and enormous ever since the invention of the Information Technology in the early 19th century. As another example, on October 4, 2012, the first presidential debate between President Barack Obama and Governor Mitt Romney triggered more than 10 million tweets within two hours (Twitter Blog 2012). Among all these tweets, the specific moments that generated the most discussions revealed the public interests, such as the discussions about Medicare and vouchers. Such online discussions provide a new means to sense the public interests and generate feedback in real-time, and are mostly appealing compared to generic media, such as radio or TV broadcasting. Another example is Flickr, a public picture sharing site, which received 1.8 million photos per day, on an average, from February to March 2012 (Michel F. 2012). Assuming the size of each photo is 2 MegaBytes (MB), this resulted in 3.6 TeraBytes (TB) storage every single day. As “a picture is worth a thousand words”, the billions of pictures on Flicker are a treasure tank for us to explore the human society, social events, public affairs, disasters etc., only if we have the power to harness the enormous amount of data.
The above examples demonstrate the rise of Big Data applications where data collection has grown tremendously and beyond the ability of commonly used software tools to capture, manage, and process within a “tolerable elapsed time”. The most fundamental challenge for the Big Data applications is to explore the large volumes of knowledge for future actions (Rajaraman and Ullman, 2011). In many situations, the knowledge extraction process has to be very efficient and close to real-time because storing all observed data is nearly infeasible. For example, the Square Kilometer Array (SKA) (Dewdney et al. 2009) in Radio Astronomy consists of 1,000 to 1,500 15-meter dishes in a central 5km area. It provides 100 times more sensitive vision than any existing radio telescopes, answering fundamental questions about the Universe.
HACE Theorem: Big Data starts with large-volume, heterogeneous, autonomous sources with distributed and decentralized control. It seeks to explore complex and evolving relationships among data.
These characteristics make it an extreme challenge for discovering useful knowledge from the Big Data. In a naive sense, we can imagine that a number of blind men are trying to size up a giant elephant which will be the Big Data in this context as shown in Figure 1. The goal of each blind man is to draw a picture (or conclusion) of the elephant according to the part of information he collected during the process. Because each person's view is limited to his local region, it is not surprising that the blind men will each conclude independently that the elephant “feels” like a rope, a hose, or a wall, depending on the region each of them is limited to. To make the problem even more complicated, let's assume that (a) the elephant is growing rapidly and its pose also changes constantly, and (b) the blind men also learn from each other while exchanging information on their respective feelings on the elephant. Exploring the Big Data in this scenario is equivalent to aggregating heterogeneous information from different sources (blind men) to help draw a best possible picture to reveal the genuine gesture of the elephant in a real-time fashion. Indeed, this task is not as simple as asking each blind man to describe his feelings about the elephant and then getting an expert to draw one single picture with a combined view, concerning that each individual may speak a different language (heterogeneous and diverse information sources) and they may even have privacy concerns about the messages they deliberate in the information exchange process.
One of the fundamental characteristics of the Big Data is the huge volume of data represented by heterogeneous and diverse dimensionalities. This is because different information collectors use their own schemata for data recording, and the nature of different applications also results in diverse representations of the data. For example, each single human being in a bio-medical world can be represented by using simple demographic information such as gender, age, family disease history etc. For X-ray examination and CT scan of each individual, images or videos are used to represent the results because they provide visual information for doctors to carry detailed examinations. For a DNA or genomic related test, microarray expression images and sequences are used to represent the genetic code information because this is the way that our current techniques acquire the data. Under such circumstances, the heterogeneous features refer to the different types of representations for the same individuals, and the diverse features refer to the variety of features involved to represent each single observation. Imagine that different organizations (or health practitioners) may have their own schemata to represent each patient, the data heterogeneity and diverse dimensionality issues become major challenges if we are trying to enable data aggregation by combining data from all sources.
Figure 1. The blind men and the giant elephant: the localized (limited) view of each blind man leads to a biased conclusion
Autonomous data sources with distributed and decentralized controls are a main characteristic of Big Data applications. Being autonomous, each data source is able to generate and collect information without involving (or relying on) any centralized control. This is similar to the World Wide Web (WWW) setting where each web server provides a certain amount of information and each server is able to fully function without necessarily relying on other servers. On the other hand, the enormous volumes of data also make an application vulnerable to attacks or malfunctions, if the whole system has to rely on any centralized control unit. For major Big Data related applications, such as Google, Flickr, Facebook, and Walmart, a large number of server farms are deployed all over the world to ensure nonstop services and quick responses for local markets. Such autonomous sources are not only the solutions of the technical designs, but also the results of the legislation and the regulation rules in different countries/regions. For example, Asian markets of Walmart are inherently different from its North American markets in terms of seasonal promotions, top sell items, and customer behaviors. More specifically, the local government regulations also impact on the wholesale management process and eventually result in data representations and data warehouses for local markets.
In an early stage of data centralized information systems, the focus is on finding best feature values to represent each observation. This is similar to using a number of data fields, such as age, gender, income, education background etc., to characterize each individual. This type of sample-feature representation inherently treats each individual as an independent entity without considering their social connections which is one of the most important factors of the human society. People form friend circles based on their common hobbies or connections by biological relationships. Such social connections commonly exist in not only our daily activities, but also are very popular in virtual worlds. For example, major social network sites, such as Facebook or Twitter, are mainly characterized by social functions such as friend-connections and followers (in Twitter). The correlations between individuals inherently complicate the whole data representation and any reasoning process. In the sample-feature representation, individuals are regarded similar if they share similar feature values, whereas in the sample - feature - relationship representation, two individuals can be linked together (through their social connections) even though they might share nothing in common in the feature domains at all. In a dynamic world, the features used to represent the individuals and the social ties used to represent our connections may also evolve with respect to temporal, spatial, and other factors. Such a complication is becoming part of the reality for Big data applications, where the key is to take the complex (non-linear, many-tomany) data relationships, along with the evolving changes into consideration, to discover useful patterns from Big Data collections.
The research challenges form a three tier structure and center around the “Big Data mining platform” (Tier I), which focuses on low-level data accessing and computing. Challenges on information sharing and privacy, and Big Data application domains and knowledge form Tier II, which concentrates on high level semantics, application doma inknowledge, and user privacy issues Machanavajjhala and Reiter (2012). The outmost circle shows Tier III challenges on actual mining algorithms.
For an intelligent learning database system (Wu 2000) to handle Big Data, the essential key is to scale up to the exceptionally large volume of data and provide treatments for the characteristics featured by the aforementioned HACE theorem. Figure 2 shows a conceptual view of the Big Data processing framework, which includes three tiers from inside out with considerations on data accessing and computing (Tier I), data privacy and domain knowledge (Tier II), and Big Data mining algorithms (Tier III).
The challenges at Tier I focus on data accessing and actual computing procedures. Because Big Data are often stored at different locations and data volumes may continuously grow, an effective computing platform will have to take distributed large-scale data storage into consideration for computing. For example, while typical data mining algorithms require all data to be loaded into the main memory, this is becoming a clear technical barrier for Big Data because moving data across different locations is expensive (e.g., subject to intensive network communication and other IO costs), even if we do have a super large main memory to hold all data for computing.
The challenges at Tier II center around semantics and domain knowledge for different Big Data applications. Such information can provide additional benefits to the mining process, as well as add technical barriers to the Big Data access (Tier I) and mining algorithms (Tier III). For example, depending on different domain applications, the data privacy and information sharing mechanisms between data producers and data consumers can be significantly different. Sharing sensor network data for applications like water quality monitoring may not be discouraged, whereas releasing and sharing mobile users' location information is clearly not acceptable for majority, if not all applications. In addition to the above privacy issues, the application domains can also provide additional information to benefit or guide Big Data mining algorithm designs. For example, in market basket transactions data, each transaction is considered independent and the discovered knowledge is typically represented by finding highly correlated items, possibly with respect to different temporal and/or spatial restrictions. In a social network, on the other hand, users are linked and share dependency structures. The knowledge is then represented by user communities, leaders in each group, and social influence modeling etc. Therefore, understanding semantics and application knowledge is important for both low-level data access and for high level mining algorithm designs.
At Tier III, the data mining challenges concentrate on algorithm designs in tackling the difficulties raised by the Big Data volumes, distributed data distributions, and by complex and dynamic data characteristics. The circle at Tier III contains three stages. Firstly, sparse, heterogeneous, uncertain, incomplete, and multi-source data are preprocessed by data fusion techniques. Secondly, complex and dynamic data are mined after preprocessing. Thirdly, the global knowledge that is obtained by local learning and model fusion is tested and relevant information is fed back to the pre-processing stage. Then the model and parameters are adjusted according to the feedback. In the whole process, information sharing is not only a promise of smooth development of each stage, but also a purpose of Big Data processing.
In Figure 2, the authors elaborate the challenges with respect to the three tier framework.
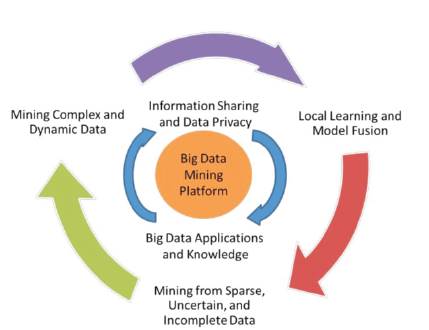
Figure 2. A Big Data processing framework:
In typical data mining systems, the mining procedures require computational intensive computing units for data analysis and comparisons. A computing platform is needed to have efficient access to at least two types of resources: data and computing processors. For small scale data mining tasks, a single desktop computer, which contains hard disk and CPU processors, is sufficient to fulfill the data mining goals. Indeed, many data mining algorithms are designed to handle this type of problem settings. For medium scale data mining tasks, data are typically large (and possibly distributed) and cannot be fit into the main memory. Common solutions are to rely on parallel computing (Shafer et al. 1996; Luo et al. 2012) or collective mining(Chen et al. 2004) to sample and aggregate data from different sources and then use parallel computing programming (such as the Message Passing Interface) to carry out the mining process.
For Big Data mining, data scale is far beyond the capacity that a single Personal Computer (PC) can handle. A typical Big Data processing framework will rely on cluster computers with a high performance computing platform, where a data mining task is deployed by running some parallel programming tools, such as MapReduce or ECL (Enterprise Control Language), on a large number of computing nodes (i.e., clusters). The role of the software component is to make sure that a single data mining task finding the best match of a query from a database with billions of samples is split into many small tasks each of which is running on one or multiple computing nodes. For example, the world’s most powerful super computer Titan, is deployed at Oak Ridge National Laboratory in Tennessee, USA, which contains 18,688 nodes each with a 16-core CPU.
For Big Data mining, data scale is far beyond the capacity that a single Personal Computer (PC) can handle. A typical Big Data processing framework will rely on cluster computers with a high performance computing platform, where a data mining task is deployed by running some parallel programming tools, such as MapReduce or ECL (Enterprise Control Language), on a large number of computing nodes (i.e., clusters). The role of the software component is to make sure that a single data mining task finding the best match of a query from a database with billions of samples is split into many small tasks each of which is running on one or multiple computing nodes. For example, the world’s most powerful super computer Titan, is deployed at Oak Ridge National Laboratory in Tennessee, USA, which contains 18,688 nodes each with a 16-core CPU.
Such a Big Data system, which blends both hardware and software components, is hardly available without key industrial stockholders' support. In fact, for decades, companies have been making business decisions based on transactional data stored in relational databases. Big Data mining offers opportunities to go beyond their relational databases to rely on less structured data: weblogs, social media, email, sensors, and photographs that can be mined for useful information. Major business intelligence companies, such IBM, Oracle, Teradata etc., have all featured their own products to help customers acquire and organize these diverse data sources and coordinate with customers' existing data to find new insights and capitalize on hidden relationships.
Semantics and application knowledge in Big Data refer to numerous aspects related to the regulations, policies, user knowledge, and domain information. The two most important issues at this tier include (1) data sharing and privacy; and (2) domain and application knowledge. The former provides answers to resolve concerns on how data are maintained, accessed, and shared; whereas the latter focuses on answering questions like “what are the underlying applications ?” and “what are the knowledge or patterns users intend to discover from the data ?”.
Information sharing is an ultimate goal for all systems involving multiple parties (Howe et al. 2008). While the motivation for sharing is clear, a real-world concern is that Big Data applications are related to sensitive information, such as banking transactions and medical records. Simple data exchanges or transmissions do not resolve privacy concerns (Duncan 2007, Huberman 2012, Schadt 2012). For example, knowing people's locations and their preferences, one can enable a variety of useful location-based services. But public disclosure of an individual's movements over time can have serious consequences for privacy. To protect privacy, two common approaches are to restrict access to the data, such as adding certification or access control to the data entries. Sensitive information is accessible by a limited group of users only, and anonymize data fields such that sensitive information cannot be pinpointed to an individual record (Cormode and Srivastava 2009). For the first approach, common challenges are to design secured certification or access control mechanisms, such that no sensitive information can be misconducted by unauthorized individuals. For data anonymization, the main objective is to inject randomness into the data to ensure a number of privacy goals. For example, the most common k-anonymity privacy measure is to ensure that each individual in the database must be indistinguishable from k−1 others. Common anonymization approaches are to use suppression, generalization, perturbation, and permutation to generate an altered version of the data, which is, in fact, some uncertain data.
One of the major benefits of the data annomization based information sharing approaches is that, once anonymized, data can be freely shared across different parties without involving restrict access controls. This naturally leads to another research area namely privacy preserving data mining (Lindell and Pinkas 2000), where multiple parties, each holding some sensitive data, are trying to achieve a data mining goal without sharing any sensitive information inside the data. This privacy preserving mining goal, in practice, can be solved through two types of approaches including (1) using some communication protocols, such as Yao's protocol (Yao 1986), to request the distributions of the whole dataset, rather than requesting the actual values of each record, or (2) to design some special data mining methods to derive knowledge from anonymized data (this is inherently similar to the uncertain data mining methods).
Domain and application knowledge (Kopanas et al. 2002) provides essential information for designing Big Data mining algorithms and systems. In a simple case, domain knowledge can help identify the right features for modeling the underlying data (e.g., blood glucose level is clearly a better feature than body mass in diagnosing Type II diabetes). The domain and application knowledge can also help design achievable business objectives by using Big Data analytical techniques. For example, stock market data are a typical domain which constantly generates a large quantity of information, such as bids, buys, and puts, in every single second. The market continuously evolves and is impacted by different factors, such as domestic and international news, government reports, and natural disasters etc. An appealing Big Data mining task is to design a Big Data mining system to predict the movement of the market in the next one or two minutes. Such systems, even if the prediction accuracy is just slightly better than random guess, will bring significant business values to the developers(Bughin et al. 2010). Without correct domain knowledge, it is a clear challenge to find effective matrices/measures to characterize the market movement, and such knowledge is often beyond the mind of the data miners, although some recent research has shown that using social networks, such as Twitter, it is possible to predict the stock market upward/downward trends(Bollen et al. 2011) with good accuracies.
As Big Data applications are featured with autonomous sources and decentralized controls, aggregating distributed data sources to a centralized site for mining is systematically prohibitive due to the potential transmission cost and privacy concerns. On the other hand, although we can always carry out mining activities at each distributed site, the biased view of the data collected at each different site often leads to biased decisions or models, just like the elephant and blind men case. Under such a circumstance, a Big Data mining system has to enable an information exchange and fusion mechanism to ensure that all distributed sites (or information sources) can work together to achieve a global optimization goal. Model mining and correlations are the key steps to ensure that models or patterns discovered from multiple information sources can be consolidated to meet the global mining objective. More specifically, the global mining can be featured with a twostep (local mining and global correlation) process, at data, model, and at knowledge levels. At the data level, each local site can calculate the data statistics based on the local data sources and exchange the statistics between sites to achieve a global data distribution view. At the model or pattern level, each site can carry out local mining activities, with respect to the localized data, to discover local patterns. By exchanging patterns between multiple sources, new global patterns can be synthetized by aggregating patterns across all sites (Wu and Zhang 2003). At the knowledge level, model correlation analysis investigates the relevance between models generated from different data sources to determine how relevant the data sources are correlated to each other, and how to form accurate decisions based on models built from autonomous sources.
Spare, uncertain, and incomplete data are defining features for Big Data applications. Being sparse, the number of data points is too few for drawing reliable conclusions. This is normally a complication of the data dimensionality issues, where data in a high dimensional space (such as more than 1000 dimensions) does not show clear trends or distributions. For most machine learning and data mining algorithms, high dimensional spare data significantly deteriorate the difficulty and the reliability of the models derived from the data. Common approaches are to employ dimension reduction or feature selection (Wu et al. 2012) to reduce the data dimensions or to carefully include additional samples to decrease the data scarcity, such as generic unsupervised learning methods in data mining.
Uncertain data are a special type of data reality where each data field is no longer deterministic, but is subject to some random/error distributions. This is mainly linked to domain specific applications with inaccurate data readings and collections. For example, data produced from GPS equipment is inherently uncertain, mainly because the technology barrier of the device limits the precision of the data to certain levels (such as 1 meter). As a result, each recording location is represented by a mean value plus a variance to indicate expected errors. For data privacy related applications (Mitchell 2009), users may intentionally inject randomness/errors into the data in order to remain anonymous. This is similar to the situation that an individual may not feel comfortable to let you know his/her exact income, but will be fine to provide a rough range like [120k, 160k]. For uncertain data, the major challenge is that each data item is represented as some sample distributions but not as a single value, so most existing data mining algorithms cannot be directly applied. Common solutions are to take the data distributions into consideration to estimate model parameters. For example, error aware data mining (Wu and Zhu 2008) utilizes the mean and the variance values with respect to each single data item to build a Naïve Bayes model for classification. Similar approaches have also been applied for decision trees or database queries. Incomplete data refers to the missing of data field values for some samples. The missing values can be caused by different realities, such as the malfunction of a sensor node, or some systematic policies to intentionally skip some values (e.g., dropping some sensor node readings to save power for transmission). While most modern data mining algorithms have inbuilt solutions to handle missing values (such as ignoring data fields with missing values), data imputation is an established research field which seeks to impute missing values in order to produce improved models (compared to the ones built from the original data). Many imputation methods (Efron 1994) exist for this purpose, and the major approaches are to fill most frequently observed values or to build learning models to predict possible values for each data field, based on the observed values of a given instance
The rise of Big Data is driven by the rapid increase of complex data and their changes in volumes and nature (Birney 2012). Documents posted on WWW servers, Internet backbones, social networks, communication networks, and transportation networks etc. are all featured with complex data. While complex dependency structures underneath the data raise the difficulty for our learning systems, they also offer exciting opportunities that simple data representations are incapable of achieving. For example, researchers have successfully used Twitter, a well-known social networking facility, to detect events such as earthquakes and major social activities, with nearly online speed and very high accuracy. In addition, the knowledge of people's queries to search engines also enables a new early warning system for detecting fast spreading flu outbreaks (Helft 2008). Making use of complex data is a major challenge for Big Data applications, because any two parties in a complex network are potentially interested in each other with a social connection. Such a connection is quadratic with respect to the number of nodes in the network, so a million node network may be subject to one trillion connections.
For a large social network site like Facebook, the number of active users has already reached 1 billion, and analyzing such an enormous network is a big challenge for Big Data mining. If we take daily user actions/interactions into consideration, the scale of difficulty will be even more astonishing.
Inspired by the above challenges, many data mining methods have been developed to find interesting knowledge from Big Data with complex relationships and dynamically changing volumes. For example, finding communities and tracing their dynamically evolving relationships are essential for understanding and managing complex systems (Aral and Walker 2012, Centola 2010). Discovering outliers in a social network (Borgatti et al. 2009) is the first step to identify spammers and provide safe networking environments to our society.
If only facing with huge amounts of structured data, users can solve the problem simply by purchasing more storage or improving storage efficiency. However, Big Data complexity is represented in many aspects, including complex heterogeneous data types, complex intrinsic semantic associations in data, and complex relationship networks among data. That is, to say the value of Big Data is in its complexity.
Complex heterogeneous data types: In Big Data, data types include structured data, unstructured data, and semi-structured data etc. Specifically, there are tabular data (relational databases), text, hyper-text, image, audio and video data etc. The existing data models include keyvalue stores, bigtable clones, document databases, and graph database, which are listed in an ascending order of the complexity of these data models. Traditional data models are incapable of handling complex data in the context of Big Data. Currently, there is no acknowledged effective and efficient data model to handle Big Data.
Complex intrinsic semantic associations in data: news on the Web, comments on Twitter, pictures on Flickr and clips of video on YouTube may discuss about an academic award-winning event at the same time. There is no doubt that there are strong semantic associations in these data. Mining complex semantic associations from “text-imagevideo imagevideo” data will significantly help improve application system performance such as search engines or recommendation systems. However, in the context of Big Data, it is a great challenge to efficiently describe semantic features and to build semantic association models to bridge the semantic gap of various heterogeneous data sources.
In the context of Big Data, there exist relationships between individuals. On the Internet, individuals are webpages and the pages linking to each other via hyperlinks form a complex network. There also exist social relationships between individuals forming complex social networks, such as big relationship data from Facebook, Twitter, LinkedIn and other social media [Banerjee and Agarwal 2012, Chen et al. 2012, Zhao et al. 2012], including call detail records (CDR), devices and sensors information [Ahmed and Karypis 2012, Silva et al. 2012], GPS and geo-coded map data, massive image files transferred by the Manage File Transfer protocol, Web text and click-stream data [Alam et al. 2012], scientific information, e-mail [Liu and Wang 2012], etc. To deal with complex relationship networks, emerging research efforts have begun to address the issues of structure-andevolution, crowds-and-interaction, and information-andcommunication.
The emergence of Big Data has also spawned new computer architectures for real-time data-intensive processing, such as the open source project Apache Hadoop which runs on high-performance clusters. The size or complexity of the Big Data, including transaction and interaction data sets, exceeds a regular technical capability in capturing, managing, and processing these data within reasonable cost and time limits. In the context of Big Data, real-time processing for complex data is a very challenging task.
Big Data Mining Platforms (Tier I): Due to the multi-source, massive, heterogeneous and dynamic characteristics of application data involved in a distributed environment, one of the important characteristics of Big Data is computing tasks on the petabytes (PB), even the exabyte (EB)-level data with a complex computing process. Therefore, utilizing a parallel computer infrastructure, its corresponding programming language support, and software models to efficiently analyze and mine the distributed PB, even EB-level data are the critical goals for Big Data processing to change from “quantity” to “quality”.
Currently, Big Data processing mainly depends on parallel programming models like MapReduce, as well as providing a cloud computing platform of Big Data services for the public. MapReduce is a batch-oriented parallel computing model. There is still a certain gap in performance with relational databases. How to improve the performance of MapReduce and enhance the realtime nature of large-scale data processing is a hot topic in research. The MapReduce parallel programming model has been applied in many machine learning and data mining algorithms. Data mining algorithms usually need to scan through the training data for getting the statistics to solve or optimize model parameters. It calls for intensive computing to access the large-scale data frequently. In order to improve the efficiency of algorithms, Chu et al. proposed a general-purpose parallel programming method which is applicable to a large number of machine learning algorithms based on the simple MapReduce programming model on multi-core processors
MapReduce is a programming model and an associated implementation for processing and generating large datasets that is amenable to a broad variety of real-world tasks. Users specify the computation in terms of a map and a reduce function, and the underlying runtime system automatically parallelizes the computation across large-scale clusters of machines, handles machine failures, and schedules inter-machine communication to make efficient use of the network and disks. Programmers find the system easy to use. More than ten thousand distinct MapReduce programs have been implemented internally at Google over the past four years, and an average of one hundred thousand MapReduce jobs are executed on Google's clusters every day, processing a total of more than twenty petabytes of data per day.
Many data-mining computations have as a fundamental subroutine a GroupBy-Aggregate operation. This takes a dataset, partitions its records into groups according to some key, then performs an aggregation over each resulting group. Group-By-Aggregate is useful for summarization, e.g. finding average household income by zip code from a census dataset, but it is also at the heart of the distributed implementation of algorithms such as matrix multiplication. The ability to perform Group- By-Aggregate at scale is therefore increasingly important, both for traditional data-mining tasks and also for emerging applications such as web-scale machine learning and graph analysis.
Group-By-Aggregate has emerged as a canonical execution model in the general-purpose distributed computing literature. Systems like MapReduce and Hadoop allow programmers to decompose an arbitrary computation into a sequence of maps and reductions, which are written in a full- edged high level programming language (C++ and Java, respectively) using arbitrary complex types.
SQL-like programming interface simplifies common dataprocessing tasks. Unfortunately, the underlying execution plan must still be converted into a sequence of maps and reductions for Hadoop to execute, precluding many standard parallel database optimizations (Charg et. al 2009).
This paper explains user-defined aggregation and gives an overview of how a Group-By-Aggregate computation can be distributed
This section discusses the functions that must be supplied in order to perform general-purpose user defined aggregations. Our example execution plan shows a map followed by an aggregation. However, in general, an aggregation might, for example, consume the output of more complex processing such as a Join or a previous aggregation. The authors explain the concepts using the iterator-based programming model adopted by MapReduce and Hadoop and discuss the alternatives used by parallel databases. The authors use an integeraverage computation as a running example. It is much simpler than most interesting user-defined aggregations, and is included as a primitive in many systems, however its implementation has the same structure as that of many much more complex functions.
The MapReduce programming model supports grouped aggregation using a user-supplied functional programming primitive called Reduce.
Reduce: hK; Sequence of Ri ! Sequence of S takes a sequence of records of type R, all with the same key of type K, and outputs zero or more records of type S.
Here is the pseudocode for a Reduce function to compute integer average:
With this user-defined function, and merge and grouping operators provided by the system, it is possible to execute a simple distributed computation as shown in Figure 3. The computation has exactly two phases: the rst phase executes a Map function on the inputs to extract keys and records, then performs a partitioning of these outputs based on the keys of the records. The second phase collects and merges all the records with the same key, and passes them to the Reduce function. (This second phase is equivalent to Group-By followed by Aggregate in the database literature.)
As we shall see in the following sections, “many optimizations for distributed aggregation rely on computing and combining \partial aggregations." Suppose that aggregating the sequence Rk of all the records with a particular key k results in output Sk. A partial aggregation computed from a subsequence r of Rk is an intermediate result with the property that, partial aggregations of all the subsequences of Rk can be combined to generate Sk. Partial aggregations may exist, for example, when the aggregation function is commutative and associative, and below formalizes the notion of decomposable functions which generalize this case. For our running example of integer average, a partial aggregate contains a partial sum and a partial count:
Often the partial aggregation of a subsequence r is much smaller than r itself: in the case of average, for example, the partial sum is just two values, regardless of the number of integers that have been processed. When there is such substantial data reduction, partial aggregation can be introduced both as part of the initial Map phase and in an aggregation tree, as shown in Figure 4, to greatly reduce network traffic. In order to decompose a user-defined aggregation using partial aggregation, it is necessary to introduce auxiliary functions, called “Combiners" that synthesize the intermediate results into the final output. The MapReduce system described can perform partial aggregation on each local computer before transmitting data across the network, but does not use an aggregation tree.
In order to enable partial aggregation, a user of MapReduce must supply three functions:
In simple cases such as Sum or Min, the types R, X and S are all the same, and InitialReduce, Combine and FinalReduce can all be computed using the same function. Three separate functions are needed even for straightforward computations such as integer average.
Definition 1.
The authors use x to denote a sequence of data items, and use x1  x2 to denote the concatenation of x1 and x2. A function H is decomposable if there exist two functions I and C satisfying the following conditions:
x2) = C(I(x1 x2)) = C(I(x1) I(x2))x2) = I(x2 x1)x2) = C(x2 x1)Definition 2.
A function H is associative-decomposable, if there exist two functions I and C satisfying conditions 1-3 above, and in addition C is associative: for all x1; x2; x3 : C(C(x1 x2) _x3) = C(x1 C(x2 x3))
If an aggregation computation can be represented as a set of associative-decomposable functions followed by some final processing, then it can be split up in such a way that the query plan in Figure 3 can be applied. If the computation is instead formed from decomposable functions followed by final processing, then the plan from Figure 4 can be applied, but without any intermediate aggregation stages. If the computation is not decomposable then the plan from Figure 3 is required.
Intuitively speaking, I and C correspond to the InitialReduce and Combine functions for MapReduce that were described in the preceding section. However, there is a small but important difference. Decomposable functions can be a class of functions with certain algebraic properties without referring to the aggregationspecific key. This separation of the key type from the aggregation logic makes it possible for the system to automatically optimize the execution of complex reducers that are build up from a combination of decomposable functions
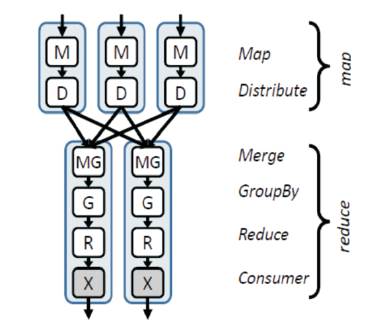
Figure 3. Distributed execution plan for MapReduce when reduce cannot be decomposed to perform partial aggregation
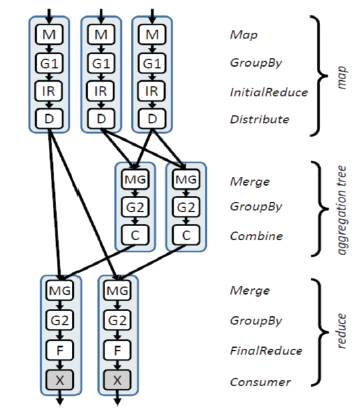
Figure 4. Distributed execution plan for MapReduce when reduce supports partial aggregation
In this paper, the authors have solved and observed the technique to get data with the help of distributed aggregation over the big data with the help of parallel computing. When the aggregation involves more complex user-defined functions and data types, the database programming is used.
The MapReduce programming model has been successfully used at Google for many different purposes. The authors attribute this success to several reasons. First, the model is easy to use, even for programmers without experience with parallel and distributed systems, since it hides the details of parallelization, fault tolerance, locality optimization, and load balancing. Second, a large variety of problems are easily expressible as MapReduce computations.