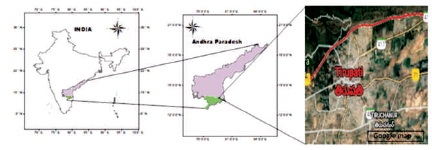
Figure 1. Study Area
Land use/land cover (LULC) information in the form of maps is essential for the planning, supervising natural resources, utilisation of land to meet the increasing human demands and monitoring changes in the ecosystem. In this study, remote sensing data and geographic information system applications were used to analyse the LULC and its changes in Tirupati, which is located in the Seshachalam hill range in the Chittoor district of Andhra Pradesh (AP) state, South India. The study area is a world-famous pilgrimage centre and fast-developing town. Therefore, updated LULC maps must be created for various departments. The aim of this study was to classify and determine changes in the LULC over the 40-year period 1978-2018 by using multi-temporal Landsat satellite images and Survey of India toposheet map. The 1978 and 2018 Landsat images and field survey data were selected to classify the data. The ERDAS Imagine v16 and ArcGIS v10.1 were used to process images and assess the changes in land use of this study area. Classification was performed using the maximum likelihood classifier algorithm of supervised classification. Images were classified into five major classes: forest, water bodies, agricultural land, barren land, and built-up land. A post-classification change detection technique was used here to find changes in LULC. Changes were mainly observed in the built-up areas. The results demonstrate that during the forty years period, built-up area and barren land/other land increased 454.33%, and 104.7%, respectively and area under waterbodies, agriculture, and forest decreased to 73.07%, 61.84%, and 31%, respectively. In future, these changes may have a significant influence on the ecosystem.
Land cover refers to how much of a region is covered by forests, wetlands, impermeable surfaces; agriculture, water, and other types. Land use refers to how humans use the landscape - whether for development, conservation, or mixed uses. Land use includes recreation area, flora and fauna habitat area, and farming land and built up land, etc. (Prakasam, 2010).
LULC change is majorly encouraged by human activities and at the same time, resulting to changes in human livehood. Human beings have been modifying the availability of different resources like vegetation, soil, water to obtain food and other essentials for hundreds of years (Toure, Stow, Shih, Weeks, & Lopez-Carr, 2018; Kaliraj, Chandrasekar, Ramachandran, Srinivas, & Saravanan, 2017). Land management strategies involving the transformation of forests and wet lands for agricultural and industrial activities are the main cause for the changes in the land use. The changes in LULC include loss of agricultural lands, loss of forest lands, increase of builtup area, decrease of impermeable surface, etc. Changes in the land cover are acquired even in the absence of human actions through natural processes like floods, droughts, and others (Sundarakumar, Harika, Begum, Yamini, & Balakrishna, 2012). All these changes encompass the greatest environmental concerns of humans today, including pollution of water, air, and soil and climate change. LULCC observed at regional, local and global scales, collectively they are specific features of global environmental change (Islam, Jashimuddin, Nath, & Nath, 2018). Monitoring the negative impacts happening on land, while sustaining the production of essential resources has become a main concern of researchers. LULC maps are much useful for the metropolitan planners and policymakers (Sundarakumar et al., 2012). Identifying and monitoring of change in land trajectories is important for environmental monitoring studies, management of natural national resources, and development activities (Vishwakarma, Somanath, Rai, Kamal, & Mukherjee, 2016; Reddy, 2008).
Study area, Tirupati is one of the most popular towns in Andhra Pradesh, South India and is a world famous pilgrimage center. Forest is the major natural resource in Tirupati. Because of developmental and human activities, the land under forest is decreasing. Land covered by agriculture activities is also reducing. Population growth in town, smart city, floating polupation by pilgrims and tourism development activities are altering the land characteristics. Updated and accurate LULC maps are required to assert the land degradation in Tirupati area (Arveti, Etikala, & Dash, 2016).
Satellite remote sensing and geospatial analysis, together proved they are capable in preparing accurate LULC maps and monitoring changes frequently otherwise it is quite difficult with traditional system of surveying (Sundarakumar et al., 2012; Ballany & Nair, 2002). Remote sensing techniques have proved their ability to study the change at global and regional scales with the availability of multispectral satellite data of high spatial and temporal resolutions (Foody, 2002; Kafi, Shafri, & Shariff, 2014). Updated and accurate LULC maps are prepared at low cost with good accuracy and in a short period of time by the satellite remote sensing and GIS techniques (Kar, Reddy, Kumar, & Singh, 2018).
Multi-resolution (temporal, spatial, and spectral) data available since 1970s helps in the analysis of long term environmental changes and impacts of human induced changes in the land surface. Landsat mission provides medium resolution data, downloaded freely from USGS website (Islam et al., 2018). Landsat satellites acquire continuously space-based images of Earth's surface, providing data preferred for understanding of land features. Landsat data is useful to study a number of applications including agriculture, geology, forestry, and regional planning (US Geological Survey, 2016). Many researchers are using Landsat images to study land characteristics and their changes regularly. Spatially explicit temporal data helps in the mapping and monitoring spatio-temporal changes (Kar et al., 2018). Understanding the causal factors with these changes is necessary to develop alleviation and adaptation schemes to minimize future troubles.
Newly developed techniques by researchers and others provide relatively accurate information on LULCC analysis and transformation of LULC characteristics in the area of interest. Among them, the MLC classifier of supervised classification is widely used for classifying maximum likelihood pixels in the image. Using MLC classifier, Landsat images provide relatively accurate result in classification (Gadrani, Lominadze, & Tsitsagi, 2018; Mubako, Belhaj, Heyman, Hargrove, & Reyes, 2018). Postclassification comparison technique provides relatively accurate result in changes in each class (Mas, 1999; Singh, 1989). In the present study, Landsat images (1978 and 2018) were classified using the MLC classifier to deliver the basic information for understanding the recent trends in landuse and land-cover changes in the Tirupati area in the past forty years.
The study area (Tirupati) comprises of Tirupti urban and Tirupati rural mandals, North-East part of Chittoor district of Rayalaseema region of Ahdhra Pradesh, South India. Tirupati town is the world famous pilgrim centre in India. It is located at the foothills of Seshechalam hill range at a distance 550 km south of hyderabad and 100 km north of Chennai. The study area falls in between 13' 45' N and 13' 34' N latitude and 79' 15' E and 79' 29' E longitude. The Tirupati urban was bounded by Renigunta mandal in the east, Chandragiri rnandal in the West, Ramachandrapuram, and Vadeunapaleta mandals in the South, and Eastern Ghats in the North. It has an average elevation of 161 m (528 ft). The Tirumala hill has an average elevation of 980 m above sea level. The study area is covered in survey of India (SOI) Toposheet No. 57/06 on 1 : 50,000 scale and prepared in 1978. The study area is shown in Figure 1.
Figure 1. Study Area
Landsat imagery was used to map temporal changes in the study area. For this purpose, Landsat-1 MSS (1978), Landsat-8 OLI (2018), and Topographic sheet 76 were used. Lansat-MSS, OLI images were obtained from online USGS website, for years 1978 and 2018, respectively (Islam et al., 2018). The false color composite images and topographic map were geometrically corrected and registered by selecting ground control points using Autosync workstation module of (ERDAS, n.d.) software. After that satellite raw images were enhanced through histogram equalization technique. The study area was clipped using the subset tool. Clipped area was used for classification and change detection analysis. The methodology followed in this study is presented in Figure 2.
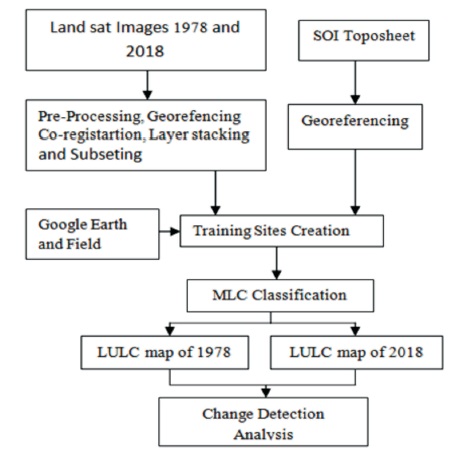
Figure 2. Flowchart for Change Detection Analysis
Multi temporal Landsat images of the study area were used to study and classify the land cover types. Remote sensing includes three main image classification techniques: unsupervised classification, supervised classification, and object-based image classification. The Maximum Likelyhood Classifier (MLC) algorithm of supervised classification was used in this study. The MLC has been widely used technique for classification of medium-resolution satellite imagery. The spectral signature files developed for desired classes were used during classification (Sundarakumar et al., 2012; Islam et al., 2018). Classes and its details were presented in Table 1. Classification was performed using the MLC. This algorithm, according to ERDAS, computes the weighted distance of an unknown vector belonging to one of the known classes.
Subset area (Landsat MSS for 1978 and Landsat 8 OLI for 2018) was registered using the AutoSync workstation module in ERDAS IMAGINE 14 (ERDAS, n.d.). The images were registered by georeferencing the images with latitude and longitude values from the already georeferenced SOI toposheet of the study area (Yuan, Cui, Qiu, Gu, & Zhang, 2013). After registration, both the data sets were trained through visual interpretation and MLC supervised classification was performed for producing the LULC thematic maps (Islam et al., 2018; Vishwakarma et al., 2016). The area occupied by different classes in both years was obtained from the attribute table. After image classification, the post-classification comparison technique was performed (Mas, 1999), where an LULC map one dataset (1978) was compared with an LULC map from another dataset (2018). According to the comparison, the changes occurring between the two study years are presented quantitatively.
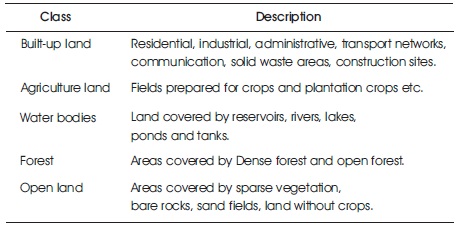
Table 1. Classes and their Description
The LULC map layout generated from the Landsat MSS dataset is displayed in Figure 3 using Arc GIS 10.1. The land categories for the year 1978 and their statistics are listed in Table 2. According to the results, the largest category was agriculture land (47.83 km2, 39.84% of the total area), followed by forest (37.66 km2, 31.38% of the total area). The remaining land use categories were settlements with homestead trees (built-up) (6.81 km2, 5.7% of the total area), barren land/other land (17.87 km2, 14.89% of the total area), and water (9.83 km2, 8.19% of the total area).
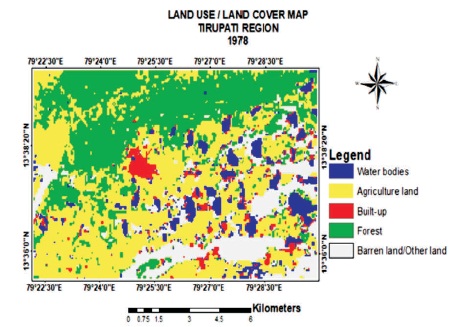
Figure 3. LULC Map of Study Area in 1978
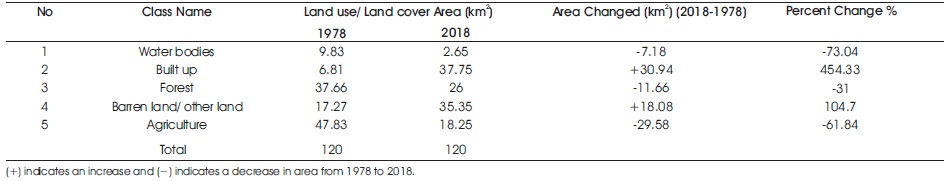
Table 2. Area under Each LULC Class in the 1978 and 2018 Datasets and Change in the 2 Area of Each LULC Class Over 40 Years (in km and Percentage)
The classified image for 2018 (Figure 4) was produced using the Landsat 8 dataset. According to the 2018 results, the land area mainly comprised barren land/other land (41.55 km2, 34.63% of the total land), followed by settlement land (37.75 km2, 30.94% of the total area). The land use categories were forest land (26.08 km2, 21.67% of the total area), agriculture land (18.25 km2, 15.21% of the total area), and waterbodies (2.65 km2, 2.21% of the total area). The land use categories for 2018 and their statistics are listed in Table 2. From 1978 to 2018, the LULC patterns changed considerably.
The area under each class and its changes from 1978 to 2018 were presented in Table 2. Figure 4 clearly displays the spatial expansion of the built-up area. In 1978, the area covered by built-up land was very small and mainly located in the centre of the study area. Positive and negative changes were observed over 40 years in the area under the LULC categories. The waterbodies, forest, and agriculture land categories exhibited a decrease in their area, whereas the built-up land and barren land/other land categories exhibited an increase in their area. As presented in Table 2, the largest changes in area were observed for the built-up/other land category, followed by the waterbodies, agriculture land, and forest categories.
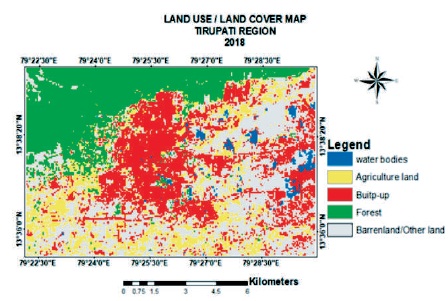
Figure 4. LULC Map of the Study Area in 2018
In this research, maximum likelihood classification and post-classification comparison techniques were integrated for quantifying and understanding the LULC changes in Tirupati over 40 years from 1978 to 2018. The techniques used in this study are simple and inexpensive. The extent of land use changes in Tirupati were determined using multi-temporal satellite imagery. Significant changes were observed in the study area between 1978 and 2018. During this 40-year period, the area under built-up land and other land increased considerably, whereas the area under agriculture land and water bodies drastically decreased. The causes of the LULC changes in the study area include the decrease in agricultural activities and increase in built-up activities. The LULC changes may not have a considerable environmental impact on the study area. However, the LULC changes should be closely monitored in the future for the sustainability of the environment. In this study, misclassification was observed in the desired classes due to thin clouds and atmospheric effects. In future work, misclassification can be avoided by reducing the atmospheric effects and the pixel size.