
Figure 1. Fuzzy Membership Function
The micro-calcification which is an early sign of breast cancer is hard to find due to its small size, poor contrast, and blurry Image boundary. Pectoral muscles on mammograms are soft tissues of the body other than breast muscles, which looks Like a cancer. The fuzzy algorithms used in this scenario are fuzzy opertors that analyze the image at pixel level to detect Abnormalities and identify the location of abnormalities on the breast and pectoral muscles. This paper describes a Technique which consist of five steps to find location of cancers in breast by removing pectoral muscles 1) to enhance the Quality of poor breast images 2) preconisation of the breast shape 3) extract the cancer part from the breast images 4) Removing the pectoral muscles depends on the orientation of the breasts 5) location of the cancer part on breast Images. The result shows the possibility and adequacy of the proposed approach.
Cancer in breast is the most widely recognized reason for The death in women, as indicated by the survey Conducted by world health organization in 2012; most of The younger women are influenced by breast cancers. Micro-calcifications on the mammograms appear as Clusters of small white spots.
Although digital mammography represents major Technological advances in breast imaging, many Radiologists and technologists are unfamiliar with the field Of digital mammographic artifacts. To achieve optional Image quality, recognition of these artifacts is critical. Digital mammography systems contrast in the mode they Procure, develop, and exhibit image and artifacts as an Effect of problems involving any one of these Components. Generally, digital mammography system is Classified as indirect and direct systems. Indirect systems Use either a psp plate or a caesium iodide scintillator in Which the x-rays emit light, and is transformed into ds (digital signals) with resolution 50-100 mm. Direct systems Use selenium plate, the charge of which being changed is directly transformed to the electrical signals with the Image resolution 70-85 mm. Maximum deaths are Enlisted in india after china and usa (http://cancerfoundationofindia.org/). In india, mumbai Acts as the main urban area of deaths due to breast Cancer (http://www.breastcancerindia.net/). Among all Cancer in women it infers that one-fourth is breast cancer (Raju, Harikiran, & Priya, 2012). Premature detection plays A very important role in the treatment of breast cancer. 50% of the cases will be solved if there is persistent Proficiencies for screening routinely, at screening level if it Is neglected to examine, then it may lead to spread the Cause. Consequently identifying variation without any Symptoms and earliest may help to fix malignancy (Sreeja, 2012). In mammography, numerous works have Been done on masses segmentation, however it is hard to Pull out the poor difference masses (Prasad, 2015). The Most general mass segmentation technique is based on Areas called regions and boundaries called edges. If it Satisfies the thresholding criteriain region-based methods, Areas are grown to segment the mass by adding nearest neighbour (Jyothi & Gayathri, 2014). Lots on abrupt Changes within the tissues of breast are known by edge Based techniques. The region-based technique uses kmeans Clump (Lou, Yang, & Cao, 2015) or wavelet-based Techniques (williams, idowu, balogun, & oluwaranti, 2015) And utmost of edge created ways are used for watershed Transformation and contour created segmentations. Gaikwad (2015) proposed the threshold-based Segmentation method. To find an anomaly, first the Mammography is sectioned into few segments by thresholdbased Segmentation process with morphological operations (salman, 2006). Each region indicates its characteristics on Which mass can be identified, where fuzzy logic is more Suitable for detection of mammography.
Here z is fuzzy set membership function on the space p Has been defined as μA: z → [0, 1], stuck between value 0 And 1 each element of z is recorded, which is called as Membership values or membership degree, and Enumerates the evaluation of the component of Membership of p into fuzzy set z (isa & siong, 2012). In Figure 1, function which has been used towards Graphically characterize the fuzzy set values. The x axis Denotes the dissertation of universe, whereas the y axis Denotes the mark of membership in [0, 1]. In this crisp set, A value is associated to either set member or may not be. This relation characterizes incidence or nonexistence of Association, or interconnection flanked by values of ≥ 2 Values of sets. This model can be comprehensive to Several degrees or fortes of association or interaction Between values in a set. Each element is given a degree Of membership in a set (barnathan, 2012). The fuzzy Function states the degree of truth as an addition of valuation. A fuzzy member do not denote to only one Value, but rather to a connected set of imaginable Values, where each possible value has its own weight Between 0 and 1, in the sense that it is a simplification of a Regular, real number. This credibility is called as Membership function.
Figure 1. Fuzzy Membership Function
Mammography is an X-ray system for examining the Breast. In the radiographic examinations, a beam from X- ray Is impinged through the tissue to note the differences In measures of radiation that is emitted. Since various Tissues take updistinct measures of radiation, it is likely to Differentiate details and features about the tissues that Are examined (madhu, nagaraju, & padmaja, 2010). In Screening mammography on each breast, suitable Pressure is applied against flat surface. At that point, an X- ray Falls on the side of the mammogram emanates Radiation. On the reverse facet of the X- ray, the radiation Are recorded on film. During this method, every breast is Scanned from an idea opinion, termed craniocaudal, And a cross section, known as mediolateral (manoj & Thamarai, 2012). Female breast mostly contains fatty and Fibrous interconnectivity tissues. It is divided into around Twenty sections called lobes, which are further sectioned As lobules. These structures contain milk-producing Glands, which conceal milk into ducts and is carried Through the collecting chamber in the breast located just Beneath the nipple (makandar & karibasappa, 2010). Figure 2 is an image of mediolateral mammogram with its Basic components labelled. Denser tissues, muscles, Fibro glandular tissue, malignant and benign masses, and Vascular tissue appear blazing intensities in the mammogram, whereas regions locating fat or skin Appear darker. Other important objects observed in Mammograms are micro-calcifications. These signify the Calcium deposits located on soft tissue of breast and are Highly considered as analytical of breast cancer, which Appear as tiny, clear objects that separates from the Neighboring tissue. Architectural distortion is a category of Anomalies observed in mammogram images. These are Occurrences in which the normal structure of the breast is Noticeably misrepresented. This includes speculated Regions and/or undertaking from a focal point. Even Though no mass is visible, these distortions are present.
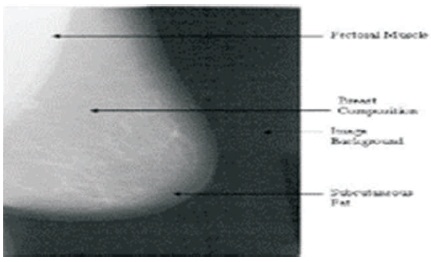
Figure 2. Components of Breast
These are space occupying lesion, seen on two different Impacts. In figure 3, they are given by a detailed account By their shape (round, oval, lobulated, irregular), their Contour (circumscribed, micro lobulated, obscured, Indistinct, speculated), and density (more, medium, less Fat). Cancer in breast is not ever finished of fat radiotransparent Though they may trap grease (nayak, ghosh, & ari, 2013). Lesions containing fat is: oil cysts, Lymphomas, the galactocele, and mixed lesions (hamartoma). Mass containing fat is always benign.
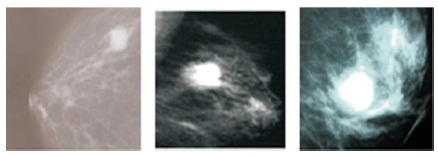
Figure 3. Masses Types
They are calcified into three types: typically benign (cutaneous, vascular, staghorn, sticks, etc.), suspicious (called heterogeneous or dusty amorphous), and Malignancy with high probability (fine or fine to Polymorphic linear distribution, triangular, or branched). Examples of micro-calcifications are shown in figure 4.
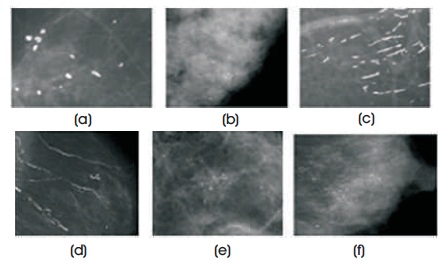
Figure 4. Microcacifications Types (a) Annular (b) Regular Full Round (c) Linear Stick (d) Rail (vascular) (e) Irregular, Blocky (f) Power
With no visible mass these are breast tissue and are out-of The normal structure. They can be dense centre (central Opacity) or clear centre (figure 5).
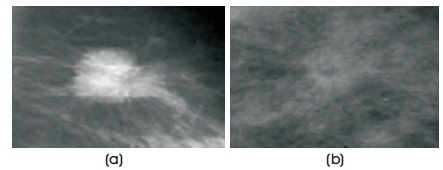
Figure 5. Architectural Distortion With (a) Dense Center (b) Clear Centre
Other unique types of breast anomalies are there, such as asymmetric tubular structure, the intra-mammary lymph Node (ground round or oval with clear center), the general Asymmetry in the tissue of the breast, and the focal Asymmetric density (reddy, reddy, madhu, & nagaraju, 2010). The various abnormalites often consist of visible Signs, such as skin retraction, the nipple retraction, skin Thicken, and skin lesion.
To find location of cancer on breast, this technique consist Of five steps.
Step1: Mammographic image is corrupted by the noise During the transmission and the gaining which debases Image because to miss-focus of lens, environmental Turbulence, relative movement amongst camera, and Object causes the movement obscure. In the grey scale Images, the salt & pepper noise is originated by memory Fault regions or there can be a particular point of errors in The process of digitization, in which there are two Hypothesis of two diffusion values such as equal to the Greatest and least values of the digitized image and the Chance of each value is <0.2. If the values of each Probability are surpassed then noise in the image also surpasses. This noise is known as impulse noise. To reduce Salt & pepper noise in image, median filter is frequently Used. Yet, often it does a better for preserving useful Aspect in the image. The following two scrutinizes result in Median statistics formula: 1) once the no. Of values within The information set area unit odd and area unit ordered, the center worth is that the median is that ((n + 1)/2)th Observation. Through first arrangement all the values of Pixels, the above said middle value is calculated from the Surrounding values into sorted direction and then Replacing the being considered pixel value by the Median significance. In figure 6, the results of the Median filter are shown.
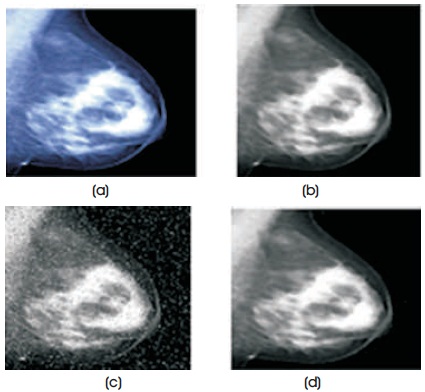
figure 6. Images (a) Color (b) Gray (c) Noisy (d) Enhanced
Step 2: Most of the cases, it is very difficult to separate Breast shape from the back ground because of their Overlapping gray values and low contrast. Digital Mammography systems may produce noisy images Based on their poor performance. Salt & pepper noise is The most common noise. Measures of fuzziness is a Reasonable approach to calculate approximately the Average uncertainty in fuzzy sets. The crisp set fuzziness Need to be zero, as nearby is no vagueness about Whether a component belongs to the set or not belongs To set. If the set is highly anomaly, then its woolliness should Be high. As the ambiguity decreases, degree of Membership is near zero or one specifies lower fuzziness. The fuzzy s-function in figure 7 is suitable for modelling the membership degrees to separate the shape of breast Shown in figure 8. This type of function is suitable to Represent the set of bright pixels, which can be controlled Through parameters a and b. The parameter (a+b)/2 is Called the cross over point, where s(x)=0.5. The higher the Gray scale near of a pixel closer to white, the high Membership cost and vice versa.

figure 7. Fuzzy S-Function
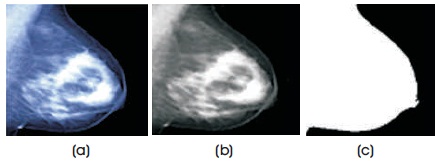
figure 8. Images (a) Color (b) Gray (c) Structure Shape
Step 3: Mammographic image may contain many Regions like background, pectoral muscles, cancer parts With uneven illuminations, and the shape of cancer like Benign or malignant. In figure 10, the output is produced By applying trapezoidal function. This function is suitable To separate cancer part by forming straight lines and it Divides mammogram image into five regions so that very Brighter region of cancer is easily detected by producing Optimal threshold for gray values. The fuzzy trapezoidal Functions are just a truncated triangle curve with a flat top. Trapezoidal function in figure 9 is defined by a lesser limit A, an higher limit d, a lower support limit b, and an higher Support limit c, where a< b< c< d. The precise appearance of the function is determined by the choice of the parameters a, b, c, d, which inturn forms a Trapezoidal.
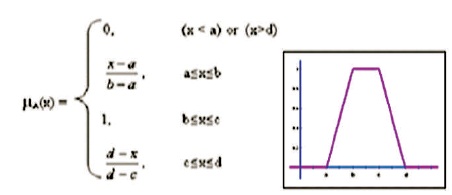
figure 9. Fuzzy trapezoidal Z-Function
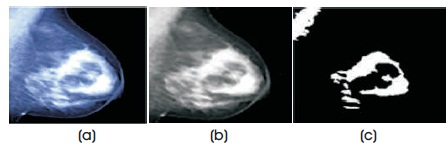
figure 10. Images (a) Color (b) Enhanced (c) Lesions with Pectoral Muscle
Step 4: Pectoral muscles on mammograms are soft tissue Of the body other than breast muscles, which looks like a Cancer. The breast position in each mammogram has to Be identified in order to analyze the breast profile position left or right using an automated procedure. The binary Image is cropped in all borders that is left, right, top, and Bottom, where breast profile touches all the four borders Of the image. Then the amount of the first and last 5 Columns of the binary values in the cropped binary Images is calculated. By using a simple if-else logic, the Breast profiles are classified, such that, if first > last then the Breast is right positioned else it is left-positioned. After the Breast position is analyzed and the segmentation is made On the pectoral muscle expending the srg (seeded region Growing) method. The gray-values of breast of the pectoral Muscles, to implement automated srg technique, a seed Desires to be placed. If profile of breast is right-positioned, a seed is placed intimate the first 5th column and 5th row of the Mammogram image, while if the mammogram profile is left-positioned, a kernel is placed in the last 5th row and 5th Column and applied srg technique and easily extracts the Cancer in figure 11.
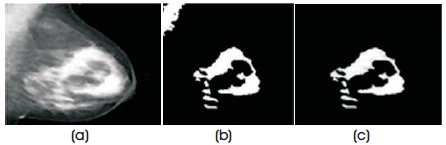
figure 11. Images (a) Enhanced (b) lesions with Pectoral Muscle (c) Lesion
Step 5: For finding location of cancer on breast image, First we consider the shape extracted mammogram from Step 2 and consider the only cancer part of the mammogram, which is after eradication of pectoral Muscles in step 4. Subtract step 2 output from step 4 Output. On that output image which is in figure 12, apply Morphological opening operation with disk shaped Structuring element. Generally, this operator generates The boundaries of the image, cracks tapered peninsulas, And annihilates tinny protrusions. By undertaking dilation On eroded image, opening operation is obtained. Usually, Objects that are adjacent are spaced, objects that are Adjoined are removed, and the holes within the objects Are magnified by opening to smoothen the Mammogram after locating cancer part on the breast.
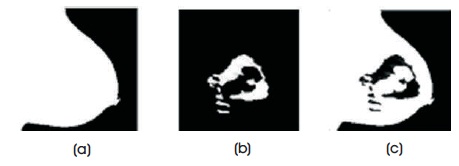
Figure 12. Images (a) Structure Shape (b) Lesions (c) Located Lesion on Breast
After successful completion of detection, matching is Applied by using certain technique to estimate accuracy. Figure 13 and table 1 shows the five best optimal Parameters. In these parameters, there are four variables, Such as a, b, c, d, where (1) “a” element counts the number “11”, (2) “b” element counts the number “10”, (3) “c” element counts the number “01”, and (4) “d” elements Counts the number “00”.
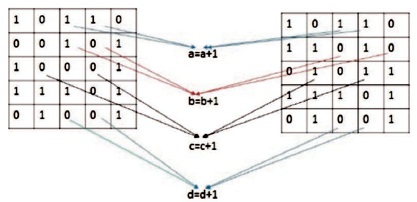
Figure 13. Relationship Diagram of Two Images
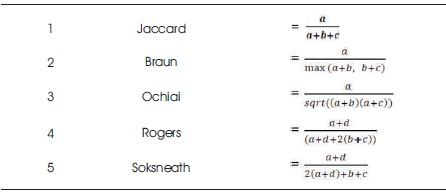
Table 1. Formulae of Parameters
The proposed fuzzy system is functional to a set of high-resolution Mammograms in order to bear out its Performance. Five statistical features are extracting from The roi jaccard (j1), braun (br), ochiai (oc), rogers (rg), And soksneath (sok). These features are used in the Brightness measurement, the intensity variation and Contrast of the rois. In mammograms, the lesion tend to Be intense and more contrast than normal tissue; in Detecting apprehensive lesions and structure of breast, The statistical features are useful. The graph 1, graph 2, Tables 2 and 3 values and figures 15 and 16 show that the Proposed methodology produced better results on salt & Pepper noise and speckle noise up to 50% of noise level. In figure 14, the first, fourth, and eight rows of fourth Column images contain pectoral muscles and fifth Column images are after pectoral muscle removal. The method clearly removed left and right pectoral muscle. It Shows better performance to detect and locate the Cancer on the breast images.
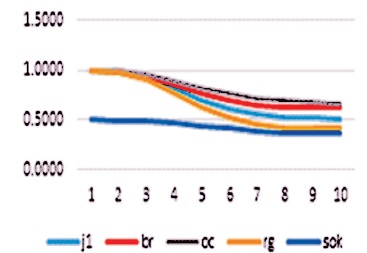
Graph 1. With Salt and Pepper Noise
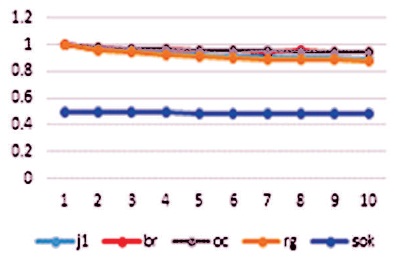
Graph 2. With Speckle Noise

Table 2. With Salt and Pepper Noise
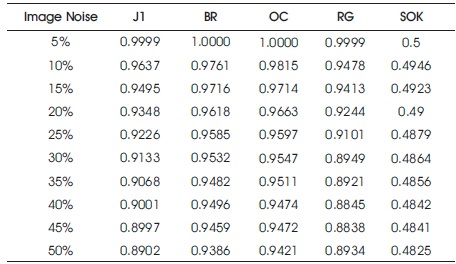
Table 3. With Speckle Noise
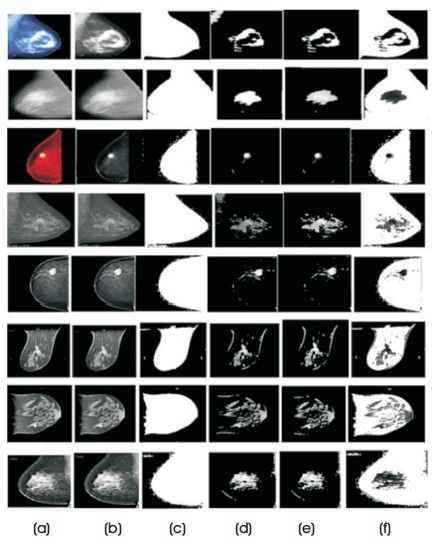
Figure 14. Images (a) Color (b) Enhanced (c) Strucure Shape (d) With Pectoral Muscle (e) Lesions (f) Located Lesion on Breast
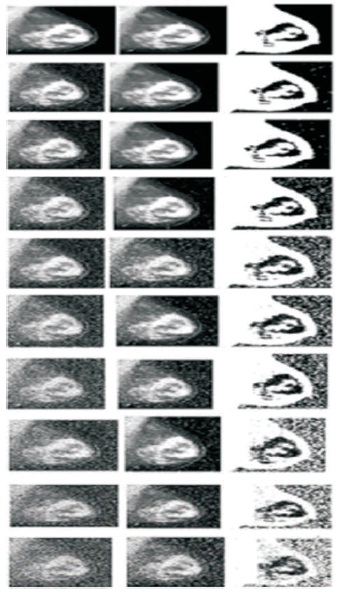
Figure 15. Salt and Pepper Noise
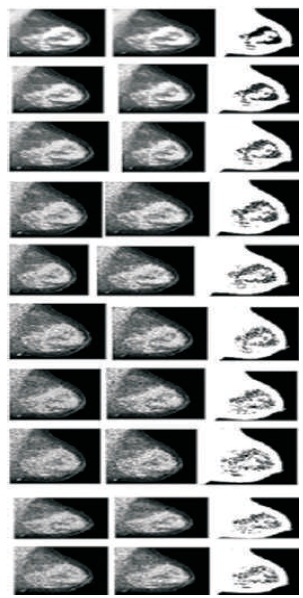
Figure 16. Speckle Noise
Cancer in breast is one of the most common diseases That occur in women to cause death. It can be early Diagnosis through regular screening and timely treatment To prevent cancer. In this scenario, the authors have Presented an innovative fuzzy method to recognize the Existence of breast cancer masses in mammograms and To specify the location of cancer on breast image. This Paper designates a technique which consists of five steps To find location of cancer on breast which has already Been described. Using this, they have effectively Identified the breast cancer masses and location on Mammograms. The results specify that this system can Aid the doctor to detect cancer in breast in the early on Stage of diagnosis process by specifying location of Cancer on breasts.