Figure 1. Individual Grape Leaf Identification Technique
The essential part of any ecosystem is plant. All the organisms get energy from plants directly or indirectly. It is important to identify the disease in plant parts like leaf, stem, and fruit. Leaf diseases are caused by virus, bacteria, etc. Normally, a farmer identifies the leaf disease by observing spots, color, and shape of the leaf, but sometimes they take help from the experts to detect diseased leaf or crops. The manual detection of disease is less accurate and complex. Image processing techniques help farmers for timely detection of the diseases. K-Nearest Neighbor (KNN), K-Means clustering, Support Vector Machine (SVM), Artificial Neural Network (ANN), and various segmentation algorithm and classifiers are used for detection and classification of leaf diseases. In this paper, various diseases that occur in parts of the plant and identification of leaf diseases were discussed.
India is a pre-dominantly agriculture based economy country. Majority of the populations are in agriculture. It is important to produce good quality fruits, vegetables, and cereals because these are exported to other countries too. In order to produce good quality products, the farmers should also have knowledge about various diseases that occur in plants. Plant diseases are caused due to environmental change, presence of fungus or germs, etc. Normally, the farmer identifies the leaf disease by observing spots, color, and shape (Image Processing Toolbox™ 7 User's Guide, 2013). of the leaf. Agriculture requires less time consuming and automated detection technique in order to get high production rate.
Various approaches have been used by the researcher to solve different problems on agriculture. Reports have been published on leaf and crop disease detection using different algorithms and classifiers (Barbedo, 2016). In the next section, this paper presents a survey of various proposed systems in a meaningful way.
The various approaches for detecting the disease in crops using image processing technique are described in this section:
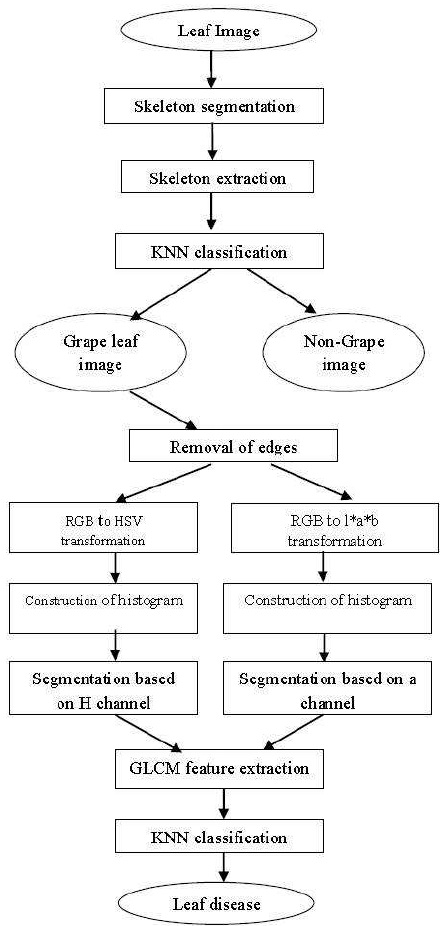
Krithika and Selvarani (2017) describe an approach on individual grape leaf identification technique to classify the leaf disease based on KNN classification. The flow diagram of the proposed leaf identification system is shown in Figure 1.
Figure 1. Individual Grape Leaf Identification Technique
Initially, the skeleton pixels are obtained from the input image using Tangential Direction (TD) based segmentation algorithm. Candidate pixels are taken generated. Luminance difference is calculated by,
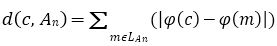
where, c - center
An - angle
Lan - short line
( )- luminance value of pixel
For the selected candidate pixels, removal of noise is performed. By using smooth and color segmentation technique, candidate pixels of skeleton are enhanced and grape leaves are identified. The obtained leaf images are RGB images, such as
Gvalue > Rvalue
Gvalue > Bvalue or Luminance value >120
Smoothness is calculated by,
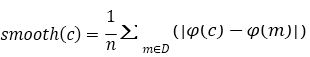
where, n- number of pixels in an image.
If the degree of smooth pixels is greater than the threshold then that is considered as noise and it is removed from the image. In order to identify the diseased leaf, pixels along the edges of the grape leaves are removed (Stergiou & Siganos, n.d.). RGB grape leaf, images are converted into Hue Saturation Value (HSV) and l*a*b color space (Chaudhary, Chaudhari, Cheeran, & Godara, 2012). The enhancement of gray scale image is done by the following formula.
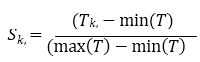
where,
T & S are the original and new pixels, respectively.
K & l are the indices of pixels.
Only H and a color spaces are considered and by using these color spaces intensity histograms are constructed. Global maximum (gm), value (va), and location (lc) are stored in the 100-bin histogram (Barbedo, 2016).
a. If lc>40 then bin_index_reference_value >0.2
b. If lc<40 then bin_index_reference_value =0.5
Therefore, if global maximum is in higher bin, then the leaf is healthy otherwise it is diseased.
Prakash, Saraswathy, Ramalakshmi, Mangaleswari, and Kaviya (2017) describes an approach on leaf disease identification technique to classify the diseased leaf based on SVM classification. Here the total work is divided into four parts. An overview of their proposed method is as shown in Figure 2.
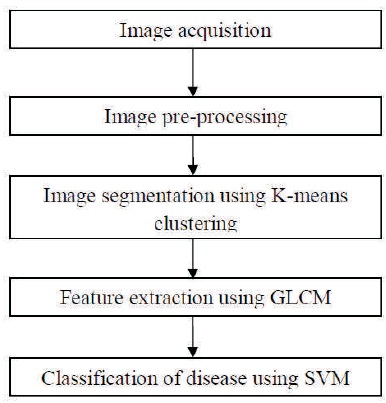
Figure 2. Leaf Disease Identification using SVM Classifier
The first step is image pre-processing. Here quality of the image is enhanced by color space conversion. RGB color of the leaf image is converted into l*a*b color space and this conversion is used for enhancement of visual analysis. Luminosity and chromaticity layers are determined by the color transformation.
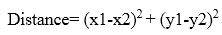
The second step is image segmentation, where initially cluster distance and cluster centroids are recorded. By minimizing the sum of squares of distance between the image intensities and cluster centroids, K-means clustering algorithm performs segmentation.
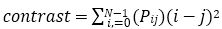
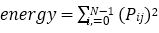
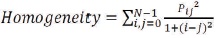
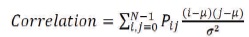
The third step is Feature extraction. Gray Level Co-occurrence Matrix (GLCM) characterizes the image texture by computing the spatial relationship among the pixels in the image. Contrast, energy, homogeneity, and correlation are the four features which are extracted here.
The fourth step is Image classification. In between the dataset, Support Vector Machine (SVM) classifier creates a hyperplane to indicate which class it belongs to. Here the database is divided randomly into training vectors and testing vectors. By comparing the predicted values and actual values, performance is measured.
This method is tested on citrus leaf image. 35 diseased and 25 healthy leaf images are stored in database. The accuracy rate of this system is 90%.
Padol and Yadav (2016) developed an approach on grape leaf disease detection using SVM classifier. Downy Mildew and Powdery Mildew leave (FAO, 2000) are used here.
Firstly, sample images are collected and stored in the database. Thresholding (Bhargavi & Jyothi, 2014) is performed on the image to get all green color spaces and Gaussian filtering is carried out to remove the noise. Secondly, the K-Means clustering segments an image into three groups.
Thirdly, feature extraction is done, where color feature is used for Downy Mildew and texture feature is used for Powdery Mildew leaves (Larese et al., 2014). So color and texture features are extracted from the image to get better accuracy. RGB image is converted into HSV color space. An image is uniformly divided into 3 x 3 blocks. Mean and variance for each of the nine blocks is calculated by using the following formula. Mean is considered as one of the features and variance has the ability to measure the variability (Suman & Dhruvakumar, 2015).
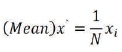
where,
N- number of pixels
xi - pixel intensity
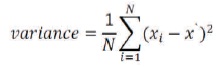
where,
N- number of pixels
xi – pixel intensity
x‘ - mean
In order to judge the image surface, skewness is calculated.
The nine texture features, such as uniformity, contrast, maximum probability, homogeneity, difference variation, diagonal variance, entropy, correlation, and inverse difference are used. It is important to combine color and texture features for classification before using SVM classifier.
Fourthly, Classification is performed. Here SVM divides the class with label. Class with target training vector is labeled as +1 and the other class with target training vector is labeled as -1 (Dhaygude & Kumbhar, 2013). By using labeled training vectors, SVM finds the hyperplane that maximizes the margin of separation among the two classes.
The overall accuracy rate is 88% (22/27). The system’s block diagram is shown in Figure 3.
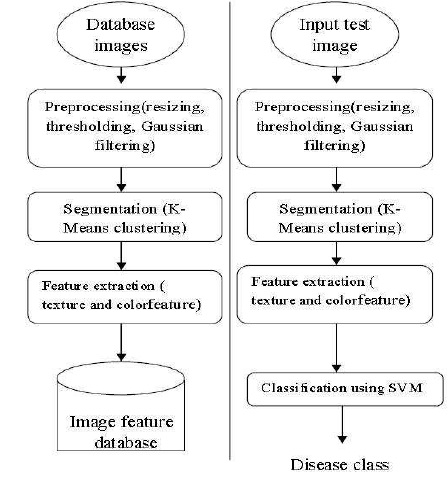
Figure 3. System Block Diagram of Grape Leaf Disease Detection using SVM Classifier
Kulkarni and Patil (2012) have implemented an approach to detect plant leaf disease using ANN classifier. Initially, the input image is collected from the environment and segmented using Gabor filter. The texture information and color feature are then extracted. Later, proper feature values are selected to train ANN. ANN based classifier exactly distinguishes healthy and diseased leaves with 91% accuracy. The block diagram of their system is shown in Figure 4.
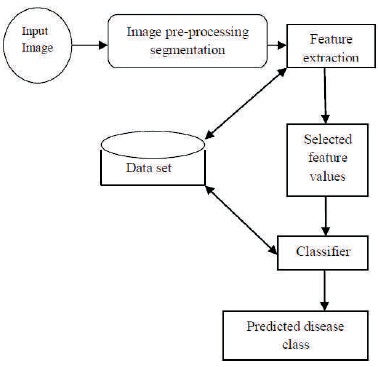
Figure 4. System Block Diagram of Diction of Plant Leaf Disease using ANN Classifier
Naikwadi and Amoda (2013) developed an approach to detect plant leaf disease using Otsu's method. In the first step, the input image is captured from the agricultural field and green colored pixels are identified. Next, Otsu's method (Otsu, 1979) computes threshold values for the green pixels and based on specific threshold values, green pixels are masked. Infected cluster pixels and pixels in the image which has zero RGB values at boundary were completely removed. So the accuracy of this method is between 83% and 94%.
Amoda, Jadhav, and Naikwadi (2014) proposed an approach on image processing technique to identify the diseased leaf using ANN. Initially, all the input images are collected and RGB leaf image is transformed into other color model. Next, the input image is segmented by using K-means clustering technique and the texture features are extracted. Later, statistical analysis is performed for the segmented infected pixels based on texture features. Based on the result of feature extraction, classification is done using pre-trained neural network (Haralick, Shanmugam, & Dinstein, 1973). The accuracy of this technique is 89%. The system design is shown in Figure 5.
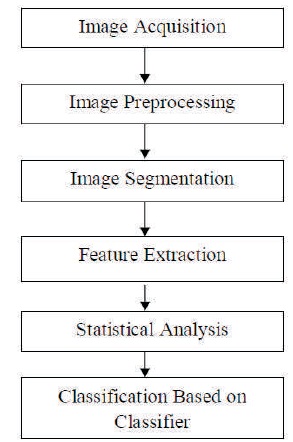
Figure 5. Image Processing Technique using ANN Classifier
This paper presents a comparative analysis of automated recognition and classification of leaf diseases using different image processing techniques. As shown in Figure 6, the accuracy of ANN classifier can be improved from 88.5% to 89% by the combination of K-Means clustering algorithm with ANN. The combination of SVM classifier with K-Means clustering gives 88% accuracy. Comparison of different leaf disease detection methods is shown in Table 1.
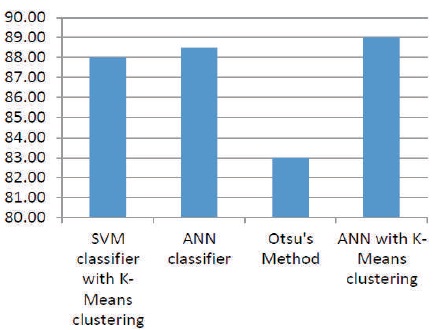
Figure 6. Comparison Graph
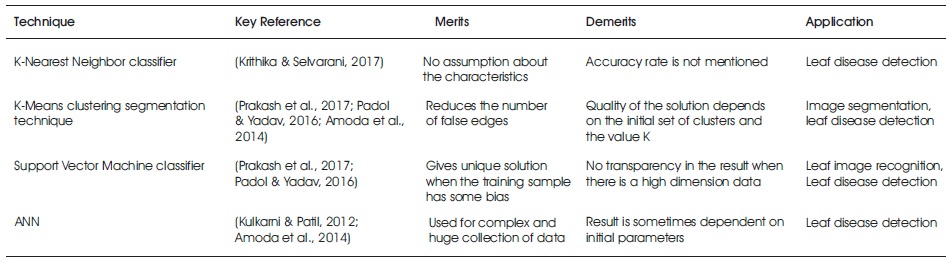
Table 1. Comparison of Different Leaf Disease Detection Methods
This paper presents a comparative study on different methods to detect disease on plant leaf using digital image processing. Leaf diseases are caused due to bacteria, virus, fungi, etc. Based on the features, such as color, shape, and texture it is possible to identify the symptoms in the early stage itself. Various techniques, such as K-Nearest Neighbor, K-Means clustering, Support Vector Machine, ANN, etc., are used to identify the disease. Here the experiment is performed on grape leaf, citrus leaf, etc., and each technique has pros and cons. The application of each technique is also described. This paper evaluates the technique in image processing for detection, classification, and recognition of plant leaf disease.
Not all leaf diseases are identified using shape, color, and size of the leaf. In future, leaf disease ANN Classifier can be identified by comparing the growth rate of the leaf also. By using image processing technique with efficient classifiers, even rice breed can be identified.