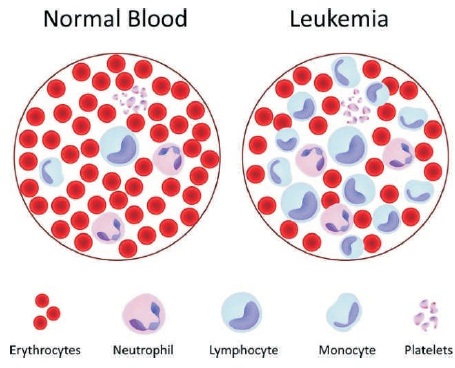
Figure 1. Comparative Imaging of Positive and Negative Cases of Leukemia (Xing & Yang, 2016)
Blood cancer or leukemia detection using microscopic images is a challenging task considering the fact that variations in blood cell patterns are miniscule in nature and human detection may be prone to errors due to inherent deficiencies or anomalies in the dataset or due to human errors. Hence using automated classification has been considered using data pre-processing techniques such as Artificial Neural Networks and Fuzzy Logic. Recently, a new domain of research called neuro-fuzzy systems has garnered a lot of attention due to its efficacy. This paper introduces the challenges faced in the detection and classification of blood leukemia. Along with it, the paper focuses on the various significant contributions in the field by different researchers. This may pave the path for further improvement in accuracy of classification of leukemia.
Leukemia (blood cancer) is one of the most lethal forms of cancer leading to large number of deaths all around the world and the number of cancer patients affected by leukemia is increasing day by day. It has been observed that early detection of cancer is the most effective methods of treatment. Detection at early stages of the disease leads to a chance of successful treatment of the disease.
The continuous development in the field of image processing and soft computing technologies have significantly improved understanding of medical images, and contributed to early diagnosis. Thus the data collection, detection, classification, and diagnosis of blood samples in cancerous (malignant leukemia) and benign (normal or non-leukemia) has become an active area of research. Modern imaging technology has already had lifesaving effects on the ability to detect cancer early and more accurately diagnose several diseases. However, in order to further improve the efficiency and accuracy of diagnoses and treatment, image processing technology has been widely applied to analysis and recognition of cancer, evaluation of the treatment effectiveness, and prediction of Blood leukemia (Xing & Yang, 2016).
Blood leukemia is uncontrolled growth of White Blood Cells (WBCs) within the blood and blood leukemia is an inherently serious and life-threatening disease. Conventional techniques rely on the human inspection of blood samples and in that case the accuracy of diagnosis depends upon the experience and expertise of the doctor (hematologist). Since the images are microscopic images, the classification of the blood samples into normal and malignant (leukemia) is prone to errors. What is more fatal is the chance of incorrect treatment following errors in the classification in the diagnosis phase. Another very serious issue regarding blood cancer (leukemia) is the fact that the chances for the patient to survive become extremely less in case of diagnosis is done in later stages of the disease (Adjouadi et al., 2010; Agaian, Madhukar & Chronopoulos, 2014; Fraison et al., 2016). Figure 1 shows a comparative imaging of positive and negative cases of leukemia.
Over time, a slow growing low grade blood samples can become a fast-growing leukemia. Therefore, the early detection and classification of blood leukemia based on its grade and malignancy help predict prognosis and course of treatment. A body of the person who is suffering from leukemia produces too many blood cells of particular type than another, which results in abnormalities in the cells. These abnormal cells look different than normal blood cells as shown in Figure 1, and does not function properly (usually white blood cells), (Kadono et al., 2016; Kumar, Srivastava, & Srivastava, 2015).
Figure 1. Comparative Imaging of Positive and Negative Cases of Leukemia (Xing & Yang, 2016)
They also interfere with other blood cells, usually red blood cells and platelets. White blood cells of two distinct categories can culminate into leukemia which are lymphoids and myeloids. Leukemia caused due to lymphoid cells is called lymphocytic or lymphoblastic leukemia and if it is found in the myeloid cells, it is called myelogenous or myeloid leukemia (Saritha, Prakash, Sukesh, & Shrinivas, 2016). Leukemia is grouped in two ways: Acute or chronic which is grouped on the basis of how fast the cells grow. Lymphoid or myeloid is another type of leukemia, which is categorized depending on the type of white blood cell that has turned into leukemia. In acute leukemia, the abnormal blood cells are usually immature blasts (young cells) that do not function properly. These cells grow quickly. Acute leukemia needs immediate treatment to avoid sudden exacerbation of the condition. In case of chronic leukemia, the blasts take a substantially longer period of time to grow thereby rendering more time for treating the disease (Manojbhai & Rajamenakshi, 2016; Pradipkumar & Rajamenakshi, 2016).
Designing a completely automatic and efficient medical diagnosis system is a grand challenge. The generic functionality would be selecting parameters having significant role in decision making, computing them, and then classifying the case as leukemia positive or negative.
Consider a signal s1 travelling through a path p1 from dendrites with weight w1 to the neuron. Then the value of signal reaching the neuron will be s1, w1. If there are “n” such signals travelling through n different paths with weights ranging from w1 to wn and the neuron has an internal firing threshold value of θn, then the total n activation function of the neuron is given by:

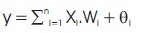
Here Xi represents the signals arriving through various paths, Wi represents the weight corresponding to the various paths, and θ is the bias. The entire mathematical model of the neuron or the neural network can be visualized pictorially or the pictorial model can be mathematically modelled. The design of the neural network can be modelled mathematically and the more complex the neural design, more is the complexity of the tasks that can be accomplished by the neural network. It should be noted that the neural network takes data as input and trains. During the time of training, the values of the weights or the bias keep changing. This property is called the self organizing property of Artificial Neural Networks. The bias is a mathematical function that tries to fit the data that is received by the neural network to a fitting mathematical function. As the inputs are responsible for change of the weights, the inputs are a weighted sum of the experiences or weights. The above concept can be visualized by the following diagram as shown in Figure 2 (Ravikumar, 2016; Rawat, Singh, Bhadauria, & Kumar, 2014; Rawat, Singh, Bhadauria, & Virmani, 2015).
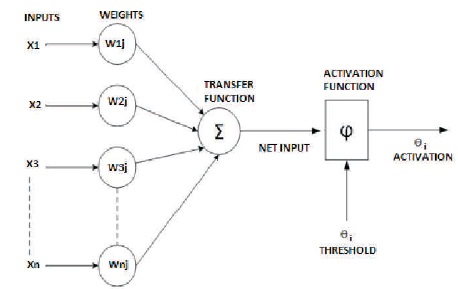
Figure 2. Mathematical Model of a Neural Network
The soul of the above model lies in the fact that the system so developed tries to mimic the working of human brain in terms of the following:
1) It works in a complex parallel computation manner.
2) High speed of performance due to the parallel architecture.
3) It learns and adapts according to the modified link weights.
Works on ANN have been inspired right from its inception by the acknowledgment that the human brain computes in an entirely different way from the conventional digital computer.
ANN has an astonishing ability to find a relationship between completely non-linear data, which can be implemented successfully to detect trends and thus find the pattern followed by the targets, which is impossible for human brains to notice.
ANN exhibits the property of learning from inputs fed to it thus creating experiences. The changing inputs result in changing weights or experiences. The ANN architecture is capable of accomplishing it.
ANN processes input data information to learn and get knowledge for forecasting or classifying patterns, etc. All information processing is done within neuron only. A network of connected artificial neurons can be designed, and a learning algorithm can be applied to train it (Putzu, Caocci, & Ruberto, 2014).
Parallel data streams in the form of signals are fed to the neural architecture, which then creates information based experiences called weights. The weights indicate the information being used by the network to solve certain problem. The weighted sum is worked upon by an activation function (usually nonlinear), and output data are conveyed to other neurons. The weights are continuously changed while training to improve accuracy (Wang, Du, Atangana, Liu, & Lu, 2018; Patil, Sable, & Anandgaonkar, 2014).
Figure 2 shows the working ANN model implemented for the present study. To the neurons of the input layer of this network, input signals are fed. This input layer neurons are linked to all the neurons of hidden layer. All these links have some associated weights, whose value depends upon input signal's state. The aim is to find the optimum values of these weights. The activation function of hidden layer neurons is the main factor in deciding values of weights. Hidden layer neurons are further connected to output layer neurons. The weights of this connection between hidden and output layer are also need to be optimized with prior weights.
Number of hidden layer neurons which will give best result is difficult to find since there is no particular method to calculate that. Hence, the number of hidden layer neurons should be varied till the required satisfactory result is obtained. Number of input layer neurons is equal to the number of input signals and the number of output layer neurons is equal to the number of output variables, which in the present case is one.
Fuzzy logic is often used to analyze the systems which do not have a clear or threshold based yes or no opinion. In several cases, there can be several different categories having overlapping values. Fuzzy systems can be critically helpful in blood leukemia classification since leukemia positive and leukemia negative cases often have overlapping feature values.
Often a neural based system is used to feed data to a fuzzy system, which based on the membership functions produce an output.
Even though there are many different advantages of using fuzzy logic with neural network, there is one main difficulty with it, which is the difficulty in drawing membership rules in fuzzy system. More the membership function taken more will be the rules, and in cases with complex large data, this may lead to large time in processing along with high usage of system memory, which is an undesirable property from a model design. The training is further moved by the checking whether whole data is used in process or not. If yes then training will be finished else the process will repeat till its training finishes. After completion of training the results are saved in the form of .fis model. After this step, the testing data is imported for the use of testing ANFIS model. The results obtained after this testing are saved and is further used for evaluation and then the process is stopped. The results can be improved by changing the number and type of membership functions.
A basic flow diagram of the proposed methodology is shown in Figure 3. Table 1 shows the existing literatures.
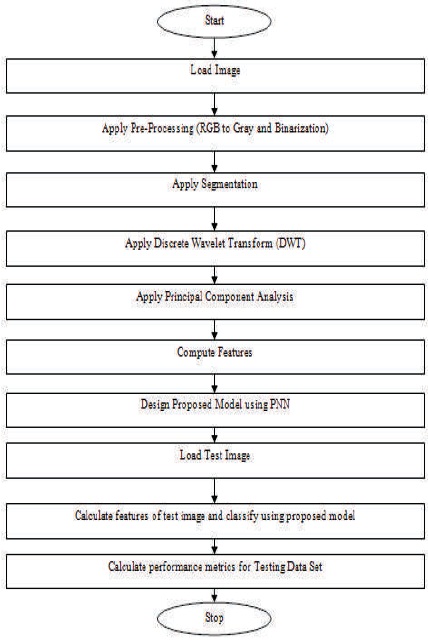
Figure 3. Flow Diagram of Proposed Methodology
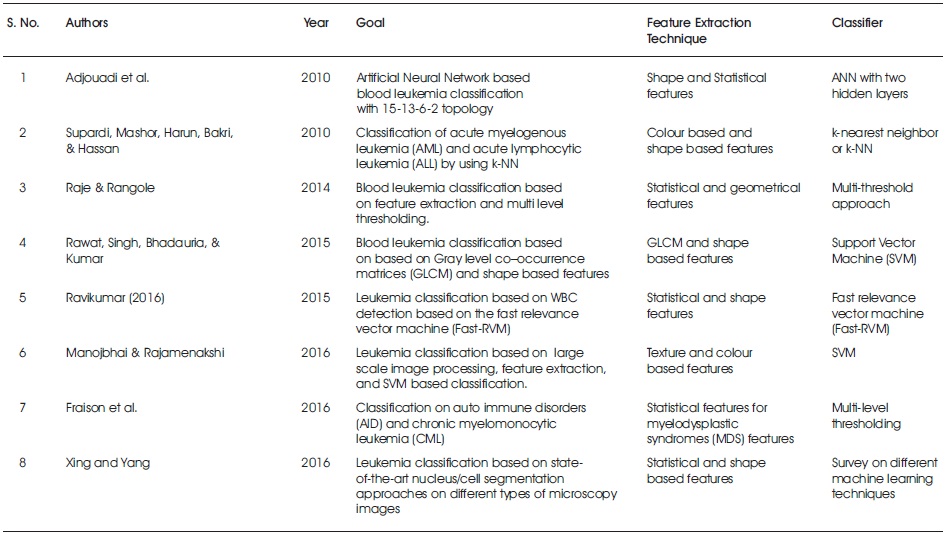
Table 1. A Review on Blood Leukemia Classification
From the previous discussions, it can be concluded that highly accurate Leukaemia detection can be extremely difficult to achieve. Hence a new paradigm of Artificial Neural Networks can be used in conjugation with various pre-processing methods to eliminate the non-linearities and disturbances in the MRI image data. The performance metrics can be considered to be efficient and sensitive. The performance achieved by previous techniques has also been sighted and their salient features are highlighted. It is expected that this paper will facilitate the work of future researchers.
Future researchers may use the contourlet transform to remove noise and blurring effects without the downside of down sampling the data. Moreover, adaptive neuro fuzzy filters can be used for better denoising. Hybrid neural architectures may also be explored to enhance classification, accuracy, and sensitivity.