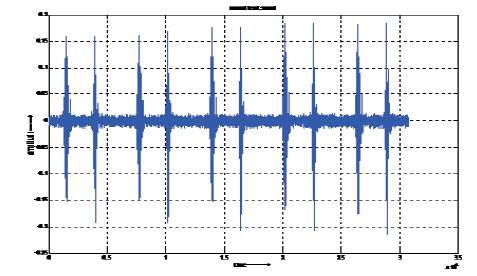
Figure 1. Normal heart sound signal
This paper discusses the usage of digital signal processing techniques on phonocardiography (PCG) waveforms and presents all the cardiac signals and their dates on the PC. This makes it easy for medical professionals to interpret disorders and make a better diagnosis. A segmentation which detects a single cardiac cycle (S1-Systole-S2-Diastole) of Phonocardiogram (PCG) signals using coiflets wavelet family and heart sound is classify into three types Normal (N), Systolic murmur (S) and Diastolic murmur (D). This paper proposed an adaptive sub-level tracking algorithm based on wavelet transform to separate the S1 and S2 from other components such as murmurs and noises Citerai of time interval, energy and phonocardiogram (PCG) collecting position which are used to identify S1 with respect to the beginning of each cardiac cycle. The pre-processing before calculating energy of PCG signal by wavelet, segments the PCG signal, and finds different parameters for segmentation. This paper presents an analysis of coiflets wavelet segmentation of heart sound segmentation techniques and suggested performance measures.
The technique of phonocardiography has evolved continuously to grab an important role in the proper and accurate diagnosis of the defects of the heart. This technique, though seemingly quite reliable in segmentation, is quite difficult to master, as with the stethoscope, it requires highly educated professionals to read the phonocardiograph [1-6]. There arises the necessity of developing a device which would make the process auscultation and diagnosis of heart defects much simpler, and more users friendly, which is the main objective [21]. The heart provides two major audible sounds (S1 and S2) for each cardiac cycle. Two other sounds (S3 and S4), with lower amplitudes than S1 or S2, appear occasionally in the cardiac cycle due to the effect of diseases or age 30 [3]. Reflecting the state of mechanical movement of the heart and the cardiovascular system, the heart sound contains the physiological and pathological Information resulting from the workings of the various parts of the heart and the interactions between them. The noise and distortion that occur in heart sounds is reliable information for early diagnosis of coronary heart disease. Heart sounds-based methods of diagnosis are designed to explore and investigate the relationships between heart sounds and heart disease using modern digital signal processing technologies. Non-invasive diagnosis of heart sounds is fast, convenient, and economical [21]. One important obstacle in developing the all-automatic tool is endpointing of cardiac cycles as well as localization of first heart sounds (S1) and second heart sounds (S2 ), termed by heart sound segmentation. Inaccurate segmentation can put a negative impact on the Screening results relying on the fact that most of the algorithms are applied on a particular segment of a cardiac Cycle [14-16]. A normal cardiac cycle contains two major sounds: first heart sound S1 and the second heart sound S2. S1 occurs at the onset of ventricular contraction and corresponds in timing to the QRS complex. S2 follows the systolic pause and is caused by the closure of the semilunar valves [7].
The importance of S2 regarding diagnosis purposes has been recognized for a long time, and its significance is considered of most importance, by cardiologists, to auscultation of the heart [9]. The PCG may include the heart sounds and the heart murmurs (systolic and diastolic) [2]. Heart sound consists of four components namely S1, S2, S3, and S4. The SI (lup) and S2 (dub) heart sounds are regarded as the normal heart sounds in a cardiac cycle. The S1and S2 heart sounds are caused by the closure of mitral and tricuspid valves, and the closure of aortic and pulmonary valves, respectively. The S3 and S4 heart sounds are caused by the rapid ventricular filling in early diastole and the ventricular filling due to atrial contraction, respectively [7].
Segmentation algorithms based on time-frequency methods are typically used for Information such as the bandwidth of the primary components, S1 and S2, in the development of the algorithms. Heart sound signals are highly non stationary and the frequency struck of heart cycles can vary within a single heart sound. Moreover, murmurs often consist of the same frequency contents as those of the S1 and S2 [16- 17]. In many cases, murmur overlaps the primary components making segmentation of the components a difficult task. For these reasons, the algorithms often produce poor results for complicated pathologies. However, it is the challenging heart sound signals that really need to be analyzed. In this section, a segmentation algorithm is developed based on statistical analysis, providing a robust algorithm which does not rely on the bandwidth of S1 and S2 [13]. The segmentation algorithm presented here is based on techniques combining Wavelet analysis, Principle Component Analysis (PCA), and Envelograms (envelope of energy calculation). The Wavelet transform decomposes the heart sound into eight feat signals.
Each one corresponds to passing the original PCG signal through a band pass filter. Principal component analysis is performed on the set of filtered signals to obtain the best representation of key events in the heart sound. The segmentation of the S1 and S2 are based on the envelogram calculated using the representative signals.
Heart sounds are basically short-lived bursts of vibration energy having transient characteristics which are primarily associated with valvular and ventricular vibrations. The site of origin and their original intensity determine the radiation of the heart sounds to the surface of the chest. There are four basic sounds during the sequence of one complete cardiac cycle [Abhishek Misal, G.R.Sinha , R. M. Potdar And M. K. Kowar (2012)]. The waveform of normal heart as shown in Figure 1.
Figure 1. Normal heart sound signal
Here load the normal heart sound signal and plot the waveform. Now load the heart sound and plot the graph. Heart sounds is in the frequency range 10 KHz and 250 KHz. Here apply wavelet transform for heart sound segmentation. The loaded sound is decomposed using wavelet in five levels then the maximum thresholds value is calculated and the approximate coefficient and details of coefficient of heart sound are found and then the parameters SNR (signal-to-noise ratio), PSNR (peak signal-to-noise ratio), NRMSE (Normalized Root Mean Square Error) values are calculated. Figure 2 shows the Block diagram of the proposed methodology.
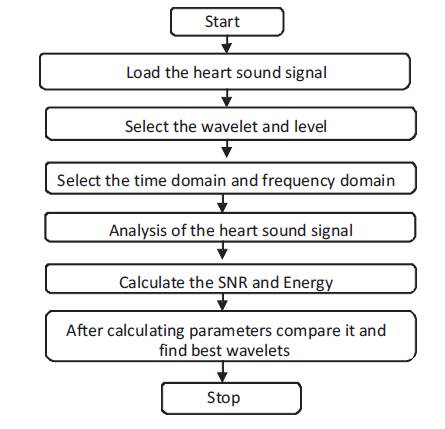
Figure 2. Block diagram of proposed methodology
The recorded heart sounds are stored in system for further processing. Through USB connectivity, the instrument can directly store the heart sound into PC in waveform audio file format [8]. Heart sounds in the format of MP3. MP3 audio format should be converted into recognizable format which can be read by MATLAB before analysis. The data is then de-noised by wavelet de-noising method to eliminate the interference to the heart sounds, holding of stethoscope in some undesirable way or hardware itself of the recording system [7]. Recorded PCG signal is stored in work space. The recorded available data bases are converted into standard from manually.
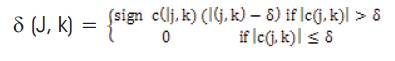
The discrete wavelet assumes evaluation of wavelet coefficients for discrete parameters of dilation a = 2m and translation b = k 2m, using only the initial (mother) wavelet function W (t) localized at a particular position. Wavelet signal decomposition and reconstruction can be used very efficiently for noise cancelling in many applications. In this case, we use certain possibly modified decomposition levels; it becomes possible to extract signal components only. Using the threshold method introduced in, it is further possible to reject the noise and to enlarge the signal to the noise ratio. Wavelet coefficients are modified using a chosen thresholding level S to determine new coefficients [10].
The CWT is calculated by continuously shifting a continuously scalable function over a signal and calculating the correlation between them. It is clear that these scaled functions will be nowhere near an orthonormal basis and the obtained wavelet coefficients will therefore be highly redundant [2]. To remove this redundancy, Discrete Wavelet Transform (DWT) is used. In DWT, the scale and translation parameters are chosen such that the resulting wavelet set forms an orthogonal set, i.e. the inner product of the individual wavelets s,τ ψ are equal to zero. Discrete wavelets are not continuously scalable and translatable, but can only be scaled and translated indiscrete steps. This is achieved by modifying the wavelet representation as [9].
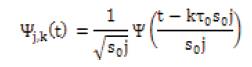
Here j and k are integers and s0 >1 is a fixed dilation step and τ0 depends on the dilation step. The effect of discrediting the wavelet is that the time-scale space is now sampled at discrete intervals. We generally choose s0 = 2 so that the sampling of the frequency axis corresponds to dyadic sampling. For the translation factor we generally choose τ0 =1. In that case, the Equation becomes

One of the efficient ways to construct the DWT is to iterate a two-channel perfect reconstruction filter bank over the low pass scaling function branch. This approach is also called the Mallet algorithm [10]. Discrete Wavelet Transform theory requires two sets of related functions called scaling function and wavelet function and are given by:
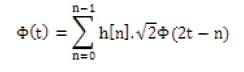
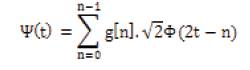
Where, function φ (t) is called scaling function and ψ (t) is called wavelet function, h[n] is an impulse response of a low pass filter and g[n] is an impulse response of a high pass filter [14]. Figure 3 shows the Block diagram of the filter-bank tree.The ho and h, are the impulsive response of the FIR filters and q,i and bj,i the approximation and detail coefficients, respectively
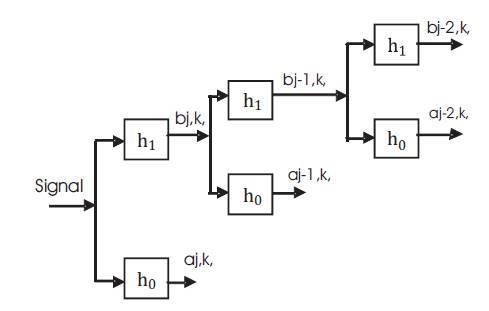
Figure 3. Block diagram of the filter-bank tree.
The spectrum of HSs was divided into sub-bands to extract the discriminating information from normal and abnormal heart sound. Wavelet coefficients were determined by using Daubechies-2 wavelet for the cycles of segmented PCG signals (340 cycles). These coefficients were obtained for a single cycle of PCG signal and wavelet detail coefficients at second decomposition level were seen to have the distinguishing features as reported in [9] for three cases of phonocardiogram signal analysis. The signal was formed by the wavelet detail coefficients at the second decomposition level.
In heart sound signal segmentation on, different wavelet bases produce different effects [12]. Similarly, for the same wavelet, the effects vary depending on the decomposition levels. In this paper, experiments on commonly-used orthogonal, Wavelets in heart sound are processed using wavelet family and the performance of different Daubechies wavelets are compared.
The WT has been used in many knowledge fields, ranging from Communications to Biology [4]. Due to its good performance in the analysis of signals that present non stationary characteristics, they have become a powerful alternative when compared to the traditional Fourier Transform (FT).The classical FT decomposes a signal, in time domain, using a base of orthogonal sinusoidal functions. The wavelet, on the other hand, presents a decomposition base whose constituents are obtained through expansions, contractions and shifts of a same basic function, called mother wavelet that can be selected according to the analyzed signal [3]. For the dyadic case, the mother wavelet must satisfy (I), that correlates it with the so-called scaling function, that must satisfy (2)
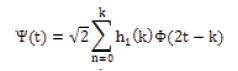
Where j, k ∈ z, ho and hl are coefficients associated with the impulsive response of a low-pass and high-pass FIR (Finite Impulse Response) filters, respectively. Thus, the wavelet can also be performed by a filter-bank tree approach, as illustrated.
By the application of the signal throughout a filter-bank, represented by ho and h, the coefficients c+,k and bj,k, are obtained that represent the approximation and detail coefficients of the original signal at level j [3], respectively. The signals at the output of the high-pass filters will be called detail signals in the context of the present work
For the analysis of heart sound signal, it is very important to extract only heart sound. To extract only heart sound, we need to segment the sound like as S1, S2, S3 and S4. To remove the unwanted heart sound signals, there are different segmentation methods available, but it is difficult to find which method is best for segmentation as we know that in PCG signal it is difficult to predict the actual sound which will appear in the fixed time duration of signal. The wavelet is best because it uses different thresholding methods to detect the desired signal using soft thresholdings method for segmentation. It is the method which decides the thresholding value according to the signal.
The Peak Signal to Noise Ratio is most commonly used as a measure of quality of reconstruction of lossy compression codes signal, which in this case is the original data, and the noise is the error introduced by compression [8]. When comparing compression codes, it is used as an approximation to human perception of reconstruction quality [8]. Therefore in some cases, one reconstruction may appear to be closer to the original than another, even though it has a lower PSNR (a higher PSNR would normally indicate that the reconstruction is of higher quality). One has to be extremely careful with the range of validity of this metric; it is only conclusively valid when it is used to compare results from the same codec and same content [16].
The peak signal to noise ratio is other method of measuring the amount of noise present in a signal. PSNR is defined as the ratio between the maximum possible power of a signal and the power of corrupting noise that affects the fidelity of its representation. Because many signals have a very wide dynamic range, PSNR is usually aorta, According to the result the value of PSNR & ENERGY Compare the both row and column for every types of aortic insufficiency, pulmonary stenosis,patent ductus expressed in terms of the logarithmic decibel scale [2-6].
It is the method which finds the error in the segmentation process. NRMSE (Normalized Root Mean Square Error) is defined as differences between values predicted by a model or an estimator and the values actually observed from the thing being modeled or estimated. NRMSD (Normalized Root Mean Square Error) is a good means of precision. These individual differences are also called residuals, and the root mean square difference serves to aggregate them into a single means of predictive power [17-19].

Mden = mean of difference of squared denoised signal.
Mscal = mean of squared scaled data.
With the help of this parameter, we calculate the performance of all wavelets and levels, which gives the maximum SNR, PSNR and minimum NRMSE. All these parameters are collected in the tables.
The computation of cardiac energy signature is based on the following equation
Through the application of PCG energy equation, S1 and S2 peaks were used for energy calculation of PCG signal [20]. From this equation, the energy is calculated and measures the future.
It was observed that in the proposed work, the segment of different heart sounds and the quality of segmented signal were measured. The different heart sounds were segmented by different wavelet available in Matlab and the quality of segmented signal were found out by different parameters'. The value of these parameters are shown in Table 1. As from table the PCG signal in the 7 level of decomposition and all the levels we have calculated PSNR, NRMSE & ENERGY. In Table (1), we have segmented the normal heart sound, atria septal defect, aortic arteriosus, Mitral prolapsed syndrome, Coarctation of the aorta. According to the result, the value of PSNR & ENERGY compare both the row and column for every types of value and calculates maximum level value and bold the highest value. Also NRMSE shows minimum values. This will be plotted in the graph.
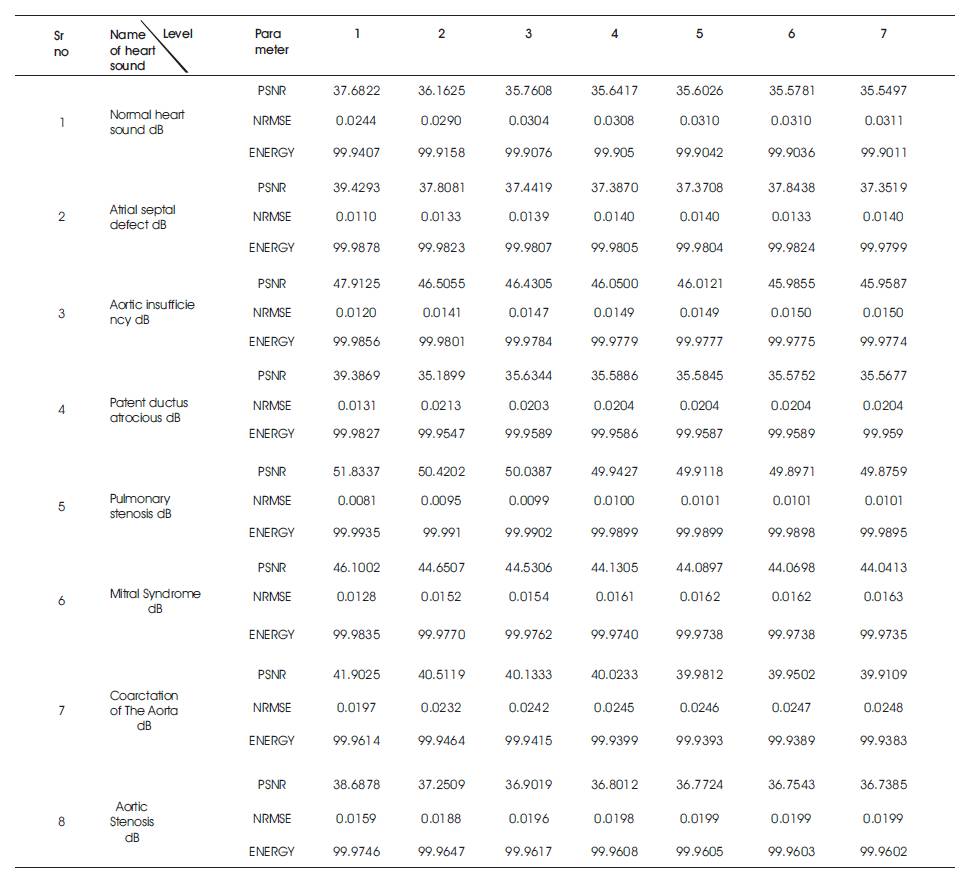
Table 1. Segmented value of PSNR, NRMSE ENERGY of different heart sound by Hear wavelet
From Figure 4 the PSNR is calculated and the maximum value of PSNR for pulmonary stenosis heart sound is found out. Figure 4 shows that Comparison of peak signal to noise ratio of different heart sound segmentation.
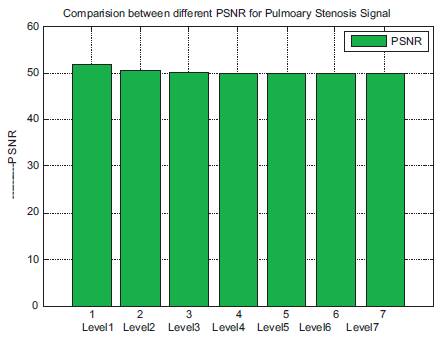
Figure 4. Comparison of peak signal to noise ratio of different heart sound segmentation
From Figure 5, the NRMSE is calculated and the minimum value of NRMSE for pulmonary stenosis heart sound is found out. Figure 5 shows the comparison of normalised root mean square of different heart sound segmentation.
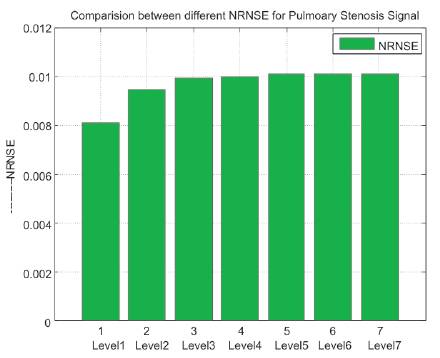
Figure 5. Comparison of normalised root mean square of different heart sound segmentation
From Figure 6, we calculate the ENERGY and find the maximum value of ENERGY for pulmonary stenosis heart sound. Figure 6 shows the comparison of Energy of different heart sound segmentation.
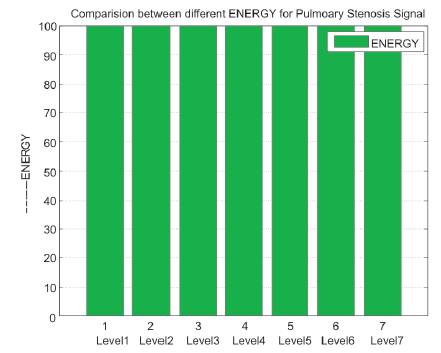
Figure 6. Comparison of ENERGY of different heart sound segmentation
This paper presents heart sound segmentation method. This method identifies time instants that delimit each heart sound component using simplicity and strength measure in the different wavelet domains. The different sound signals use Daubechie, Coiflets and haar wavelet. The Coiflets wavelet is one of the simplest methods for segmentation of heart sound. It has presented the segmentation method to PCG signal analysis. A comparison of the different wavelets has shown that there are solution differences among them. It is found that the Coiflets wavelet filter of (coif2) the order of level 7 gives the maximum peak signal to noise ratio and minimum normalized root mean square error for standard heart sound and for other ten heart sounds, coiflets wavelet gives maximum values of PSNR & ENERGY. In the denoising process of PCG signal, we use this wavelet and we also provided spectrogram for analyses of PCG signal. From this figure, we find that pulmonary stenosis is segmented much more efficiently.
Our sincere thanks to www.medstudent.com and www.physionet.com for providing different heart sounds.