Figure 1. 1D DWT Implementation
In this paper, a technique for enhancing the low resolution multi spectral image using Discrete Wavelet Transform (DWT) is proposed with the help of the corresponding high resolution panchromatic image. Image fusion, also called pansharpening, is a technique used to integrate the geometric detail of a high-resolution panchromatic (PAN) image and the color information of a low-resolution Multi spectral (MS) image to produce a high-resolution MS image. Remote Sensing systems, particularly those deployed on satellites, provide a redundant and consistent view of the Earth. In order to meet the requirements of different remote sensing applications, the systems offer a wide range of spectral, spatial radiometric and temporal resolutions. In general, sensors characterized with high spectral resolution, do not have an optimal spatial resolution, which may be inadequate to specific task identification in spite of its good spectral resolution. In panchromatic image with high spatial resolution, detailed geometric features can be easily recognized, while the multispectral images contain richer spectral information.
The term fusion in general context refers to an approach of extracting relevant information from several domains. Image fusion aims at achieving high quality images by effective integration of complementary multisensory, multi-temporal and multifocal images [1,4]. The final fused image obtained is more informative than any of the input images. The term quality and its measurement depend on the particular application. Image fusion finds a wide variety of applications in the field of remote sensing, astronomy, medical imaging etc. The field of remote sensing is a continuously growing market with applications like vegetation mapping and observation. However, as a result of the demand for higher classification accuracy and the need in enhanced positioning precision, there is always a need to improve the spectral and spatial with higher resolution power or by the effective utilization of the fusion techniques.
Ideally, Image Fusion Techniques should allow combination of images with different spectral and spatial resolution keeping the radiometric information. Huge effort has been put in developing fusion methods that preserve the spectral information and increase detail information in the hybrid product produced by fusion process. A multispectral image contains a higher degree of spectral resolution than a panchromatic image, while often a panchromatic image will have a higher spatial resolution than a multispectral image. [2]
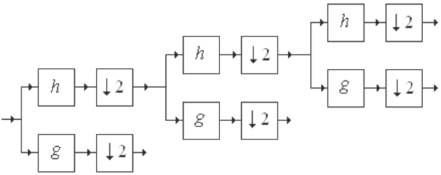
Since Continuous Wavelet Transform (CoWT) is very redundant, a discretization of the scale and translation variables was introduced and this version of the CoWT is named the Discrete Wavelet Transform. The main advantage of the implementation of the DWT is its flexibility. The implementation of 1D DWT is presented in Figure 1.
Figure 1. 1D DWT Implementation
Each of the iterations of the algorithm used for the computation of the 2D DWT implies several operations. First, the lines of the input image (obtained at the end of the previous iteration) are passed through two different filters (a lowpass filter having the impulse response m0 and a highpass filter m1) resulting in two different sub-images [5]. Then the lines of the two sub-images obtained at the output of the two filters are decimated with a factor of 2. Next, the columns of the two images obtained are filtered with m0 and m1. The columns of those four sub images are also decimated with a factor of 2. Four new sub images, representing the result of the current iteration are obtained. These sub-images are called sub-bands. The first sub-image, obtained after two low-pass filterings, is called approximation sub-image (or LL sub-band). The other three are named as detail sub-images: LH, HL and HH. The LL sub image represents the input for the next iteration. An iteration of 2D DWT is shown in Figure 2.

Figure 2. Single level analysis filterbank for 2D DWT
DWT decomposes a signal into multi-resolution representation with both low frequency coarse information and high frequency detailed information [3]. Image Fusion using Wavelet transform is shown in Figure 3 . In one-level DWT an image is decomposed into a set of low-resolution sub-images (DWT coefficients), LL, H1, H2 and H3. The LL sub-image is the approximation image while the H1, H2 and H3 sub-images contain the details of the image. The LL sub-image of the MS image is retained by the fusion algorithm and the H1, H2 and H3 components are replaced by those of the PAN image. Therefore, the fused image contain the extra spatial details from the high resolution PAN image as shown in Figure 4. Also, if the fused image is down sampled, the low-resolution fused image will be approximately equivalent to the original low-resolution MS image. That is, the DWT fusion method may outperform the standard fusion methods in terms of minimizing the spectral distortion.
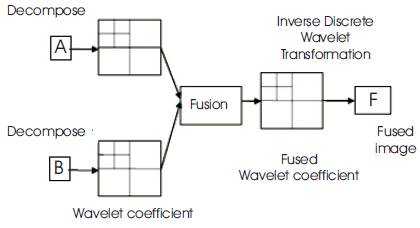
Figure 3. Image fusion using wavelet transform
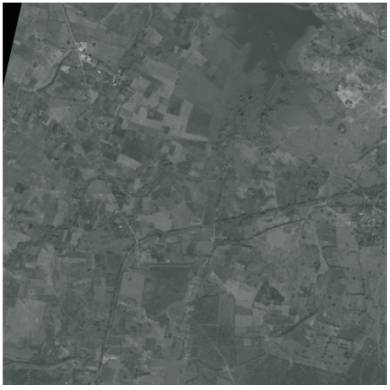
Figure 4. PAN Image
BIAS measures the error and spectral accuracy. [8]
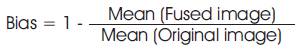
Here MS Image is taken as Original Image.

CC (Correlation Coefficient): It analyzes and compares the spectral quality. It is defined as [7]

Entropy measures the amount of information contained in a image.

pi is the probability of occurrence of a particular gray level. ERGAS (Relative dimensionless global error in synthesis) calculates amount of spectral distortion in the image [6].
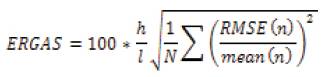
h/l is the ratio of PAN and MS (2.5 m / 24 m)
Mean (n) = mean of the nth band
RMSE (m) = Root Mean Square of nth band
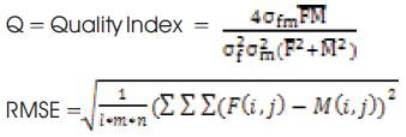
I=no. of rows, m = no. of columns, n = no. of bands
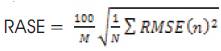
Relative Average Spectral Error (RASE) – It characterizes the average performance of method of image fusion in spectral bands.
The low resolution Multi spectral Satellite image is obtained using LISS – III sensor with the resolution of 24 m. The Multi spectral Satellite image consists of 4 bands, viz., band 2, band 3, band 4 and b and 5 which are shown in Figures 5-11.
As the dimensions of the panchromatic image are in the order of 13000 X 13000, a portion of it, with dimensions 512 X 512 is cropped. The multispectral image corresponding to the cropped PAN image is determined and cropped. The proposed algorithm is carried out on the resultant PAN and multispectral images using db5 and db8 wavelet transforms with different levels of decomposition ranging from 3 to 5 to study the PAN-sharpening process using different wavelet transforms with different levels of decomposition. The pansharpened images are shown in Figures 12-29. It is obvious that, greater level of wavelet decomposition, is more in the quality of the PAN-sharpened image. But, with continuous increase in the level of wavelet decomposition, the spectral content (color) is going to be uniform. The corresponding performance parameters are shown in Table1.
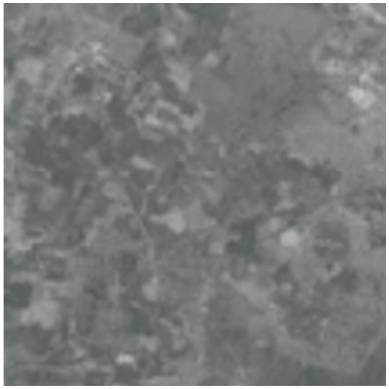
Figure 5. Multispectral Image (Band 2)
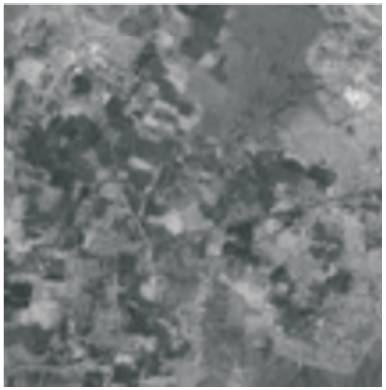
Figure 6. Multispectral Image (Band 3)
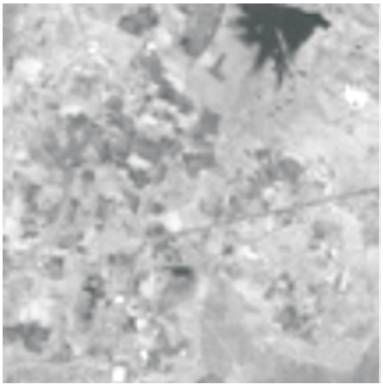
Figure 7. Multispectral Image (Band 4)
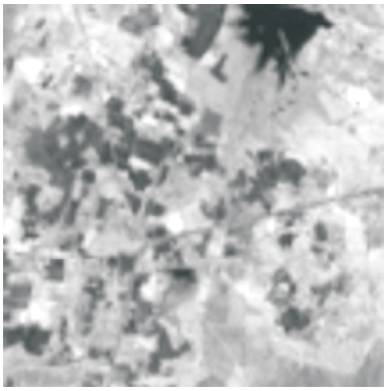
Figure 8. Multispectral Image (Band 5)
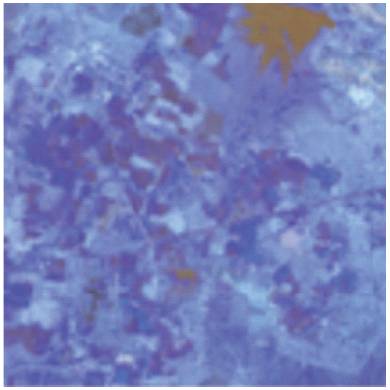
Figure 9. Multispectral Image (Bands – 2, 3 & 4)
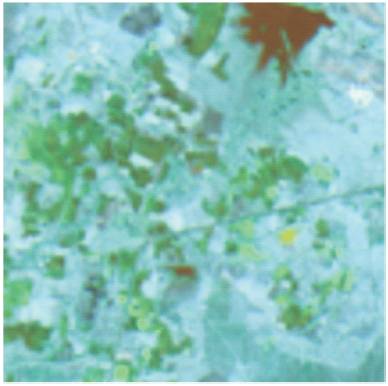
Figure 10. Multispectral Image (Bands 3, 4 & 5)
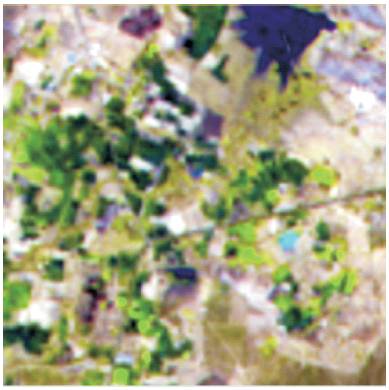
Figure 11. Multispectral Image (Bands 2, 3, 4 & 5) (ERDAS)

Figure 12. Fused (Pan-sharpened) Image (Bands 2, 3 & 4) using db5 with three level decomposition
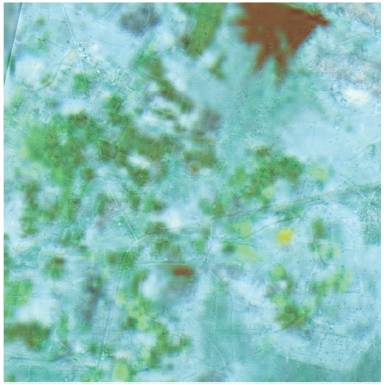
Figure 13. Fused (Pan-sharpened) Image (Bands 3, 4 & 5) using db5 with three level decomposition

Figure 14. Fused (Pan-sharpened) Image (Bands 2, 3, 4 & 5) using db5 with three level decomposition (ERDAS)

Figure 15. Fused (Pan-sharpened) Image (Bands 2, 3 & 4) using db5 with four level decomposition

Figure 16. Fused (Pan-sharpened) Image (Bands 3, 4 & 5) using db5 with four level decomposition
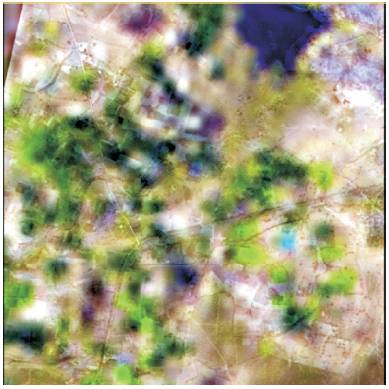
Figure 17. Fused (Pan-sharpened) Image (Bands 2, 3, 4 & 5) using db5 with four level decomposition (ERDAS)
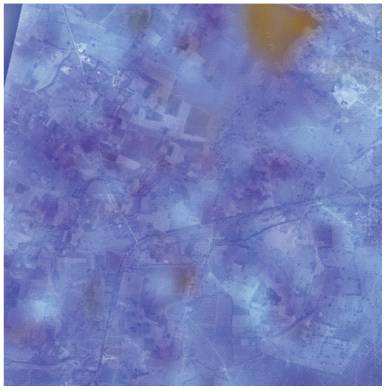
Figure 18. Fused (Pan-sharpened) Image (Bands 2, 3 & 4) using db5 with five level decomposition
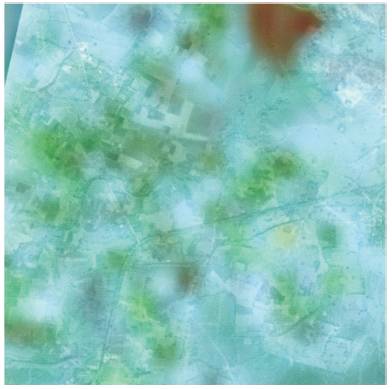
Figure 19. Fused (Pan-sharpened) Image (Bands 3, 4 & 5) using db5 with five level decomposition
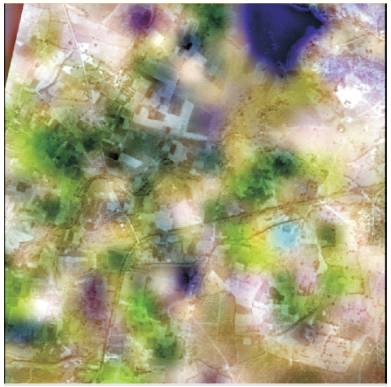
Figure 20. Fused (Pan-sharpened) Image (Bands 2, 3, 4 & 5) using db5 with four level decomposition (ERDAS)
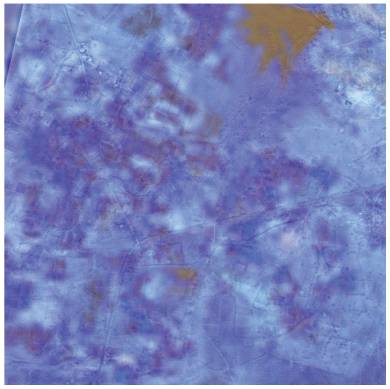
Figure 21. Fused (Pan-sharpened) Image (Bands 2, 3 & 4) using db8 with three level decomposition
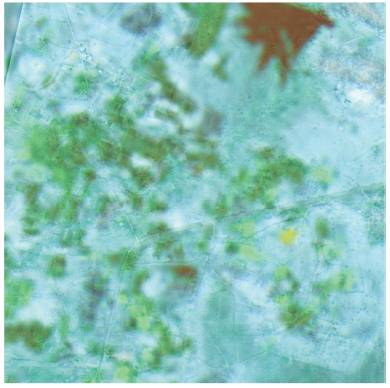
Figure 22. Fused (Pan-sharpened) Image (Bands 3, 4 & 5) using db8 with three level decomposition

Figure 23. Fused (Pan-sharpened) Image (Bands 2, 3, 4 & 5) using db8 with three level decomposition (ERDAS)
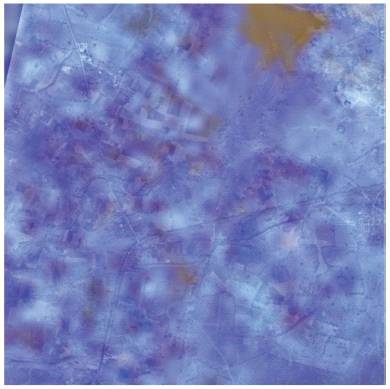
Figure 24. Fused (Pan-sharpened) Image (Bands 2, 3 & 4) using db8 with four level decomposition
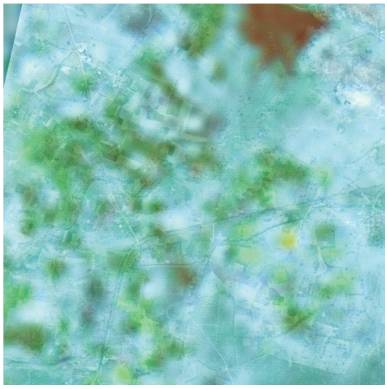
Figure 25. Fused (Pan-sharpened) Image (Bands 3, 4 & 5) using db8 with four level decomposition

Figure 26. Fused (Pan-sharpened) Image (Bands 2, 3, 4 & 5) using db8 with four level decomposition (ERDAS)

Figure 27. Fused (Pan-sharpened) Image (Bands 2, 3 & 4) using db8 with five level decomposition

Figure 28. Fused (Pan-sharpened) Image (Bands 3, 4 & 5) using db8 with five level decomposition
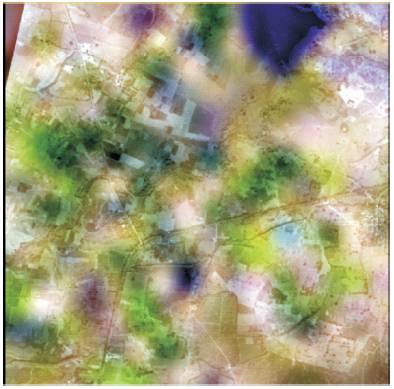
Figure 29. Fused (Pan-sharpened) Image (Bands 2, 3, 4 & 5) using db8 with five level decomposition (ERDAS)
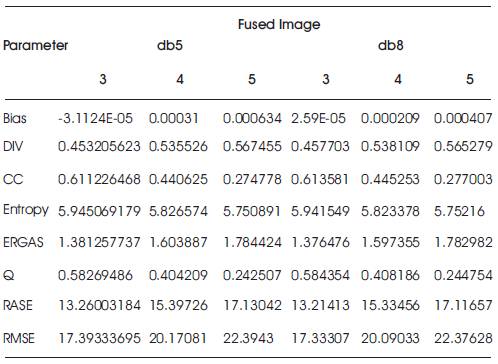
Table 1. Performance Parameters of fused image using db5 & db8 wavelet transform with different levels of decomposition ranging from 3 to 5
The information capabilities of the images can be enhanced if the advantages of both high spatial and spectral resolution can be integrated into one single image. Thus, detailed features of such an integrated image can be easily recognized and will benefit many applications, such as urban and environmental studies.