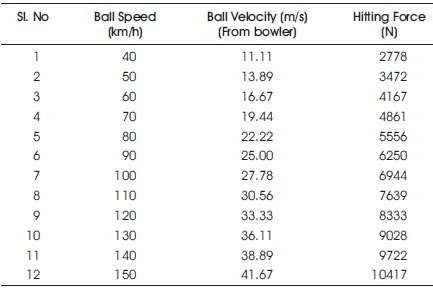
Table 1. Calculation of Hitting Force
Cricket is one of the most popular games among young players in India. The game result is purely based on the runs scored by the teams within the prescribed "overs". Hence the players will put maximum effort to score maximum runs as much as possible. The effort is how much force the players can exert on the bat while hitting the ball so that the ball can travel maximum distance in the ground. The average velocity of the ball thrown by the bowler is in the range of 40 km/h to 150 km/h which depends on the bowling speed of the bowler. Due to such high velocity of the ball hitting on the bat, high impact force is generated on the bat as well as on the arm of the player. This paper studies the strain, stress and energy due to ball impact force with different velocities using numerical method. Also experimental verification for strain measurement is done in real time using data acquisition devices.
Sports always play a major role in human life and with the advent of new technology it is gaining importance in recent years. There is an increasing need in research and development for a theoretical cricket ball model that can be incorporated in the analysis of bat impact stresses, deformations and durability. The models developed would be useful to comprehend the impact details deeply so as to provide some data to avoid sports injuries. The magnitude of vibration on the muscles during various strokes may lead to strain and overload the players. In games such as cricket the delivery speed of the ball is greater than 150 kmph for fast bowling. The batsman has to release a proper shot to encounter the ball coming with such high velocity. There are possibilities for the arm to get strained.
Measuring the muscle activity at this point gains importance. Sometimes overstrain might lead to injuries for the player. A model has been developed to find out the vibrations of the bat during the collision between the bat and baseball (Nathan, 2000). The parameters like wrist vibration, swing velocity and forearm muscle activation while hitting baseballs were investigated by in the study Yang et al. (2021). Many previous literature surveys referred to study related to baseball. The performance of batted ball has been analyzed for baseball bats using the vibration data (Sutton & Sherwood, 2010). There are regions in the bat where the exit velocity of the ball is a function of impact location and these regions are considered to be more important. This concept has been experimentally proved for a cricket batsman where the accelerometer readings were high showing the existence of sweet spot locations. These accelerometers were wrist mounted (Sarkar et al., 2012). The fatigue analysis for cricket bat has been done for the ball coming up with various velocities (Brooks et al., 2006). The location of minimum amplitude of vibration has been found on the bat (Hariharan & Srinivasan, 2012).
Seshadri et al. (2019) proposed a methodology to measure strain using strain gauge sensor where the data acquisition is done by low cost microcontrollers. The results obtained were satisfactory and has been verified by using finite element analysis software. Ul-Haq et al. (2017) explained how the strain gauges were used to detect muscle contractions and showed a better result compared with electromyography sensors. Continuous excessive strain in ankle joints will lead to tear in ligaments. Houghton et al. (2011) measured the strain by applying various degrees of stress to the ankle joint and stated the maximum strain rate. Pote and Christie (2016) explained how the strain gauge sensors were used to find the muscle contractions, which were directly related to change in length of the sensor during muscle contractions.
From the cricket data base, it is observed that the speed of the cricket ball is in the range of 40 km/h to 150 km/h. Considering this as input, the ball velocity is calculated for the respective ball speed as shown in Table 1.
Table 1. Calculation of Hitting Force
The ball hitting force or impact force of the ball is calculated using the data given below:
Mass of the cricket ball = 163 g (≈ 0.15 kg)
Maximum velocity of the ball while bowling =150 km/h
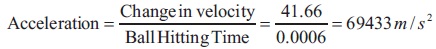
= 41.66 m/s
Ball hitting force = (Mass of the ball) x (Acceleration)
= 0.15 x 69433 = 10415 N
Figure 1 shows a plot of the ball hitting force for the different ball speed. It is inferred from the graph that the ball hitting force is directly proportional to the ball speed.
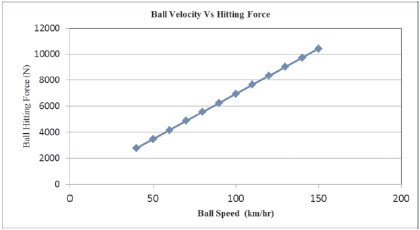
Figure 1. Ball Velocity vs Ball Hitting Force
To predict the effect of the ball hitting force on the bat and human arm, finite element analysis is carried out using ANSYS software. The cricket bat is made up of English Willow Wood and orthotropic material property is considered in the finite element analysis. The material properties are listed in Table 2.

Table 2. Material Properties of English Willow Wood Bat
Figure 2 shows a typical Willow Wood cricket bat modeled using Cero CAD software. The bat is modeled using solid element with 3 degree of freedom along the three directions x, y and z as shown in Figure 3. The pull shot in cricket played by a player is shown in Figure 4. The boundary conditions are arrived from the pull shot as shown in Figure 5.
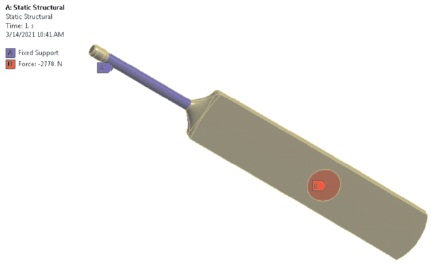
Figure 2. A Typical Cricket Bat
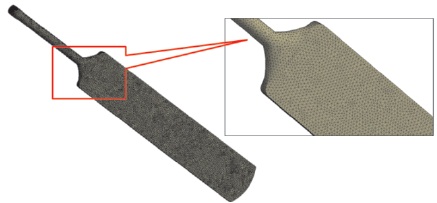
Figure 3. Finite Element Model
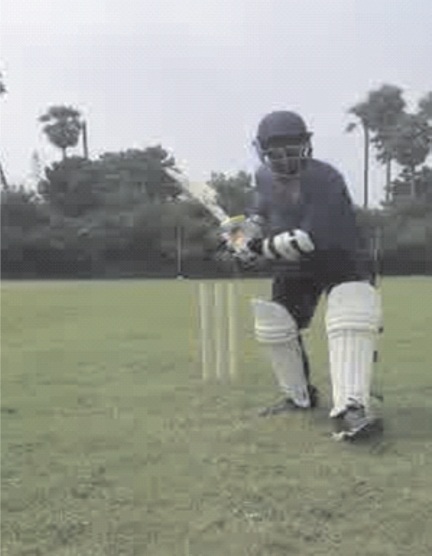
Figure 4. Cricket Player Pull Shot
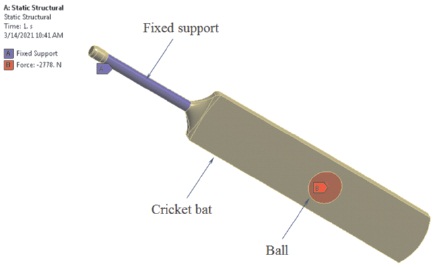
Figure 5. Boundary Condition
To simulate the ball hitting on the bat, the impact force at different ball speed is applied on the bat as shown in Figure 6. The impact force for minimum ball speed of 40 km/h is 2778 N and maximum ball speed 150 km/h is around 10417 N. After applying the loading and boundary condition, the model is solved using ANSYS and results are obtained.
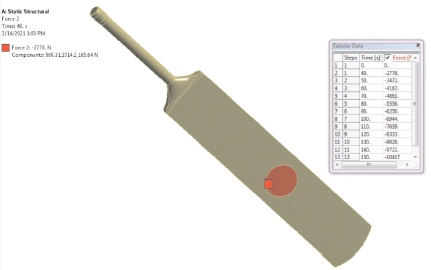
Figure 6. Impact Force
Figures 7, 8, 9 and 10 shows the stress and strain details for ball velocities ranging from 40 km/h to 150 km/h. Figure 11 shows the calculation of reaction force in all three directions (x, y and z). Maximum reaction force is observed during pull shot that is along y-direction. Figure 12 shows that the stress induced in the arm has direct relation to the velocity of the ball. There exist an energy exchange mechanisms between the ball, striking bat and the player arm. Figure 13 shows the energy exerted from the bat due to ball hitting.
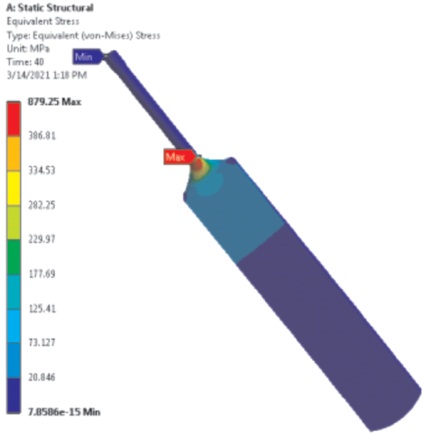
Figure 7. Stress at Ball Velocity 40 km/h (von Mises Stress)
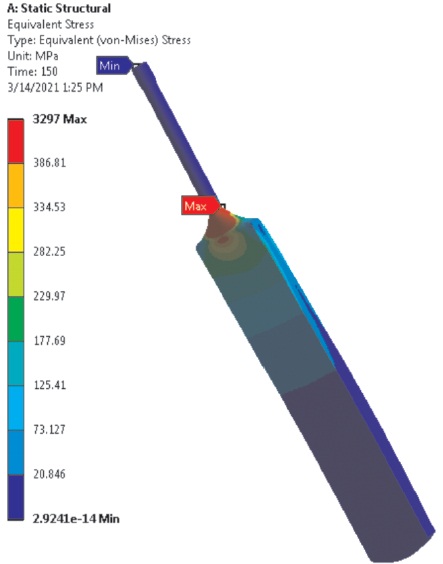
Figure 8. Strain at Ball Velocity 40 km/h
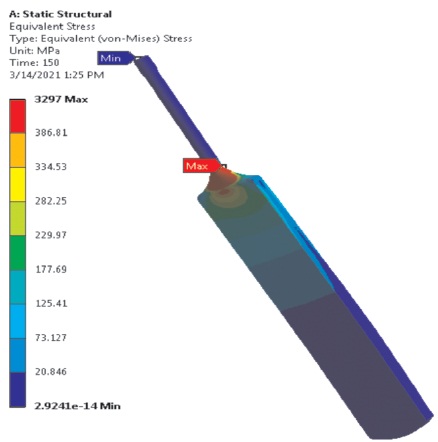
Figure 9. Stress at Ball Velocity 150 km/h (von Mises Stress)
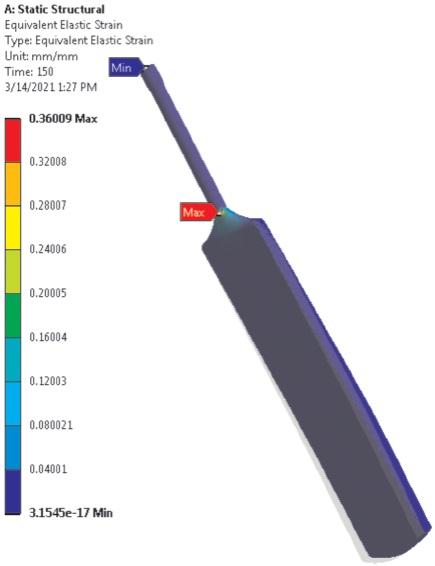
Figure 10. Strain at Ball velocity 150 km/h
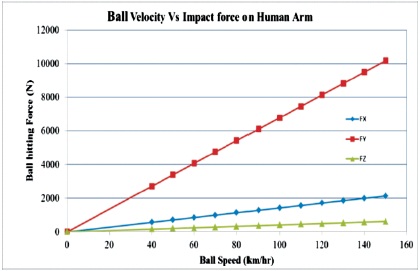
Figure 11. Reaction Force on the Arm Due to Ball Hitting
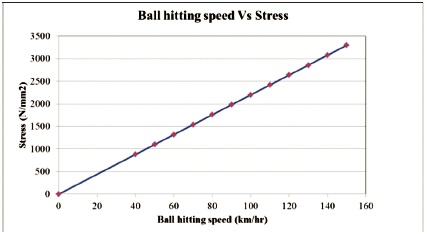
Figure 12. Stress Due to Ball Hitting
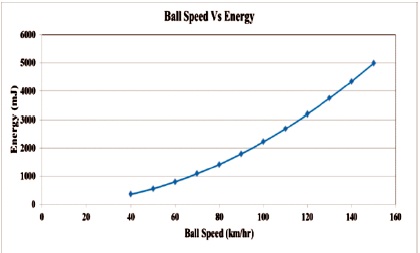
Figure 13. Energy Consumed During Ball Hitting
In order to verify the results obtained using the numerical analysis, a verification of the same is done using LabVIEW and NI data acquisition devices (DAQ). The strain gauge sensors are placed on human arm and it is connected to the data acquisition device. The NI 9236 has in-built excitation voltage and has required signal conditioning to perform the dynamic strain measurement. The device rejects the common mode noise effectively and measures strain instantly in real time.
Figure 14 shows the strain measurement in the arm of batsman developed in hitting the ball coming with various velocities. This strain value is measured with the data acquisition device.
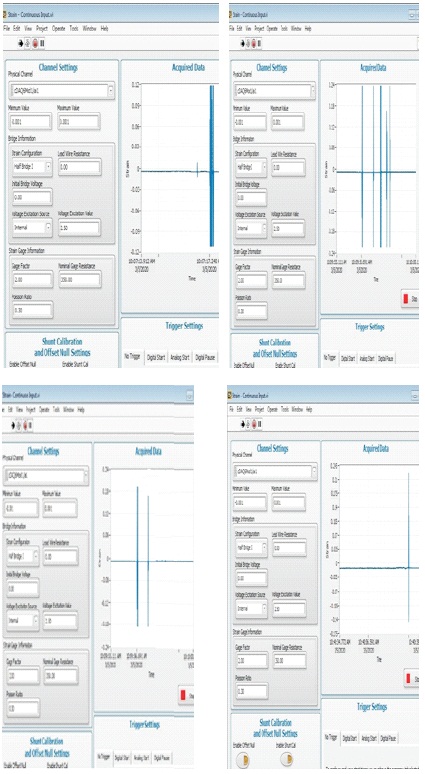
Figure 14. Strain Measurements from Data Acquisition Device for Various Ball Velocity
Figure 15 shows the comparison on the numerical and experimental analysis on the ball velocity verses strain. In numerical analysis the strain is directly proportional to the ball velocity. But in experimental analysis there are some fluctuations. This is due to manual measurement variation and strain gauge variability
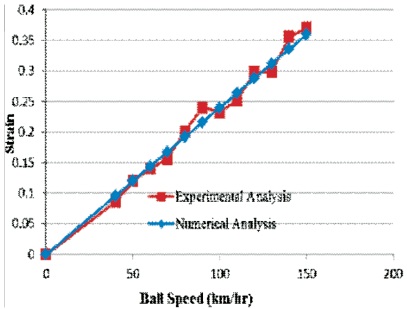
Figure 15. Ball Velocity vs Strain
From the experimental strain measurement it is observed that the maximum strain for the ball coming with a velocity of 50 km/h is 0.12, for a velocity of 100 km/h is 0.23 and for a velocity of 110 km/h the strain measured is 0.252.
In this work the impact force is calculated for different ball speed in the range of 40 km/h to 150 km/h. The bat is modeled using numerical method and orthotropic material properties are considered for the bat material. Impact force is calculated using ball mass, speed and hitting time.
The stress and strain values are calculated for various forces at which the ball hits the bat. Also reaction force at the time of ball hitting on the bat is calculated. The reaction force experienced by the bat handle is directly transferred to the player hand.
In order to verify the numerical results experimental strain measurement is carried out using DAQ. There is a good correlation between the numerical analysis results and experimental results and it is observed that the variation is less than 5%. The measured data will be useful for predicting the injury in the arm of sports player. In future machine learning algorithms can be developed to predict the strain in arm of a player while playing his game.