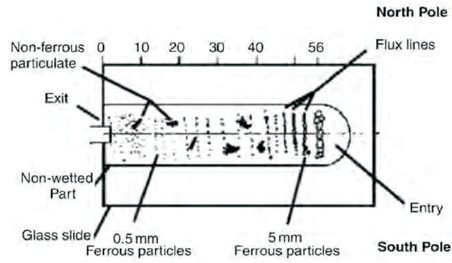
Figure 1. Ferrogram (Sondhiya & Gupta, 2012)
Condition monitoring of machines is determination of condition of machine and its change with time. Working condition of machines may be analyzed by measuring physical parameters like: vibration, noise, wear debris, temperature, oil contamination, etc. Wear debris and vibration condition monitoring have great importance in machinery maintenance and fault diagnosis. This paper deals with effective analysis of both combined vibration condition monitoring and wear debris in machinery maintenance and fault diagnosis. Both techniques have their own merits and demerits associated with monitoring and fault diagnosis of machinery. However, it is seen from the past practical experience that using these techniques independently gives a small portion of machine fault diagnosis. By combining both the techniques in machine fault diagnosis it can provide more reliable information. The objective of this paper is to analyse the co-relation between techniques, achieved by experimenting worm gear box at different operating conditions driven by electric motor. Initially, the worm gear box runs under normal conditions. A number of tests has been performed with different contaminant particles added to various lubricants. Wear debris and condition monitoring techniques were studied and results obtained were compared.
Condition monitoring also referred to as condition-based predictive maintenance, as its name suggests is a condition based preventive maintenance program. Due to high thermal and mechanical stresses worm gearbox lubrication oil is subject to degradation including corrosion, water and particle contamination that affect the efficiency of the worm gearbox and hence the overall performance. Vibration analysis has been widely applied to condition monitoring of rotating machines to identify incipient faults and facilitate root cause failure analysis in order to enhance the life cycle of rotating machinery.
Several papers in the literatures proved that vibration analysis is the best suitable predictive maintenance technique for industrial machinery. Heidarbeigi, Ahmadi, and Omid (2010) have studied Adaptive Vibration Condition Monitoring techniques for Local Tooth Damage in Worm gearbox. Ebersbach, Peng, and Kessissoglou (2006) have investigated condition and faults of a spur worm gearbox using vibration and wear debris analysis techniques. Sondhiya and Gupta (2012) studied wear debris analysis of automotive engine lubrication system oil using ferrography. Govindarajan and Gnanamoorthy (2008) explained ferrography method for carrying wear debris analysis. Peng, Kessissoglou, and Cox (2005) have studied the effect of contaminant particles in lubricants using wear debris and vibration condition monitoring techniques. Yarrow (1993) had presented an overview of wear debris analysis, which can be carried for condition monitoring of mechanical systems. Edmonds, Resner, and Shkarlet (2000) detected wear debris in Lubrication Systems.
Wear Particle Analysis (WPA) is a technology that utilizes microscopic analysis to identify the composition of materials. WPA is a non-invasive examination of the oilwetted components of machinery. The particle's size, shape, and composition allow a process of elimination in which the abnormal wear of specific components can be identified. Using ferrographic techniques as shown in Figure 1, it identifies wear-related failures at an early stage, before collateral damage or failure occurs. Wear particle analysis is used in two ways. A lubricant sample is diluted with a solvent like Tetra Chloro Ethylene (TCE) and allowed to flow down a specially prepared low-gradient inclined slide while passing across a bipolar magnetic field. The force that attracts the particles is proportional to their volume, whereas the viscous resistance of the particles to motion is proportional to their surface area. The flow rate of the process is such that non-ferrous particles and contaminants are randomly deposited due to gravity down the length of the slide substrate. After this process, a solvent is used to remove the lubricant remaining on the slide (Govindarajan & Gnanamoorthy, 2008; Sondhiya & Gupta, 2012).
Figure 1. Ferrogram (Sondhiya & Gupta, 2012)
Figure 2 shows deposition of particles on the slide called as a ferrogram. When the ferrogram has dried, the wear particles and solid contaminants are stuck on the slide surface and are ready for examination under a microscope (Govindarajan & Gnanamoorthy, 2008; Sondhiya & Gupta, 2012; Mortier, Orszulik, & Fox, 2010).
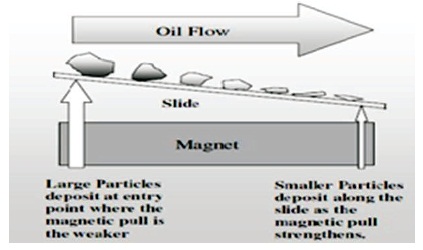
Figure 2. Schematic Diagram of Ferrogram (Govindarajan & Gnanamoorthy, 2008)
The flow rate of the process is such that non-ferrous particles and contaminants are randomly deposited due to gravity down the length of the slide substrate. After this process, a solvent is used to remove the lubricant remaining on the slide. This deposition of particles on the slide is called a ferrogram. When the ferrogram has dried, the wear particles and solid contaminants are stuck on the slide surface and are ready for examination under a microscope (Govindarajan & Gnanamoorthy, 2008; Sondhiya & Gupta, 2012).
Vibration measurements are widely used tools that have been around for decades for the monitoring variety of machines and their components. In general, machines do not typically fail without some type of advanced warning, which in this case is measured as increased vibrations. Changes in both the speed and load of machinery will have a direct effect on the overall vibration levels of a machine. Most common methods for vibration analysis include measure the overall vibration of the system and spectrum analysis. Overall vibration readings are taken by examining the raw signal data from the transducers and acquiring the peak-to-peak values of the signal. While this approach is simple it tends to be insensitive to considerable amplitude differences in amplitude of particular frequencies, although they make up only a small portion of the overall signal.
Spectrum analysis is a widely used technique in many maintenance management systems due to the recent advancements in computer software. By analyzing time as well as frequency spectrums, and using Fast Fourier signal processing software, the natural frequencies of specific structural components can be identified. Modal parameters are extracted from frequency data domain, which is used to produce modal domain data. It also converts time domain to modal domain. While vibration monitoring is used for providing quick and cost effective information, it is limited to monitoring the mechanical condition of the equipment, and not other critical parameters. Also, it is often difficult to apply monitoring at low speed machinery (less than 5 rpm). (Ebersbach et al., 2006; Peng et al., 2005; Yarrow, 1993; Scheffer & Girdhar, 2004).
The test rig assembly used for the experimentation consisted of a worm gearbox driven by an electric motor, and loaded by agitating water within a reservoir tank via a paddle. Figure 3 shows the experimental set up with assembly motor, worm gearbox, and shaft. Experimental setup used for the experimentation consisted of electric motor driven worm gearbox and loaded by agitating water within a reservoir tank via a paddle. It consists of screw worm which is driving member, that meshes worm wheel which is larger in size (Ebersbach et al., 2006; Peng et al., 2005; Yarrow, 1993; Scheffer & Girdhar, 2004).
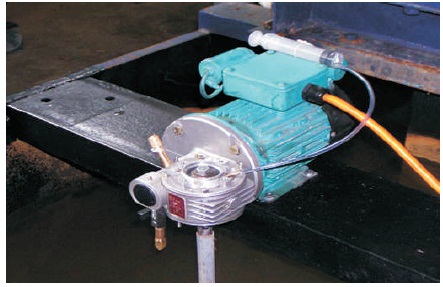
Figure 3. Photograph of the Test Rig Assembly Mounted Over a Reservoir Tank, showing the Motor, Gearbox, and Output Shaft for the Paddle
Five tests were conducted. First test relates to normal lubrication that is recommended oil to lubricate worm gearbox with normal working conditions. First test provides good comparison test with proceeding four tests. In second test, special operating conditions for worm gearbox have been created relating to the lack of lubrication. Here oil was changed with one forth viscosity that is recommended for test first. Third test introduces the contaminants to worm gearbox with normal operating lubrication conditions. Fourth test is involved in adding contaminants particle to recommended lubricants. In test five, MH300.29 iron powder is added to worm gearbox working under lack of lubrication (Ebersbach et al., 2006; Scheffer & Girdhar, 2004; Hongbo, Yingtang, Guoquan, & Fei, 2009).
For the entire test, worm gearboxes were run for four weeks. In first and second tests, worm gearbox was running continuously for full 4-week period, but for tests three to five involving in addition of contaminants in the lubricating oil, the system was running for 48 hours, after that it was flushed and cleaned. Table 1 shows result summary of tests conducted (Ebersbach et al., 2006; Peng et al., 2005; Yarrow, 1993; Scheffer & Girdhar, 2004).
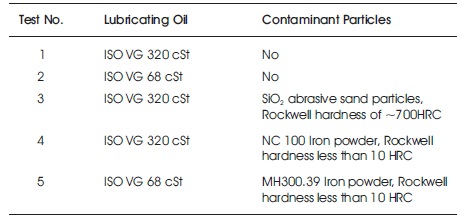
Table 1. Test Results Summary of the Tests Conducted on the Worm Gearbox
In order to detect wear mechanisms and wear modes of the tests in detail, particles were examined with standard optical microscope and then using a Confocal Laser Scanning Microscope (CLSM). Particle type, all surface characteristics and colors were studied by using optical microscope. The CLSM facilitates to acquire sequential images for varying depths. Both boundary and surface definition of particles were obtained with CLSM. Surface roughness (Ra) is a numerical parameter used to describe surface roughness of the particles (Pouzar, Černohorský, & Krejčová, 2001; Murali, Choy, Zhe, Carletta, & Xia, 2008).
The ISO VG 320 cSt oil especially recommended for these applications has been used in test 1 on new worm gearbox. In the test as shown in Figure 4 first four slides were made from oil samples collected weekly for 4 weeks. Oil collected throughout test 1 was clean and light in color. The three major types of the wear particles that correspond to rubbing, cutting, and laminar wear were found in oil sample on first slide. Both crown gear and worm screw gear generates small rubbing and laminar particles. Few particles were found in slide 2 and decrease was because of few cutting particles as shown in Table 2. This indicate that there was an appropriate lubrication layer that existed between two gear surfaces, and wear process was stabilized during the test (Liu, Li, Cao, & Xiong, 2009; Roylance & Hunt, 1999).
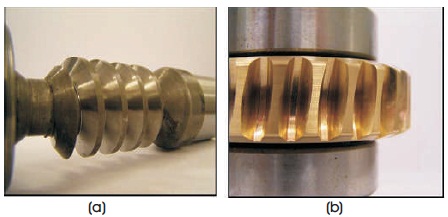
Figure 4. (a) The New Worm Screw Gear (b) The New Crown Gear
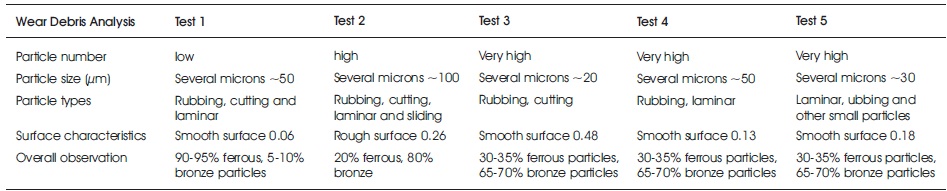
Table 2. Wear Debris Analysis - Test Results Result using Vibration Analysis (Ebersbach et al., 2006)
In test 2, the recommended oil was replaced with a general purpose ISOVG68 cSt oil. To avoid every possible cross contamination and compatibility issues, worm gearbox used in test first was completely cleaned and flushed. The oil samples were again collected on weekly basis for 4 weeks. Careful examination of slides from test second revealed that 5 types of wear particles rubbing, cutting, laminar, sliding, and fatigue particles were present on all slides. The decrease in particle size and number of slides four indicate that the surfaces have become smooth as shown in Figures 5 and 6. The debris analysis is shown in Table 2. The sliding particles constantly decreasing in the size during test Second, indicates that there is a lubrication problem that caused a significant amount of metal to metal contact. Substantial surface sliding contact broke away particles, and gradually smoothed the surface until the particle size was greatly reduced. Scratches caused from the worm screw gear's contact with the crown were evident. This indicates sliding and abrasion caused by high levels of metal to metal contact due to inadequate lubrication breakdown.
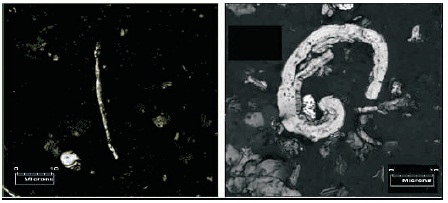
Figure 5. Images of Two Typical Cutting Particles from Test Second
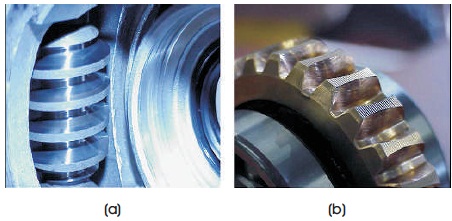
Figure 6. (a) Worn Surface of the Worm Screw Gear after Test Second (b) Worn Surface of the Crown Gear after Test Second
Due to machining process, considerable particles on slide 4 have a straight or regular edge. Following the trend explained above, the particles surfaces becomes rougher from slide 1 to slide 3, and then smoother in slide 4 (Liu, Li, Cao, & Xiong, 2009; Roylance & Hunt, 1999).
In test third, 1 gram of SiO abrasive sand particles was 2 added to new worm gearbox with normal lubrication conditions by using ISO VG 320 cSt oil. The new oil and a measured quantity of contaminants particles were then added to worm gearbox. Inspection reveals that the significant wear has been occurred. Scratches along with the direction of contact of the screw gear makes with worm crown. It can be linked to sliding and abrasion caused by the high levels of metal to metal contact. It was concluded that large particles were involved in the wear process and were thus broken down into numerous small particles, and larger particles sunk of the bottom of worm gearbox and was not get collected or have any connection with overall wear process as shown in Figure 7. The contaminant particles were observed rather smooth, round, and were reflective. Results of wear debris analysis for test three is shown in Table 2 (Ebersbach et al., 2006; Liu et al., 2009).
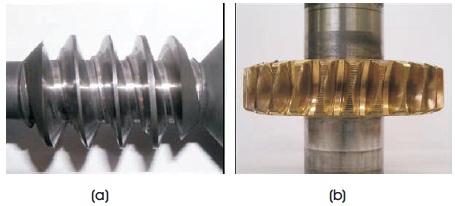
Figure 7. (a) Worn Surface of the Worm Screw Gear after Test Third, (b) Worn Surface of the Crown Gear after Test Third
In test four, 0.5 gram of NC100 iron powder was added to the new worm gearbox under normal operating lubrication conditions by using the ISO VG 320 cSt oil. As compared to test first, size of the particles in test four is slightly larger. However, as compared to the wear debris analysis results from test three, there is significantly less wear of the worm gearbox by using the iron powder in test four, as compared to by using abrasive wear sand particles in test three. As a result shown in Table 2, there is no significant amount of cutting particles generated, and both the surfaces of that gears and wear debris have become relatively smoother because of that rubbing wear. Post-test inspection of that gear surfaces have confirmed the outcome of that wear test using the iron particles. The iron particles were observed to be somewhat clear and non-reflective. It was also noticed that the size of iron particles after each of test phase has decreased as that particles were breaking up during the running of the worm gearboxes. The summary of wear debris results for test four is given in Table 2 (Ebersbach et al., 2006; Liu et al., 2009).
In test five, 1 gram of MH300.29 iron powder is added to the new worm gearbox with the lack of lubrication condition by using the ISO VG 68 cSt oil. The similar procedure used in test three for oil sampling, and worm gearbox cleaning and flushing was repeated for test five as shown in Figure 8.
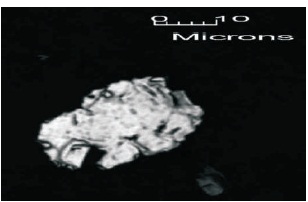
Figure 8. Representative Laminar Particle from Test Five (Ebersbach et al., 2006)
The chunky particles were similar to the fatigue particles, but it is also possessed with variety of features which are more common because of rolling contact between that teeth due to iron particles contaminated as shown in Figure 9. Vibration measurement was taken on the DE and NDE both of the worm screw and worm crown gears using ® a PCB ICP accelerometer (PCB which is the manufacturer). Integrated Circuit Piezoelectric (ICP) sensors have built-in signal conditioning electronics, which converts entire high-impedance charge signal generated by using piezoelectric sensor into the usable ® low impedance voltage signal. Hence, the ICP accelerometer is very suitable for the use in any dirty field of high temperature environments with the little degradation of signal.
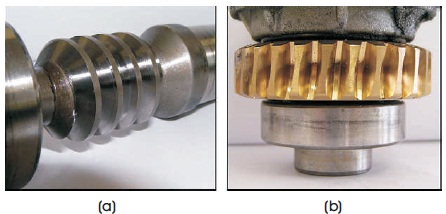
Figure 9. (a) Worn Surface of the Worm Screw Gear after Test Fifth (b) Worn Surface of the Crown Gear after Test Fifth
When manufactured, gears tend to be imperfect in the profiles of those teeth. During these first few hours of the operation, high amplitudes and evidence of the wear generally subside, as this period is typically is the run-in period. As the gears wear, with the amplitude of the vibrations is observed in the frequency spectrum increases at similar frequencies. These peaks then broaden and develop sidebands. The presence of these sidebands also provides an indication to the wear of gears. The summary of wear debris results for test four is given in Table 2 (Ebersbach et al., 2006; Liu et al., 2009).
It was run at normal operating condition. In first test, the worm gearbox was comparatively worn free. Examinations of both time and the frequency domain plots are recorded over the whole duration of test one indicated that the worm gearbox is operating with minimum wear (Ebersbach et al., 2006; Peng & Kessissoglou, 2003).
The test conditions used in test second was especially designed to produce an inadequate lubrication conditions. In this frequency region around 270–280 Hz, this increase in energy levels indicates that there may be a developing bearing defect as shown in Figure 10.
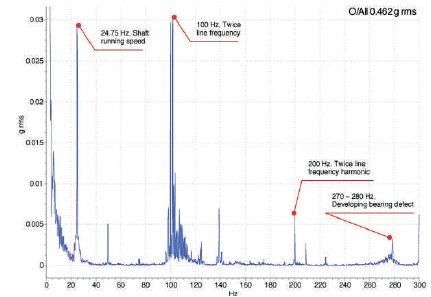
Figure 10. Acceleration–Frequency Spectrum of the Crown Drive End Vibration Analysis - Results of Test Number Second (Ebersbach et al., 2006)
The developed bearing defect was consistent with the inadequate lubrication, resulting into the increase in metal to metal contact with the formation of the scratches along with direction of the contact between the worm screw and crown gears (Ebersbach et al., 2006; Peng & Kessissoglou, 2003).
Figure 11 shows that the acceleration frequency spectrum is obtained at crown DE at completion of the testing.
The frequencies which are present include the shaft speed peak, line frequency and twice the line frequency along with the harmonics, and outer race bearing frequency. This is the fact that the outer race bearing frequency which is present indicates a developing bearing problem. This is as expected as abrasive sand particles that were added to the system, and this will have great impact on bearings. In addition to that the region of increasing energy content and broadband noise in the frequency range of 220 to 340 Hz indicates that both have increased the wear and the bearing defect as shown in Figure 11 (Ebersbach et al., 2006; Peng & Kessissoglou, 2003).
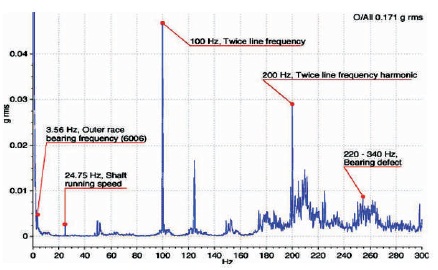
Figure 11. Acceleration–Frequency Spectrum of the Crown Drive End. Vibration Analysis - Results of Test Number Third (Ebersbach et al., 2006)
During test four, vibration amplitudes were shown as a slight increase in shaft running speed, which indicates an increase in wear rate. The harmonics of shaft running are also present. The narrowband region of the increasing energy content around 260 to 280 Hz is shown in Figure 12, with the energy levels which are not significant or raised from baseline compared to test third. This region represents that the bearing defect and mound of energy indicates there is increased wear. Narrowband region of the increasing energy content around 260 to 280 Hz, though the energy levels are not that much significant or raised from the baseline as compared to test 3. Shafts running speed also rises.
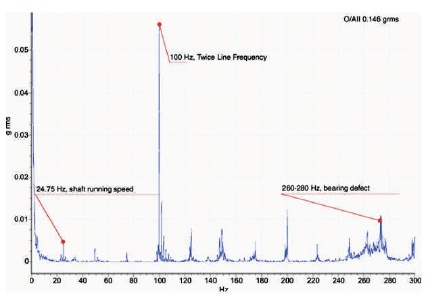
Figure 12. Acceleration–Frequency Spectrum of the Crown Drive End. Vibration Analysis Results of Test Number Fourth
Figure 13 shows that the acceleration frequency spectrum obtained at the worm crown DE at completion of test fifth. The specific frequencies which are present include the shaft speed peak and the line frequency, and twice the line frequency along with the harmonics.
Now line frequency and its harmonics have been observed due to the fact that the drive end of the worm gearbox, which is directly fastened to the motor causing all vibrations that are directly transmitted through the shaft and housing as shown in Figure 13. It also shows numerous smaller harmonics of the running speed, which are attributed to the mechanical looseness within the worm gearbox. Even under the lack of lubrication conditions, there is no any noticeable bearing fault that is developing from the vibration spectra that is attributed to anti wear properties of MH300.29 iron powder. Now the vibrations data have been consistent with both wear debris analysis and posttest visual inspections (Ebersbach et al., 2006; Peng & Kessissoglou, 2003).
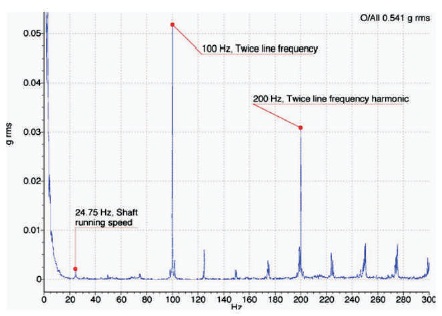
Figure 13. Acceleration–Frequency Spectrum of the Crown Drive End. Vibration Analysis - Results of Test Number Fifth
Vibration analysis and oil analysis are highly effective techniques in monitoring the health of machines. They offer root cause analysis of machine failure. In this study, both wear debris analysis and vibration analysis, have been used to identify wear in a worm gearbox under different controlled experimental conditions. Wear particle analysis provides most conclusive results. Presence of these sliding particles due to metal to metal sliding is a better indicator of the lubrication breakdown. The inclusion of the abrasive sand particles greatly accelerated the gear wear rate. Vibration analysis concluded that there is considerable damage of bearings due to motor problems. Three-body abrasive cutting is a major contributor for abnormal wear results into catastrophic failure. Vibration and oil analysis are most effective techniques for monitoring of machinery. Wear debris include the calculation of wear rate, metal in contact, and lubrication breakdown at boundary. Wear analysis include the detection of rubbing, metal-to-metal contact, and boundary lubrication breakdown. Results show that these two condition monitoring techniques have found that similar wear mechanisms were associated with the gearbox. Both the techniques are used to monitor the performance of worm gear under different working conditions. Both the techniques are used to monitor the performance of worm gear shows similar results. After comparison of results of both techniques, most appropriate analysis of condition of the experimental setup can be possible.
Vibration analysis quickly provide reliable information on the condition of the bearings. Both the wear debris and vibration analysis techniques were used to assess the condition of the worm gearbox and diagnose problems.