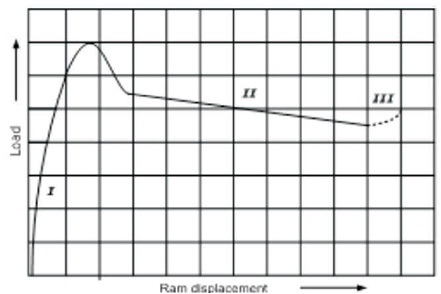
Figure 1. Variation of Load Versus Ram Displacement in Direct Extrusion (Saha, 2000)
In direct aluminum extrusion, so much work has been accumulated to control the process with respect to such principle element as billet metallurgy, die design, equipment, and process parameters. The objective of this paper is to develop an algorithm that can be used to extract some features from the energy consumption cycle in one billet. The results of the diagnostic analysis can be used to monitor energy consumption and time it takes to extrude one billet. In addition, the developed method can be automated to predict how long the production will be at its maximum and at its minimum. Hence, energy and time can be saved. The work presented here is based on real-data taken from a sensor attached to three pumps at the plant that takes 5 readings every 2 seconds for each pump. That is, a total of 15 readings every 2 seconds. The work presented is for direct-extrusion using 2420 Metric ton capacity. The algorithm detects the boundary points for the regions in the signature. It should be emphasized that the available machine is designed for direct extrusion operations only.
“Extrusion is one of the major metal forming processes used in transforming the size and shape of the material from the cast structure of an ingot to useful product” (Chahare & Inamdar, 2017). Aluminum extrusion is defined as the process of shaping metal by forcing a hot aluminum billet to flow through the die opening of smaller cross-sectional area than that of the original billet (Al- Smadi, As’ad, & Massarweh, 2007). Aluminum is the most abundant metal in nature and the third most common element in earth’s crust after oxygen and silicon. Aluminum is never found as an element metal. However, it is found combined with other elements and must be converted into its metallic state. The word “aluminum” is often understood as aluminum alloy, rather than metal (Hatch, 1984). The economic importance of extrusion has increased in the past three decades because of the technological advances that have drawn numerous fundamental investigations into the extrusion process (Mohapatra & Nayak, 2015). Aluminum extrusion has been used in automotive parts for the purpose of weight reduction (Hashimoto, 2017). Unlike steel, aluminum can be extruded in complicated cross-sectional shapes with a varying wall thickness distribution. With their lightweight, they are attracting attention as an effective means of reducing the weight of automobile.
Extrusion is the process of forcing heated aluminum through a die under extreme force to produce the desired shape. Billets are preheated and forced by a ram through one or more dies to achieve the desired cross-section. The two main processes for extruding aluminum are direct and indirect operations (Altenpohl, 1982). Extrusion process is executed as a discontinuous process. That is, the second billet is not loaded until the first has been extruded. Therefore, temperature variations in the billet can cause a non-steady state of the flow. This leads to non-uniform flow from the front of the billet to the end and results in a change in the extrusion load throughout the cycle, temperature differences that lead to variations in material properties over the cross section and along the extrusion, and the possibility of defects. A die shape optimization method for reduction of stress in aluminum rod in cold extrusion process is presented in (Karampour & Jabbari, 2015). A numerical simulation on the deformation behavior of 7085 aluminum alloy during the backward extrusion was also performed by finite element method (Mei et al., 2015). Borowski and Wendland (2016) have studied the regeneration process of dies and explained the reason why the durability of die increases as regeneration of die continues. Saha (1977), and Saha and Ghosh (1979) used a numerical method to complete the temperature distribution. An excellent numerical study was done by (Altan & Kobayashi, 1968) to calculate the non-steady state temperature distribution in extrusion operation through conical dies. In their study, they considered the thermal constants of the billet and the temperature dependencies of the flow stress. An equation to predict temperature rise as a function of several variables was developed by (Castle & Sheppard, 1976). The factors which dominate the ending temperature during the extrusion process were described by (Castle, 1993). An experimental study on the verification of the interactive effects of billet temperature and die temperature was performed by (Tashiro, Yamasaki, Ohneda, & Nakanishi, 1993).
In this paper, a diagnostic analysis of the energy consumption for real time conditions of the direct aluminum extrusion process will be presented. The results of the diagnostic analysis can be used to monitor the energy consumption and the time it takes to extrude one billet. In addition, the developed method can be automated to predict how long the production will be at its maximum and at its minimum. Hence, energy and time can be saved. The work presented here is based on real-data taken from a sensor attached to three pumps at the plant that takes 5 readings every 2 seconds for each pump. That is, a total of 15 readings every 2 seconds. The work presented is for direct-extrusion using 2420 Metric ton capacity. The algorithm detects the boundary points for the regions in the signature.
Extrusion is the process of forcing heated aluminum through a die under extreme force to produce the desired shape. A real study for the load - displacement curve during direct extrusion was performed by (Saha, 2000). The curve in Figure 1 shows the variation of load versus ram displacement in direct extrusion. Saha (2000) divided the process into three distinct regions as follows. Region I: In this region, the billet is upset, and pressure reaches its maximum point. Region II: In this region, the pressure dwindles down. Region III: In this region, the pressure reaches its lower point followed by a sharp increase as shown.
Figure 1. Variation of Load Versus Ram Displacement in Direct Extrusion (Saha, 2000)
In this section, an algorithm is developed that can be used to extract some features from the energy consumption cycle in one billet. The results of the diagnostic analysis can be used to monitor the energy consumption and the time it takes to extrude one billet. In addition, the developed method can be automated to predict how long the production will be at its maximum and at its minimum. Hence, energy and time can be saved. The work presented here is based on real-data taken from a sensor attached to three pumps at the plant that takes 5 readings every 2 seconds for each pump. That is, a total of 15 readings every 2 seconds. The work presented is for direct-extrusion using 2420 Metric ton capacity. The algorithm detects the boundary points for the regions in the signature. It should be emphasized that the available machine is designed for direct extrusion operations only. Figure 2 shows the flow chart for the proposed algorithm.
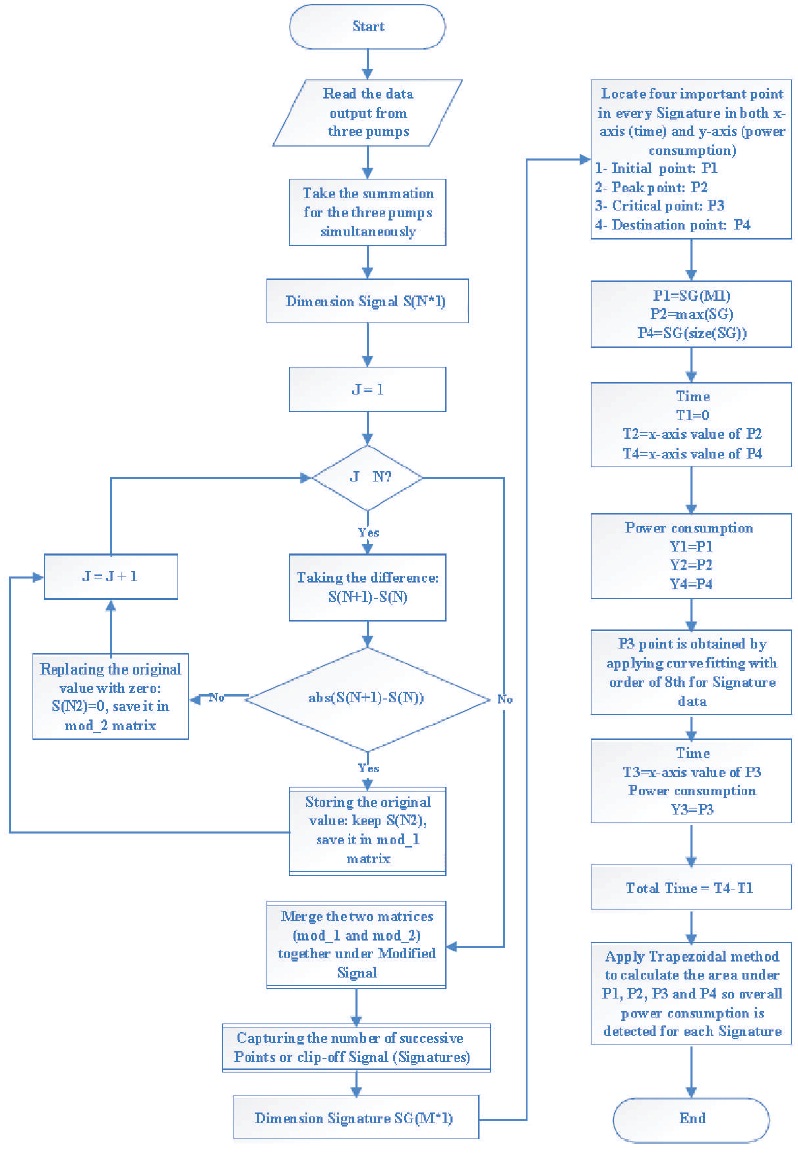
Figure 2. Flowchart for the Proposed Algorithm
The signal in this study consists of several repeated regions. The main region of study is the signature region (Asad, 2005). Each signature represents the energy consumption for the press during the extrusion of one billet. Other parts, namely, press during forward stem movement, backward stem movement, and dead cycle period are considered as unwanted regions. A sample of these measurement data is shown in Table 1. Figure 3 shows the three pumps that feed the extrusion press, which produces the desired signal.
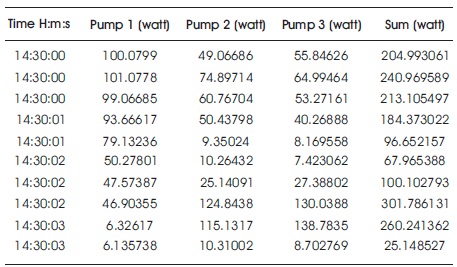
Table 1. Sample Data Output from the Sensor
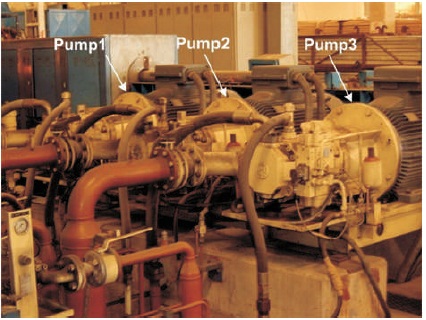
Figure 3. The Three Pumps that Feed the Extrusion Press
The sum of the above three values is treated as a point at that specific time as shown in the last column of Table 1. This total signal represents the total energy consumption of the pumps, which is composed of several signatures. The total signal can be divided into four repeated regions (Asad, 2005). Figure 4 shows the four repeated regions during extrusion process. The first region is the Forward stem movement. This region is generated when the stem is progressing ahead in order to begin upsetting the billet inside the container and start the extrusion process. The second region is generated when it moves in reverse direction to leave the container after the extruded is finished. The third region is the Signature region. This region is generated when the stem thrusts the billet against the die inside the container; that is, the metal starts to press through the die opening. The extrusion time is defined as the time needed to extrude the billet outside the container. The fourth region is generated when the container is empty (no work has been done) and is known as the dead interval.
Table 2 shows a sample data for each region. As can be seen in Table 2, the power consumption for Region 4 is low compared to regions 1, 2, and 3.
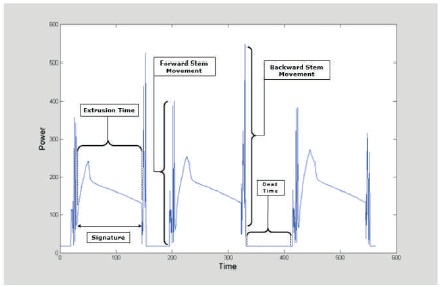
Figure 4. The Four Repeated Regions during Extrusion Process (Asad, 2005)
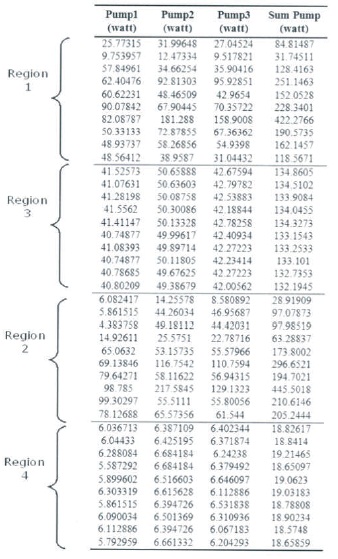
Table 2. The Observed Data from the Sensor
It can be seen from Figure 4 that the signal of interest is the one in Region 3; that is the signature part of the signal. Therefore, the boundary points will be located at the signature part of the signal. In addition, we have to detect these points in both x (time) and y (energy) coordinates as shown in Figure 5. The starting point P1 (x1, y1), the peak point P2(x2, y2), and destination point P4(x4, y4) are detected straightforward. However, for the critical point (P3) the situation is different.
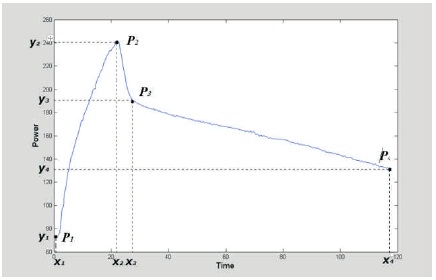
Figure 5. Boundary Point in both x and y Coordinates
It can be seen that the region of interest in the signature extends from the maximum point, P2, to the destination point, P4. Therefore, polynomial curve fitting was applied 4 to signature signal in Figure 5 to detect the critical point P3 (x3, y3). Hence, the boundary points (P1, P2, P3, and P4) of the signature were detected as shown in Table 3.
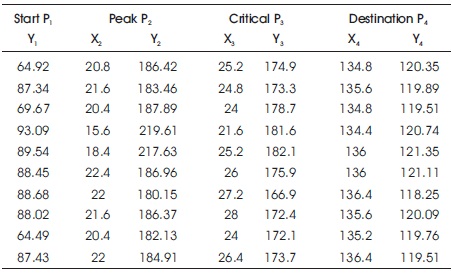
Table 3. The Four Points Boundaries in both Time and Energy Axis
To calculate the energy consumption for extrusion processes, the signature in Figure 5 was divided into three regions. Region R1 extends from point P1 to the point P2. Region R2 extends from point P2 to point P3. Region R3 extends from point P3 to point P4. In this region, the actual extrusion process takes place. Therefore, this region represents the energy consumption needed to extrude the billet. The time intervals and the energy consumption were calculated for each region in Figure 5. Table 4 shows the time interval for each boundary points, where TR1, TR2, and TR3 are the time intervals for regions R1, R2, and R3, respectively. The extrusion time TR was computed for each signature as follows,
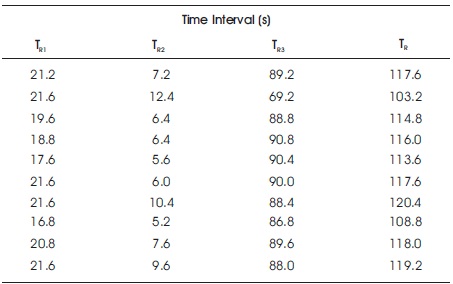
Table 4. The Corresponding Times for each Region in a Signature
Table 4 shows the corresponding times for each region in a signature. The energy consumption for each region was computed using the trapezoidal rule (Garold & Borse, 1997).
Table 5 shows the energy consumption for each region, where ER1, ER2, and ER3 are the total energy for regions R1, R2, and R3, respectively. The total energy for the signature is also calculated, which equals the total work required to extrude one billet as follows:
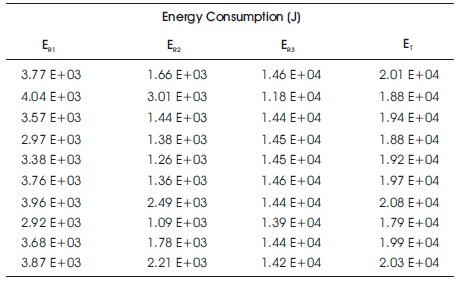
Table 5. The Corresponding Energy Consumption for Each Region in a Signature
The extrusion time for each signature was calculated as (2/5)* n, where n is the number of values. This comes from the fact that the sensor takes 5 measurements each 2 seconds. The time between each two consecutive signatures was calculated. This represents the dead time shown in Figure 5. Table 6 shows the signature (or billet) number, the number of samples in each signature taken from the sensor, the extrusion time, and the dead time.
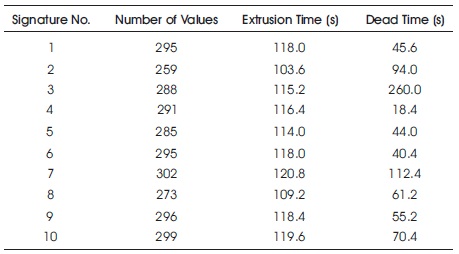
Table 6. Number of Values, Extrusion, and Dead Cycles for each Signature
The diagnostic method for the energy consumption is based on a study of a real data taken from a sensor attached to three pumps at the plant. The work presented here deals mostly with the signature regions; That is, each signature represents the energy consumption for extruding one billet. The remaining parts in Figure 4 are treated as undesirable signals. Hence, the region of interest becomes Region 3; that is the signature part of the signal. The desired signature signal is shown in Figure 5. Thus, four boundary points on each signature were located to detect these variations in both time (s) and energy (J) axis. These points are P1, P2, P3, and P4 representing initial, peak, critical, and destination points, respectively. Directly, we can detect the initial, peak, and destination points in each signature because it represents the minimum, maximum, and last point, respectively. However, for the critical point, the situation is different. So, part of the signature was taken that extends from the maximum point to the destination point and it is assigned as the original sub-signal. A polynomial curve fitting was applied to signature signal in Figure 4 to detect the critical point P3(x3, y3). Now, the four boundary points are available in both time and energy axis. According to these points, each signature was divided to three regions. Region R1 extends from point P1 to the point P2. Region R2 extends from point P2 to point P3. Region R3 extends from point P3 to point P4. In this region the actual extrusion process takes place. Therefore, this region represents the energy consumption needed to extrude the billet.
Then, the energy consumption for the three regions was computed using numerical integration. By summing these values, the total energy consumption for the press during the extrusion of one billet was calculated. Similarly, the time period for the three regions was founded in order to get the total time for the billet to be extruded, which is referred to extrusion time. The developed method can be automated to calculate the overall energy consumption and the extrusion time, which can be used to minimize spending and maximize the profit. This procedure will lead to more economical production.
It should be mentioned that signature amplitude (energy consumption) and length (extrusion time) depend on many factors. Therefore, the extrusion time and the energy consumption vary. Some of these factors are:
This paper presents an algorithm to extract some features from the energy consumption for aluminum extrusion process based on taking real data from a sensor at the plant. The algorithm was used to calculate the overall energy consumed which is required to extrude one aluminum billet in the Saha’s (2000) extrusion model. The results of the diagnostic analysis can be used to monitor the energy consumption and the time it takes to extrude one billet. In addition, the developed method can be automated to predict how long the production will be at its maximum and at its minimum. Hence, energy and time can be saved. The study was based on real data taken from a sensor at the plant that takes five measurements every two seconds for each pump. The study is made for direct extrusion using 2420 Metric Ton capacity. In addition, the algorithm detects the boundary points for the regions in the signature.