 chart
chartMeasurement data are used more often and in more ways than ever before. The decision to adjust a manufacturing process is nowadays mostly based on the measurement data. Hence, the decision to change a process is purely dependent on the quality of data we acquire. Higher the quality of data, greater is its reliability. A change in process which relies on the low quality data would obviously produce defective components which are a result of wastage of capital, labour, and time. Hence, the need for data with reasonable quality levels is felt. In the present work, the authors have assessed the validity of some measuring instruments which are used to measure some of the critical parameters of cylinder liners making use of certain gage characteristics like Repeatability and Reproducibility which capture the precision of a measuring instrument. The work was carried out at Kusalava International Limited which is currently one of the largest, leading International manufacturers of Centrifugal Cast Cylinder Liners. This study helped to make necessary modifications in the measuring equipment, so that the measurement data obtained from measuring instrument will be reliable.
The engine liner is responsible for ensuring the extremely hot exhaust does not damage the internal components of the engine. Due to its very important function, using replaceable cylinder liners can save time and costly machine work. The problem of cylinder wear in the engines is a very acute one. The solution to this has been found in the use of cylinder liners, which can be replaced when these are worn out. Liners are also used to restore a cylinder block to its original size which has been bored beyond allowable limits. They are made in the form of barrels from special alloy iron containing silicon, manganese, nickel and chromium. These are cast centrifugally. The liners may be further hardened by nitriding or chromium plating. For nitriding, liners are exposed to ammonia vapour at about 500 degree Centigrade and then quenched. Chromium plating improves their resistance to wear and corrosion. Aluminium alloy liners with chromium plating on the inside have also been used especially in combination with aluminium cylinder blocks. The use of aluminium alloy results in the increased thermal efficiency due to better heat conduction [5-7].
Among many parameters of a liner, only a few are said to be critical as they are considered to be important either by the customer or by the manufacturing industry in view of their importance, their effect on the utility, quality of the liner. These critical parameters are strictly inspected for every liner and utmost care is taken during inspection. Critical parameters are termed so as they are highly sensitive, when not maintained properly results in complete rejection of the liner even if all the rest of parameters are inscribed on the liner with perfection. The critical parameters of a liner are divided into following categories based on their effect:
These parameters affect the fitting of a liner into the engine block. If these parameters are not maintained properly, the liner does not fit into the engine block and hence is simply rejected as its purpose is lost away. Hence, the fitment parameters fall under critical parameters and hence are to be taken greater care during both machining and inspection. The following are the fitment parameters of a liner:
These parameters affect the functioning of a liner when put to use. If these parameters are not maintained properly, the liner could not function effectively and efficiently. Moreover, the false working of a liner may damage the piston as the piston has to slide inside the liner. This might also render parts which are in physical contact with the liner useless. Inner diameter if not maintained properly causes the piston not to fit into it. Hence, it is considered as critical parameter. Collar width is an important and critical issue due to the stress concentration to which it would be prone due to sudden change in cross section [11,12, 13]. So, proper care has to be taken during manufacturing, machining, and inspection of a liner. Hence, functional parameters fall under critical parameters. The liners sometimes is also checked for its function and then accepted. The following are the functional parameters of a liner:
Measurement data are used more often and in more ways than ever before. For instance, the decision to adjust a manufacturing process is now mostly based on the measurement data. The data, or some statistic calculated from them are compared with statistical control limits for the process, and if the comparison indicates that the process is out of statistical control, then an adjustment of some kind is made. Otherwise, the process is allowed to run without any adjustment. Another use of measurement data is to determine if a significant relationship exists between two or more variables. For example, it may be suspected that a critical dimension on a moulded plastic part is related to the temperature of the feed material. The possible relationship could be studied making use of the measurement data.
Studies that explore such relationships are often called as analytic studies [2]. In general, an analytic study is one that increases knowledge about the system causes, that affect the processes. Analytic studies are among the most important uses of measurement data because they lead ultimately to better understanding of the process. The benefit of using a data-based procedure is largely determined by the quality of measurement data used. If the quality of data is low, the benefit of the procedure is likely to be low. Similarly, if the quality of data is high, the benefit is also to be likely high. To ensure that the benefit derived from using measurement data is great enough to warrant the cost of obtaining it; attention needs to be focused on the quality of data.
A Measurement Systems Analysis (MSA) is a specially designed experiment that seeks to identify the components of variation in the measurement. Just as processes that produce a product may vary, the process of obtaining measurements and data may have variation and produce defects. A Measurement Systems Analysis evaluates the test method, measuring instruments, and the entire process of obtaining measurements to ensure the integrity of data used for analysis (usually quality analysis) and to understand the implications of measurement error for decisions made about a product or process.
Determination of these errors will help us to obtain a criterion to accept new MS, compare one against another, to evaluate a suspect gauge, to evaluate the effectiveness of repair. An ideal measurement system is the one which always produces correct measurements, always agrees with the standard whereas a good measurement system possesses adequate discrimination and sensitivity, is always under statistical control, has a smaller variability compared to manufacturing process variance and tolerance.
MSA includes the following analyzing functions:
The manufacturing process variation includes:
The measurement system variation includes:
Ability to detect the small changes in process, Traditional rule - 1/10th of tolerance, 1/3rd considering the cost/criticality.
Closeness to reference or master value (Required where two or more MS measuring a same characteristic). It is captured by bias, linearity and stability of a measuring instrument [5].
Ability of MS to repeat the same reading (Required where MS is repeatedly used to assess and adjust the process). It is captured by Repeatability and Reproducibility of a measuring instrument.
It is the difference between the observed average of measurements and the reference value. It is usually a systematic error component of the measuring instrument. It is the contribution to the total error comprised of the combined effects of all sources of variation, known or unknown, whose contributions to the total error tends to offset consistently and predictably all results of repeated applications of the same measurement process at the time of measurements. Usually an error in the master, usage of worn instrument, improper usage of gauge by the operator results in large gauge bias.
It is the total variation in the measurements obtained with a measurement system or the same master or parts when measuring a single characteristic over an extended time period. It is the change in bias over time. It is useful to compare two or more measurement systems measuring a same characteristic.
It is the change in bias over the normal operating change of the measuring instrument. It is a systematic error component of the measurement system. It is useful to capture accuracy over the operating range to assure its suitability of gage for the entire process variation, required for special gages designed by the organization.
The quality of measurement data is defined by the statistical properties of multiple measurements obtained from a measurement system under stable conditions. For instance, suppose that a measurement system, operating under stable conditions, is used to obtain several measurements of a certain characteristic. If the measurements are all close to the master value for the characteristic, then the quality of data is said to be “high”. Similarly, if one or all of the measurements are “far away” from the master value, then the quality of the data is said to be “low”. The statistical properties most commonly used to characterize the quality of data are the bias and variance of the measurement system. The property bias refers to the location of the data relative to a reference (master) value, and the property called variance refers to the spread of the data.
One of the most common reasons for low-quality data is too much in variation. Much of the variation in a set of measurements may be due to the interaction between the measurement system and its environment. For instance, a measurement system is used to measure the volume of liquid in a tank may be sensitive to the ambient temperature of the environment in which it is used. In that case, variation in the data may be due to either changes in the volume or to changes in the ambient temperature. That makes interpreting the data more difficult and the measurement system, therefore, less desirable. If the interaction generates too much variation, then the quality of the data may be so low that the data is not useful. For example, a measurement system with a large amount of variation may not be appropriate for use in analyzing a manufacturing process because the measurement system's variation may mask the variation in the manufacturing process. Much of the work of managing a measurement data is directed at monitoring and controlling variation. Among the other things, this would mean that emphasis needs to be placed on learning how the measurement system interacts with its environment so that only data of acceptable quality is generated.
It is defined as an assignment of numbers (or values) to material things to represent the relations among them with respect to particular properties. The process of assigning the numbers is defined as the measurement process and the value assigned is defined as the measurement value.
It is a device used to obtain measurements, frequently used to refer specially to the devices used in the shop floor.
It is the collection of instruments or gages, standards, operations, methods, fixtures, software, personnel, environment and assumptions to quantify a unit of measure of fix assessment to the feature characteristic being measured; the complete process used to obtain measurements.
It is the variation in measurements obtained with one measuring instrument, when used several times by an appraiser while measuring the identical characteristic of the same part. The variation in the successive trials under fixed and defined conditions of measurement is commonly referred as Equipment variation. This type of variation is also called as within-system variation [3] .
Possible causes for poor repeatability includes:
It is the variation in the average of the measurements made by different appraisers, using the same gauge when measuring a characteristic of one part. For product and process qualification, error may be appraiser, environment (time), or method. It is commonly referred as Appraiser Variation. It is also called as average variation between systems or between conditions of measurement.
Possible sources of reproducibility error include:
When the value of EV is high, it is usually suggested to replace the measuring equipment and if AV is high, it is suggested to train the appraiser in handling, using the measuring instrument.
GRR or Gage R&R, (Gauge Repeatability and Reproducibility) is the combined estimate of measurement system's repeatability and reproducibility. It is the variance equal to the sum of within system and between-systems variances [8].
Sensitivity is the smallest input that results in a detectable output signal. It is a measure of responsiveness of the measurement system to changes in measured feature [10] .
True value is the actual measure of the part. Although this value is unknown and unknowable, it is the target of the measurement process. Any individual reading ought to be as close to this value as possible.
When repeatability is large compared to reproducibility:
When reproducibility is large compared to repeatability:
Acceptability of GRR values:
Control charts are also known as Shewhart charts or process-behavior charts, in statistical process control are tools used to determine if a manufacturing or business process is in a state of statistical control. If analysis of the control chart indicates that the process is currently under control (i.e., is stable, with variation only coming from sources common to the process), then no corrections or changes to process control parameters are needed or desired [9]. In addition, data from the process can be used to predict the future performance of the process. If the chart indicates that the monitored process is not in control, analysis of the chart can help determine the sources of variation, as this will result in degraded process performance. A process that is stable but operating outside of desired (specification) limits (e.g., scrap rates may be in statistical control but above desired limits) needs to be improved through a deliberate effort to understand the causes of current performance and fundamentally improve the process. The control chart is one of the seven basic tools of quality control. Typically, control charts are used for time-series data, though they can be used for data that have logical comparability (i.e. in order to compare samples that were taken all at the same time, or the performance of different individuals), however the type of chart used to do this requires consideration.
The control charts used are,
1. chart
2.R chart
ChartWhen used with R-chart:
The Average and Range method ( & R) is an approach which will provide an estimate of both repeatability and for a measurement system. Unlike the Range method, this approach will allow the measurement system's variation to be decomposed separately into two individual components, repeatability and reproducibility [1]. However, the variation due to the interaction between the appraiser and the part/gauge is not accounted for in the analysis.
Applicability of this type of method are
Chart InterpretationIn the present work, 10 parts (cylinder liners) numbered as 1 to 10 are considered and some of their critical parameters like total length and collar width are measured by three appraisers A, B, C. The numbering given to cylinder liners is not visible to the appraisers. The gauge of each part is calibrated according to the measurements procedures. Let appraiser A measures 10 parts in a random order and enter the results in row 1 of “gauge repeatability and reproducibility data collection sheet”. Let appraisers B and C measures the same 10 parts without seeing each other's readings, and then enter the results in rows 6 and 11 respectively. Repeat the cycle using a different random order of measurement. Enter data in rows 2, 7 and 12. Record the data in appropriate column. Steps 4 and 5 may be changed to the following when large part size or simultaneous unavailability of parts makes it necessary: Let appraiser A measure the first part and record the reading in row 1. Let appraiser B measure the first part and record the reading in row 6. Let appraiser C measure the first part and record the reading in row 11. Let appraiser A repeat reading on the first part and record the reading in row 2,appraiser B record the repeat reading in row 7, and appraiser C record the repeat reading in row 12. Repeat this cycle and enter the results in rows 3, 8 and 13. An alternative method may be used if the appraisers are on different shifts. Let appraiser A measure all 10 parts and enter the reading in row 1. Then appraiser A have to repeat reading in different order and enter the results in rows 2 and 3. Do the same with appraisers B and C. The average values of 10 parts in a particular row is calculated and entered into the corresponding cell in the right of a row. Similarly the average values in a particular column is calculated and entered into the corresponding cell at the bottom of the column. Table 1 shows the total length calculations for GRR Sheet.
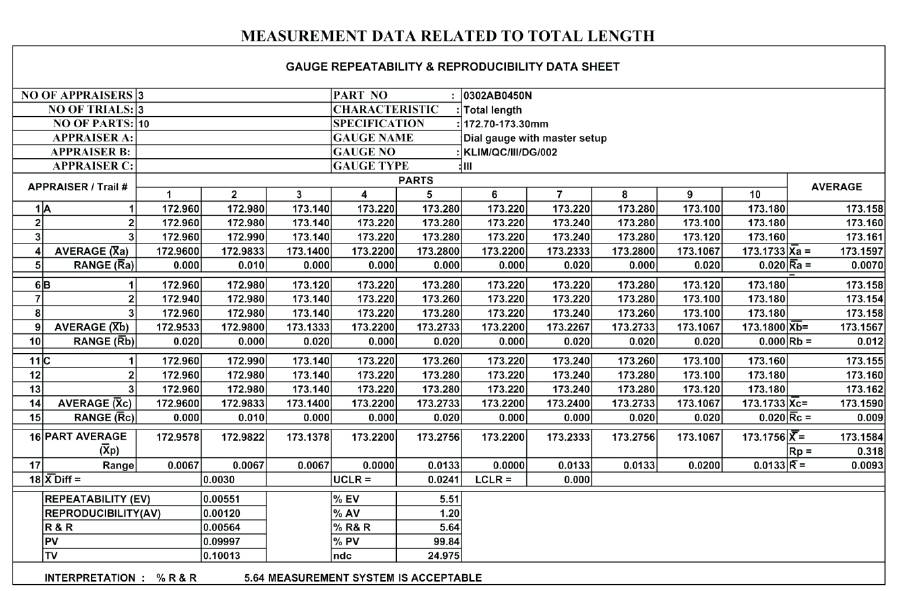
Table 1. Calculations for GRR Sheet of Total Length
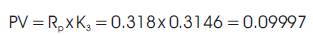
D4 = 2.58 (for 3 trails); K3 = 0.3146 (for 10 parts); K2 = 0.5231 (for 3 appraisers); Kt = 0.5908 (for 3 trails)

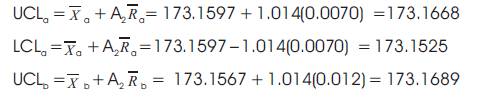
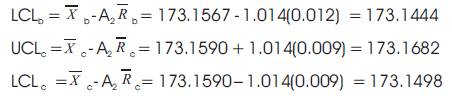
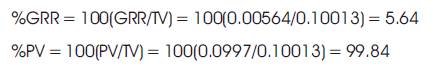
For - chart:
For R-chart:
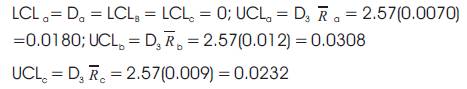
Figure 1 shows the control chart of appraises for A & B. Figure 1 (a, b), chart of appraiser A indicates more than 50% of the readings are outside the control limits which indicates Measurement system is adequate enough to capture process variation. From Figure 1 (c), R-chart of appraiser A more than one reading is outside the control limits which indicate the method is different from others. Figure 2 (d) represents the R-chart of appraiser B all the readings are within the control limits.
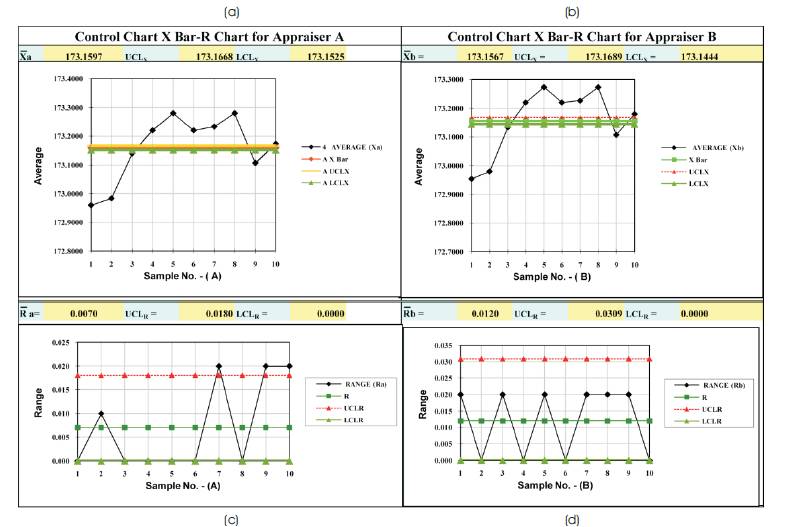
Figure 1. Control Charts of Appraisers A& B
Figure 2 shows the combined control charts of appraiser for C & A, B, C. Figure 2 (a & b), charts of appraiser C & A, B, C combined indicates more than 50% of the readings are outside the control limits which indicates Measurement system is adequate enough to capture process variation. Figures 2 (c & d) are R charts of appraiser C & A, B, C combined which indicates all readings are within the control limits.
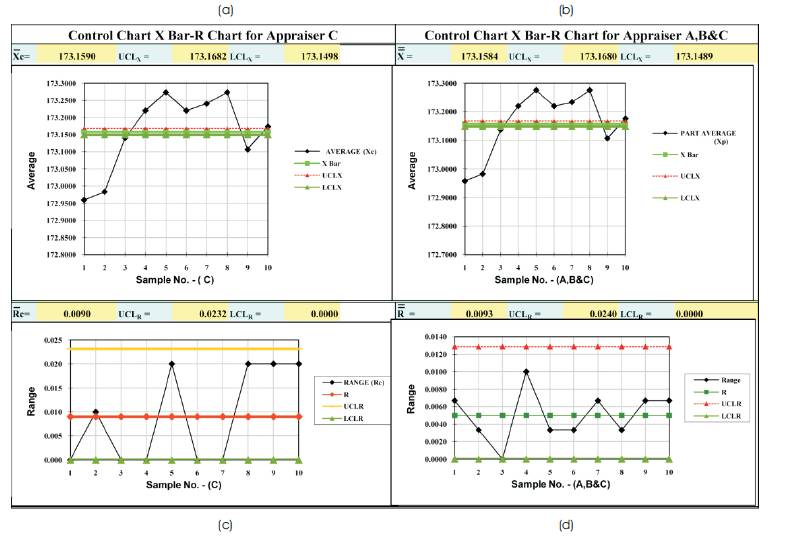
Figure 2. Control Charts of Appraisers C & A, B & C (combined)

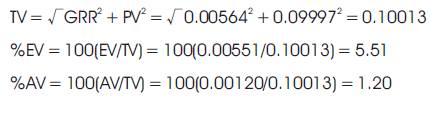
Since the value of % GRR (5.64) < 10 %, the measuring instrument i.e, Dial gauge with 10 microns L.C is acceptable.
D4 = 2.58 (for 3 trails); K3 = 0.3146 (for 10 parts); K2 = 0.5231 (for 3 appraisers); Kt = 0.5908 (for 3 trails)

For - chart:
For R-chart:
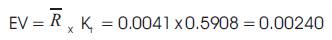
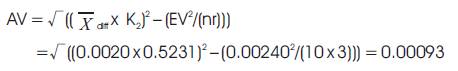
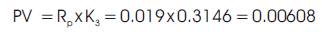
Calculations of GRR sheet for collar width is represented in Table 2.
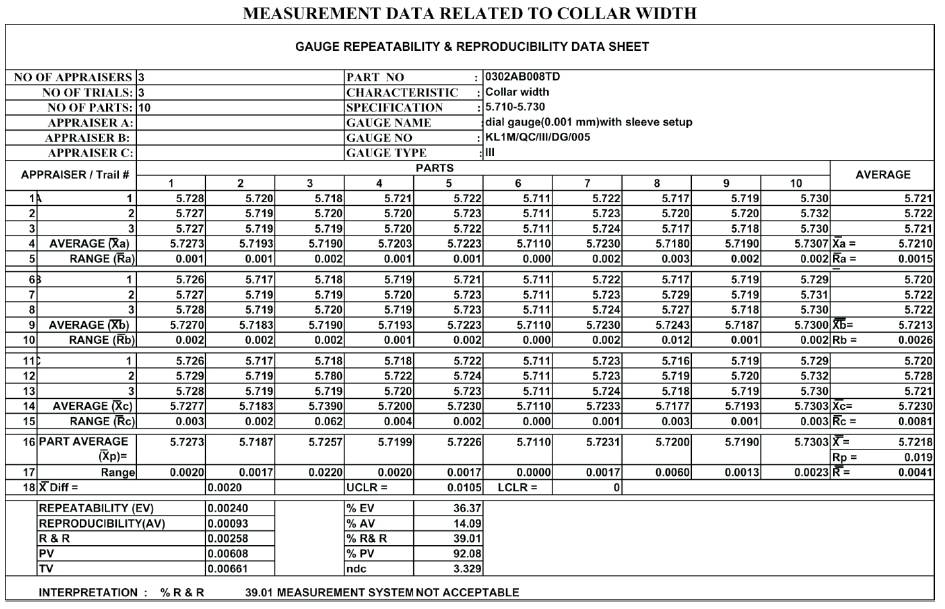
Table 2. Calculations for GRR sheet for Collar Width
Figures 3 (a & b) represents charts of appraisers A & B which indicates less than 50 % of the readings are outside the control limits as a result Measurement system is not adequate enough to capture process variation. Figure 3 (c) indicates all readings within the control limits. Where as Figure 3 (d) indicates one reading outside the UCL which indicates measurement system is sensitive to appraisers skill.
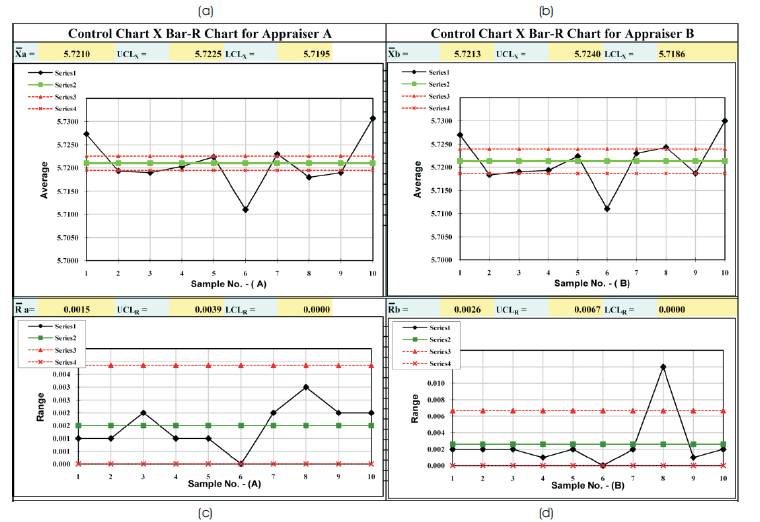
Figure 3. Control Charts of Appraisers A& B
Figures 4 (a & b) represents chart of appraisers C & A, B, C combined which indicates less than 50 % of the readings are outside the control limits as a result Measurement system is not adequate enough to capture process variation. Figure 4 (c & d) indicates one reading outside the UCL which indicates measurement system is sensitive to appraisers skill.
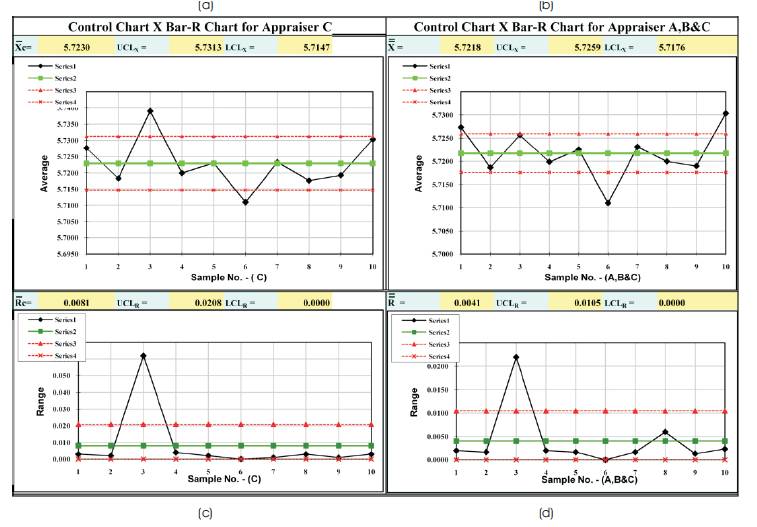
Figure 4. Control Charts of Appraisers C & A, B &C (combined)

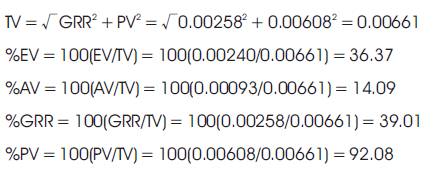
Since, the value of % GRR (39.01) >10 %, the measuring instrument i.e Dial gauge (L.C- 1 micron) with Sleeve setup is not acceptable.
Hence, the authors replace the measuring instrument with a DRO (Digital Read Out) and studied the GRR characteristics on collar width parameter.
A Digital Read Out (DRO) is a small computer (display unit) usually with an integrated keyboard and some means of numeric representation. It reads the signals generated by the linear encoder (or less frequently by rotary encoders) installed to several work piece axes, using them to keep track of work piece position and hence the collar width is identified which is given as the distance between its probes. The probes of a DRO are usually made of high grade materials which are less prone to wear unlike the case with slip gauges. The specifications within which the value should lie is pre fed to the DRO. If the collar width (read in terms of distance between 2 probes that touch the collar on either side) does not lie within the specification, a red light flashes providing information that it has to be reworked or rejected. Flashing of green light symbolizes that the collar width is within the specification. The collar width is displayed on the numerical display. This eliminates the need to employ a highly skilled worker for measurement. In this method, the most frequent parallax error while making a reading is also eliminated. Table 3 shows the calculations for GRR Sheet for collar with DRO.
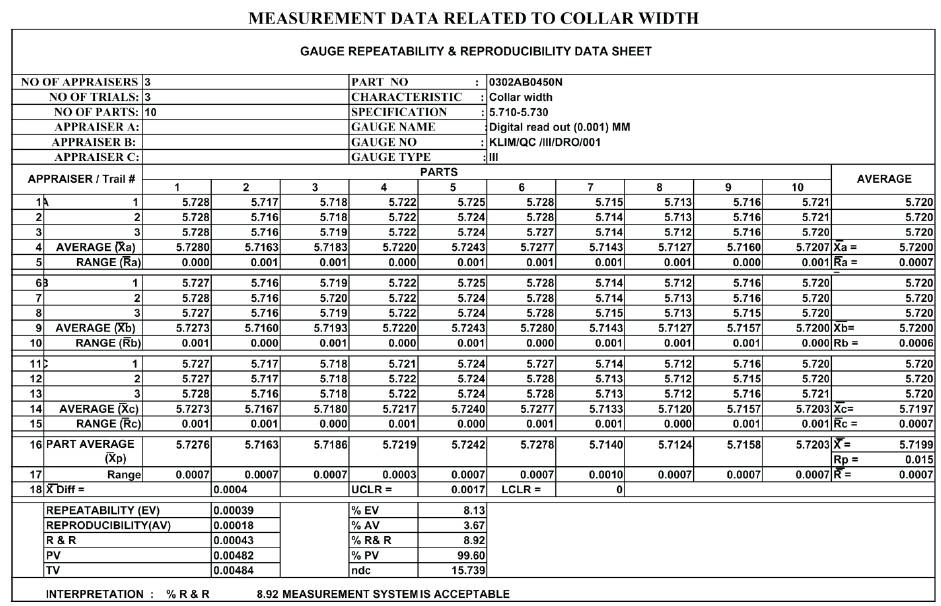
Table 3. Calculations for GRR sheet for Collar width with DRO
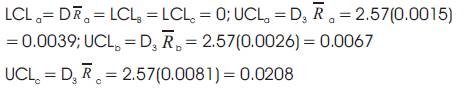
D4 = 2.58 (for 3 trails); K3 = 0.3146 (for 10 parts); K2 = 0.5231 (for 3 appraisers); Kt = 0.5908 (for 3 trails)

For - chart:
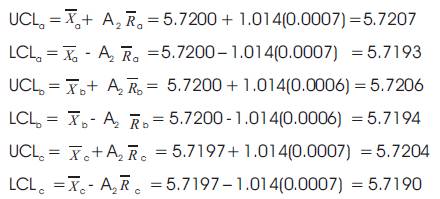
For R-chart:
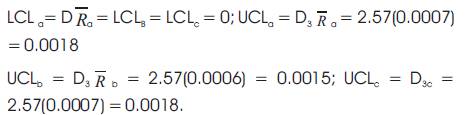
Figure 5 (a & b) represent the charts of A & B indicates the process average is not within the limits and Figure 5 (c & d) represents the R Charts of A& B which indicates the process dispersion or variability is within the control limits.
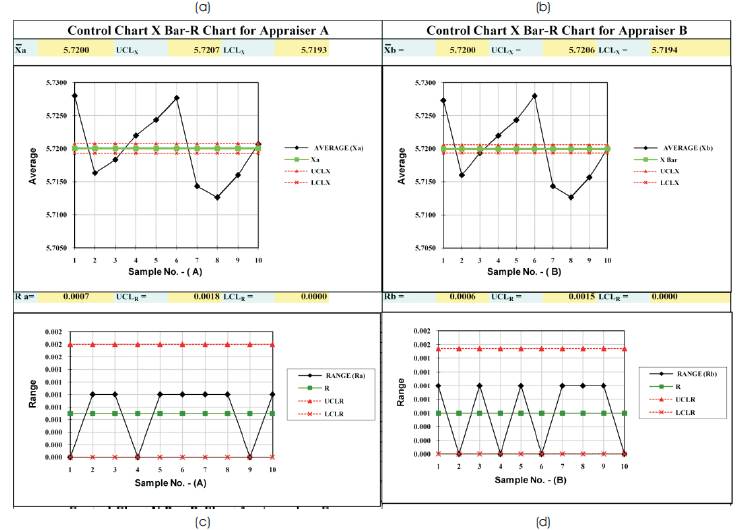
Figure 5. Control Charts of Appraisers A& B
Figure 6 (a & b) represent the charts of C & A, B, C indicates the process average is not within the limits and Figure 6 (c & d) represents the R Charts of C & A, B, C which indicates the process dispersion or variability is within the control limits.
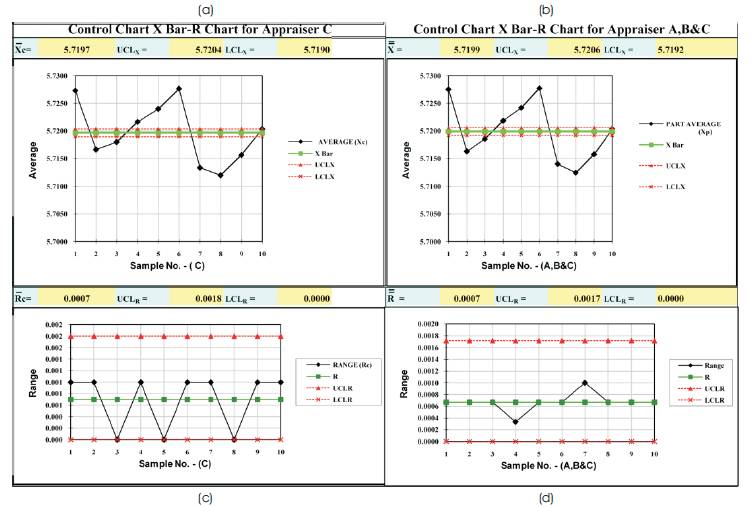
Figure 6. Control Charts of Appraisers C & A, B &C (combined)
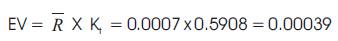
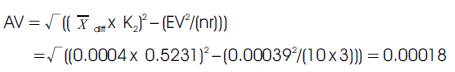


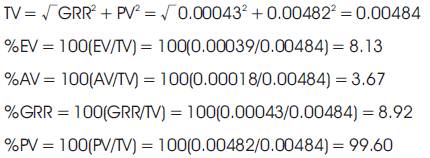
Since the value of % GRR (8.92) < 10 %, the measuring instrument i.e DRO unit is acceptable.
In the present work, some of the critical parameters (which when not maintained properly renders the product useless) of liners and the corresponding measuring instruments are evaluated for validity. The prevailing measuring instruments corresponding to the measurement of critical parameters are taken into consideration and the gage characteristics- Repeatability, Reproducibility (R&R), their combined factor is evaluated by means of suitable formulae and the possible variations among part, appraiser, instrument are studied with the help of control charts ( chart and R chart in this study). If the values of the above mentioned parameters do not lie within the required limits, the measuring system is said to provide unreliable data and hence is considered to be not acceptable. Suitable correction methods (like changing of measuring instrument etc) are adopted and the same procedure is repeated in order to judge the validity of the new system. This study revealed that GRR value for dial gauges, ball micrometer, air gauges used to measure Total length are in permissible limits and hence the measuring instruments are accepted. Whereas the GRR value for dial gauge with sleeve setup to measure collar width is 39% and hence is not accepted.
The measurement system is replaced by a DRO unit and the process is again repeated. The GRR value for this arrangement is 8.92% which is acceptable. Hence a useful modification is made in the measuring system which otherwise would have rendered the measurement system useless. The study of gauge R&R technique is important to evaluate data in any field. Once if the study is conducted for the measuring system, it can be highly relied upon without having fear for the quality of data.
From the present work, the authors have understood that evaluation and validation of measuring system is very much important and essential depending on which key decisions like change in process or modification in process takes place. The study of gauge R&R technique can be applied to any kind of data related to any manufacturing concern. Once if this study is conducted for the measuring system, the data obtained from that valid measuring system can be highly relied upon.