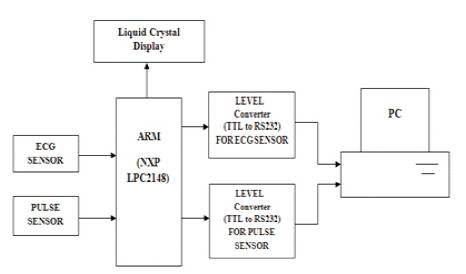
Figure 1. Block Diagram of Heart Rate Analysis
This paper deals with the diagnosis and analysis of heart rate using Pulse sensor. Heart rate of a human body can be measured by considering the change of blood volume in fingertip with the help of microcontroller based methods. This method detects the volume change of blood by an optical sensor based on infrared technology. The main objective of this pulse sensor is to use Optical methodology to detect the blood flow through the index finger and offer the advantage of portability. The principle of Pulse sensor is that certain amount of light energy from infrared will be absorbed by blood cells and the remaining amount of light will be transmitted to the photodiode. Based on the amount of light transmitted, the flow of blood can be calculated, which is directly related to pulse rate. Advance Rise Machines (ARM) Microcontroller (LPC2148) is programmed to count the pulse and to display the heart rate digitally on an LCD. Peak detection algorithm plays an important role in diagnosing heart related diseases by comparing the pulse signal and the ECG signal using VB.NET tool.
Changes in lifestyle and unhealthy eating habits have resulted in dramatic increase of heart and vascular diseases. Furthermore, heart problems are being increasingly diagnosed on younger patients. Heart rate indicates the soundness of heart and helps to assess the condition of cardiovascular system. In clinical environment, heart rate is measured under controlled conditions like blood measurement, heart voice measurement, and Electrocardiogram (ECG). Heart rate means the number of heart beats per unit of time, usually expressed as beats per minute (bpm). Heart rate measurement is one of the very important parameters of the human cardiovascular system. The heart rate of a healthy adult at rest is around 72 beats per minute (bpm). Babies have a much higher heart rate at around 120 bpm, while older children have heart rates at around 90 bpm. The rate when the pulse returns to normal is an indication of the fitness of the person. Lower than normal heart rates are usually an indication of a condition known as Bradycardia, while higher than normal heart rates are known as Tachycardia. There is a great need for patients to be able to measure the heart rate in home environment. The Heart Rate Measuring (HRM) devices employ electrical and optical methods as means of detecting and acquiring heart signals. To make the device portable, a Pulse sensor is used to measure the blood flow so that the electrical probes can be replaced.
Sensors play an important role in measuring physical parameters such as pressure, temperature, oxygen saturation level in blood etc. C. Hlenschi, S. Corodeanu, and H. Chiriac (2013) have proposed the magneto elastic sensor. The magneto elastic sensor is used to respond to changes in the ambient, which has resulted in many applications involving detection and measurement of pressure, temperature, heart rate [1] etc and also the sensor system is sensitive to all changes in blood volume including respiration and vasomodulation even though they will also include disturbances which are likely due to variations in the lower pressure venous blood volume [2]. To get the most accurate results with the heart rate sensor it is best to measure the pulse at the finger tip [3]. Motion artifact is an issue for a pulse oximeter, especially in reflectance mode [4]. So transmission type pulse sensor is used in this paper. The peripheral vascular diagnostics has been designed by combining the pulse spectroscopy and advanced signal processing [5, 6] which implies that the improvement of heartbeat detection has been achieved in time frequency representation as proposed by Sebastijan Sprager and Damjan Zazula [7]. Thus the pulse signal is analyzed using a Fast Fourier Tranform (FFT) to calibrate the signals for better accuracy [8]. Primary advantage is the very low driving currents for LEDs [9, 10]. The accuracy, noise suppression, and cost effectiveness of the system makes it a suitable low cost computer based heart monitoring system to study and detect heart diseases like sleep arrhythmia [11, 12]. In this paper, the authors have proposes a computer based heart rate measurement system by optically sensing the alteration of blood volume flowing through finger arteries.
HRM measures the pulse rate through changes of blood flow through the index finger. Each pulse of blood from heart increases the density of blood in the finger pulsatile tissue and causes a decrease in light power received by the photodiode. The photodiode does not pick up a purely AC signal as there are some DC components received from other non-pulsatile tissues and ambient light levels. The varying light levels received are converted into a varying resistance in the photodiode. The varying resistance is converted into a varying voltage by using a resistance network and power source. The device provides an accurate reading of the heart rate using optical technology. The signal (analog) originally was too small to detect, and without amplification proved to be too noisy to extract the heart rate. After amplifying, the signal was fed to the comparator, resulting in output in the form of pulses. The signal in the form of pulses is interfaced with microcontroller through its digital port for further processing. The Microcontroller is the heart of the circuit. Block diagram of heart rate analysis is shown in Figure 1.
Figure 1. Block Diagram of Heart Rate Analysis
The proposed work is done using ARM microcontroller. The ARM Microcontroller (LPC2148) is programmed to acquire the signal using its embedded analog to digital converter (10-bit ADC), and the readings are used to compute the heart rate; eventually, the heart rate is digitally displayed on an LCD (2X16 LCD). The data is sent to PC using serial port and thus analysis of heart rate is done using VB.NET tool. Analysis is made by using Peak detection algorithm. Features obtained from the detected peaks are helpful to detect some heart disease or certain cardiac condition.
The sensor circuit consists of two parts: emitter and receiver diodes. Its emitter is built with an infrared LED (TLN201) that transmits infrared rays through the fingertip vessels of the human body. A part of the signal is absorbed by the blood cells where the amount of transmitted signal will depend on change in blood volume and is correlated with the heart rate. The transmitted signal, which carries information about blood volume, is detected by the receiver circuit through a photodiode sensor (TPS601A). Here the photodiode converts the optical pulses to electrical pulses containing information about changing blood volume and heart rate. The circuit is powered with a 5V regulated bias supply.
The device uses noninvasive infrared light to probe pulse rate in a finger tip. In the transmission type, the emitter and detector are placed on opposite sides of tissue as shown in Figure 2. The LED emits infrared light to the finger of the subject. The photo diode detects this light beam and measures the change of blood volume through the fingertip. The signal from the finger is converted to voltage and the signal will get amplified by using op-amp ICLM358. Signal from the fingertip will enter to the non-inverting input (pin 3). The output from pin 3 will enter to pin 5 which acts for squaring and amplification. The pin 7 of LM358 provided the heart beat signal and as an input for the ARM Microcontroller.
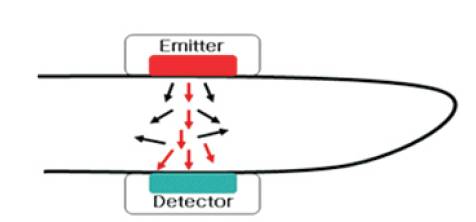
Figure 2. Transmission Type Pulse Sensor
ECG is primarily a tool for examination of cardiac diseases. An ECG sensing device commonly consists of a group of electrodes to detect electrical events of a heart. The ECG is the electrical manifestation of the contractile activity of the heart, and can be recorded fairly easily with surface electrodes on the limbs or chest. The rhythm of the heart in terms of beats per minute (bpm) may be easily estimated by counting the readily identifiable waves. The amplifier takes the input from 3 electrodes which are connected to the patient as given in Table 1 and the sensor is shown in Figure 3.
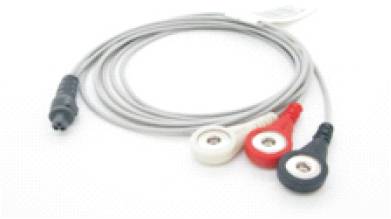
Figure 3. ECG Sensor
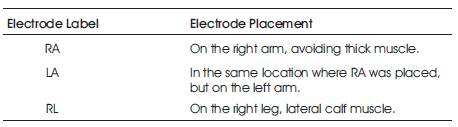
Table 1. Placement of Electrodes
The hardware model is shown in Figure 4. It consists of sensor module and controller module. For the calculation of heart rate for an individual subject, it is necessary to know number of pulses per minute as an indicator of the rate at which heart pumps blood by periodic contraction and expansion. The data from the fingertip is collected initially for intervals of thirty seconds in duration. The Microcontroller LPC2148 was selected due to its additional output and processing power, and also its onboard 10-bit analog to digital converter and in-circuit debugging features. Using this highly integrated microcontroller allowed for a simpler design and trouble shooting debugging process. Due to the use of a microcontroller to calculate the beats per minute (bpm), it was decided that a Liquid Crystal Display (LCD) module would be the most flexible way of displaying this numerical output. Peak value is also displayed simultaneously based on the blood flow in the finger between LED and Photodiode.
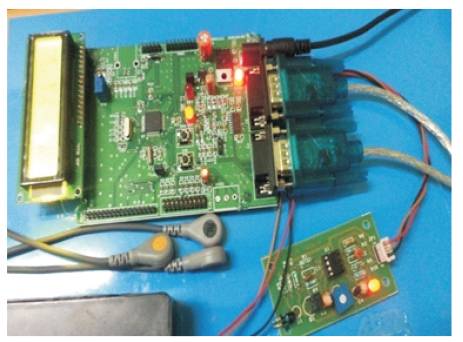
Figure 4. Hardware prototype of the Heart rate measuring device
The term "Heart Diseases" refers to diseases occurring in the heart and also in the blood flow system within the heart. There are more than 50 different types, and the most common type that affects the electrical system is known as arrhythmias.
Cardiac Arrhytmia (also dysrhythmia) is a term for any of a large and heterogeneous group of condition in which there is abnormal electrical activity in the heart. The heart beat may be too fast or too slow, and may be regular or irregular.
These kinds of heart disease include the following types:
Heart rate that exceeds the normal beat range is called tachycardia. A heart rate that exceeds 100 beats per minute is usually accepted as Tachycardia.
The resting heart rate of fewer than 60 beats per minute is called Bradycardia.
In this paper, a new mathematical Peak Detection algorithm was developed using VB.NET, where new parameters are extracted from the Pulse signal and are used as input to the algorithm.
The basic task of ECG signal processing is Peak detection. There are some difficulties one can encounter in processing ECG:
So inorder to compare this signal with the pulse signal, peak detection algorithm is used which is applied to both the signals extracted from the hardware as shown in Figure 5.
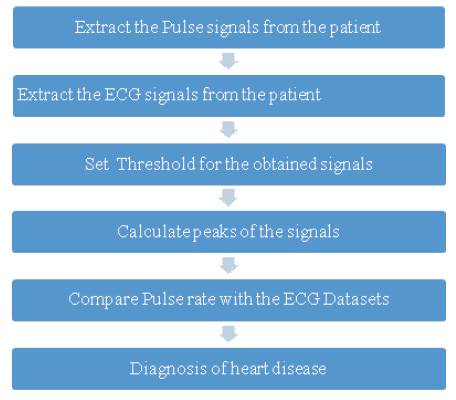
Figure 5. Flowchart of Peak Detection Algorithm
By using the peak detection algorithm, the first step is to extract pulse and ECG signal from the hardware through serial port and to set threshold based on the digital values of both the sensed signals as shown in Figure 6.
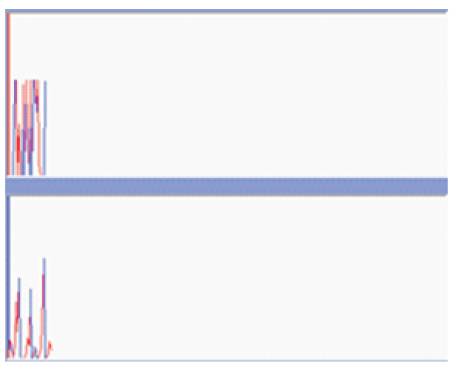
Figure 6. Extraction of Pulse and ECG Signal
The second step is to calculate the peak values and to compute heart rate of the patient for the obtained signals as shown in Figure 7.
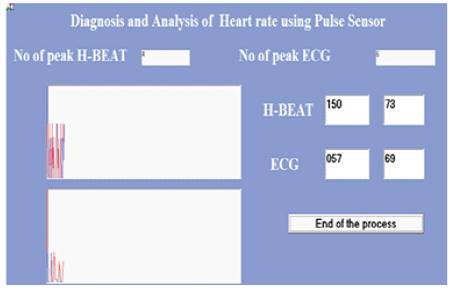
Figure 7. Simulation Result for Subject 1
By using VB.NET tool peak detection of the pulse and the ECG signal takes place and displays the computed heart rate of the subject based on the peak values of the signal.
Number of Peaks displayed for both the pulse and the ECG signal is shown in Figure 7 and the corresponding pulse rate and heart rate from the ECG signal also gets displayed. For subject 1 the simulation results are shown in Figure 7.
By using this device, pulse rate and the ECG heart rate is calculated for 10 subjects and the values are compared based on the error rate which is shown in Table 2.
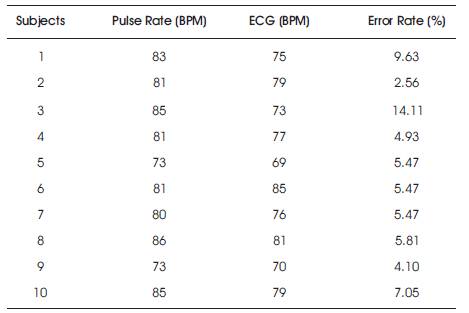
Table 2. Accuracy Comparison with ECG
Error rate calculation is denoted by the formula given as follows.

Where,
P is the Pulse rate (BPM)
E is the Electrocardiogram HR (BPM)
The comparative analysis is represented by Figure 8.
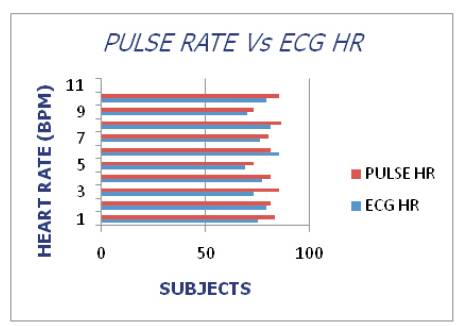
Figure 8. Comparative Analysis
From the analysis made by using the device, it is made clear that the heart rate of the normal person is between 60 to 100 bpm. So when the heart beat goes too slowly and it is less than 60 bpm it shows that the person is affected by Bradycardia and when the heart beat goes too fast and it is greater than 100 bpm it shows that the person is affected by Tachycardia.
Heart rate (HR) is an important indicator of health and low resting heart rate may indicate that the body is in better condition. Heart rate is typically measured from ECG signals or using microcontroller based systems. In this paper, the design and development of a low cost heart rate measuring device has been presented. The device is ergonomic, portable and cost effective. The HRM device is efficient and easy to use. Also this paper elaborated and discussed the analysis of the Heart rate using pulse sensor. Sensor selection, interfacing and signal analysis are mainly discussed. The device has the advantage that it can be used by non-professional people at home to measure the heart rate easily and safely. The device could be further developed into a continuously monitoring device that could be used to detect the heart beat anomalies associated with certain heart conditions. This would be made possible by analyzing the heartbeat signal using Peak detection algorithm using VB.NET tool. The future work of this proposed system is that the signal analysis can be made by using signal processing methods and the results can be compared with the ECG signal such that the disease can be diagnosed efficiently.