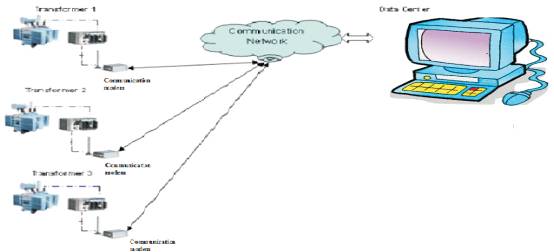
Figure 1. A Closed Loop Transformer Monitoring Using Virtual Instrumentation
This paper proposes a new concept for monitoring the remote electrical parameters like voltage, current, oil temperature, oil level, active power, reactive power, apparent power, power factor of a remotely located distribution transformer and to transmit it over a communication network and these real time values are displayed using Virtual Instrumentation platform on the PC which is located at the Substation. In addition, it will protect the distribution transformers from various faults like over current and over voltage. Distribution transformers which are the critical components in power distribution systems are located on the feeders of the substation and monitoring of which is a long time need and there is no proper medium for it.
Electricity is an extremely handy and useful form of energy. It plays an ever growing role in our modern industrialized society. The electrical power systems are highly non-linear, extremely huge and complex networks. Such electric power systems are unified for economical benefits, increased reliability and operational advantages. They are one of the most significant elements of both national and global infrastructure, and when these systems collapse it leads to major direct and indirect impacts on the economy and national security. A power system consists of components such as generators, lines, transformers, loads, switches and compensators. However, a widely dispersed power sources and loads are the general configuration of modern power systems [1]. Electric power systems can be divided into two sub-systems, namely, transmission systems and distribution systems. The main process of a transmission system is to transfer electric power from electric generators to customer area, whereas a distribution system provides an ultimate link between high voltage transmission systems and consumer services. In other words, the power is distributed to different customers from the distribution system through feeders, distributors and service mains. Supplying electricity to consumers necessitates power generation, transmission, and distribution. Initially electric power is generated by using electric generators such as: nuclear power generators, thermal power generators and hydraulic power generators and then transmitted through transmission systems using high voltage. Power departs from the generator and enters into a transmission substation, where huge transformers convert the generator's voltage to extremely high voltages (155kV to 765 kV) for long-distance (up to about 300 miles) transmission. Then, the voltage level is reduced using transformers and power is transferred to customers through electric power distribution systems. Power starts from the transmission grid at distribution substations where the voltage is stepped-down (typically to less than 10kV) and carried by smaller distribution lines to supply commercial, residential, and industrial users. Novel electric power systems encompassing of power transmission and distribution grids consist of copious number of distributed, autonomously managed, capital-intensive assets. Such assets comprise: 1.) power plants, 2.) transmission lines, 3.) transformers, and 4.) protection equipment [2]. Electric utility substations are used in both the transmission and distribution system and operate independently to generate the electricity. A typical substation facility consists of a small building with a fenced-in yard that contains transformers, switches, voltage regulators, and metering equipment that are used to adjust voltages and monitor circuits. A reliable and efficient process of these networks alone is not very significant when these electricity systems are pressed to their parameters of its performance, but also under regular operating conditions. Generators and loads are some components that coerce the continuous dynamic behaviour. The distance between the Generators and loads may be in terms of hundreds of miles. Hence, the amount of huge power exchanges over long distances has turned out as a result of the lack of quality of the electric power. Therefore, measurements must be acquired either from one end or from both the ends of a faulted line. Only meager recorded data is available at limited substation locations in certain systems. When a fault occurs in such systems, only a few (two or three) recording devices are triggered. The most likely case is that the measurements could not be obtained at either or both ends of the faulted transmission line leading to drop in the quality of the power.
To improve the quality of power with sufficient solutions, it is necessary to be familiar with what sort of constraint has occurred. Additionally, if there is any inadequacy in the protection, monitoring and control of a power system, the system might become unstable. Therefore, it necessitates a monitoring system that is able to automatically detect, monitor, typify and classify the existing constraints on electrical lines. This brings up advantages to both end users and utility companies [2]. Monitoring systems offer an opportunity to record each and every relevant value that is present in a local database. An effective and wellorganized state of monitoring is much significant in guaranteeing the safe running of power transformers. Potential breakdown of the power transformers can be recognized in their incipient phases of development by an excellent state of monitoring so that the maintenance of the power transformers can be condition based in addition to periodically scheduled [3].
During the past years a number of researches have been done with the help of microprocessors and controllers for continuous monitoring of sample concentrations, the behaviour of analysts at different time intervals, monitoring the voltage, current and temperature fluctuations in the distribution transformers. The level of current and voltage may vary drastically due to the increase in temperature at the distribution transformers. Due to this the quality of power being delivered to the user might be insufficient. Hence monitoring the current, voltage and additionally required parameters at the distribution side can aid in developing both the output generated at the main station and the quality of power being delivered at the customer side. It is also capable of recognizing the break downs caused due to overload, high temperature and over voltage. If the increase in current rises higher than the desirable temperature, the monitoring system will protect the distribution transformer by shutting down the unit.
As discussed earlier, maintenance of a distribution transformer is one of the biggest problems in the Electricity Board (During strange events for some reasons the transformer is burned out due to the over load and short circuit in their winding). Also the oil temperature is increased due to the increase in the level of current flowing through their internal windings. This results in an unexpected raise in voltage, current or temperature in the distribution transformer.
LabVIEW is a powerful platform for algorithm development, design, prototyping, and interfacing of embedded system with real-world hardware. LabVIEW uses graphical language (G) that enables the creation of programs in block-diagram form, which are called virtual instruments (VI). The main executable program is called the top-level VI and the programs used as modular subroutines are called sub VIs. Every VI consists of two main components, the graphical user interface that is named front panel; and the graphical code that implements the functionality of the VI, called block diagram. Once a VI is created and saved, it can be used as a sub VI in the block diagram of another VI, acting as a subroutine (Gan & Kuo, 2007; Oussalah & Djezzar, 2010; Sumathi & Surekha, 2007).The front panel contains objects known as controls and indicators. Controls are the inputs that provide data to the block diagram, and indicators shows output data from the block diagram. The objects, such as buttons, switches, LEDs and graphs are selected from the controls palette. Front panel controls and indicators have a corresponding terminal block on the block diagram, which holds the graphical source code that defines how the VI will operate.
A block diagram is built with terminals and nodes available in the functions palette and that are connected by wires. The block diagram code executes based on the principle of dataflow. The rule of dataflow states that functions execute only when all of their required inputs are populated with data. This programming architecture allows both sequential and parallel execution to be easily defined graphically. When a node completes execution, it supplies data to its output terminals on the right, and follows the dataflow imposed by the wires connecting the block diagram objects (Gan & Kuo, 2007; Sumathi & Surekha, 2007).
Figure 1 shows the closed loop transformer monitoring system using Virtual Instrumentation The proposed system is used for the monitoring of the remotely located distribution transformer. The electrical parameters like voltage, current, active power, reactive power, power factor, oil level and oil temperature are monitored continuously and these real time values are transmitted using a communication medium and are displayed using virtual instrumentation platform on the PC which is at the substation [4].Various sensors are used for getting the electrical parameters and these datas are fed to the NI DAQ and these datas are controlled and displayed using virtual instrumentation platform. The LabVIEW program will activate the controllers and which in turn will activate the necessary relays if any of the electrical parameters exceeds it specified value.
Figure 1. A Closed Loop Transformer Monitoring Using Virtual Instrumentation
The proposed Closed loop Transformer Monitoring System is simulated using virtual instrumentation platform and the parameters are monitored and transmitted using GSM. The electrical parameters like voltage, current, oil temperature, oil level are fed as inputs. VISA a tool used for serially reading, writing and transmitting the datas through it and sends as SMS to the number which is already specified. The Figure 2 shows the Front panel for the closed loop transformer monitoring system using Virtual Instrumentation. The Figure 3.shows the block diagram representation of the Closed Loop Transformer Monitoring system using Virtual instrumentation. The Figure 4 shows the block diagram representation of Closed loop Transformer Monitoring System.
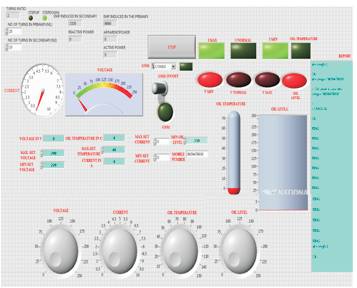
Figure 2. Front panel for a Closed Loop Transformer Monitoring Using Virtual Instrumentation
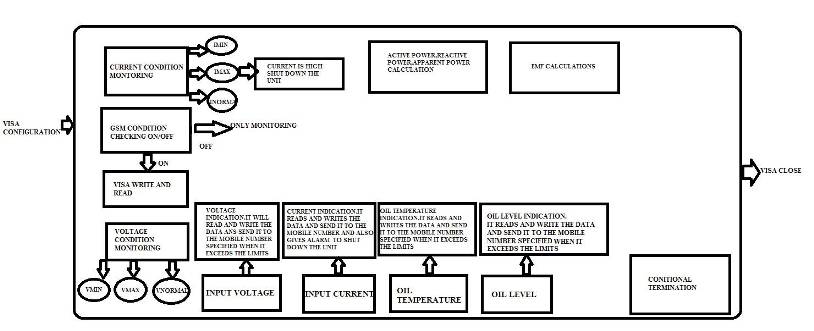
Figure 3. Block diagram representation for a Closed Loop Transformer Monitoring Using Virtual Instrumentation
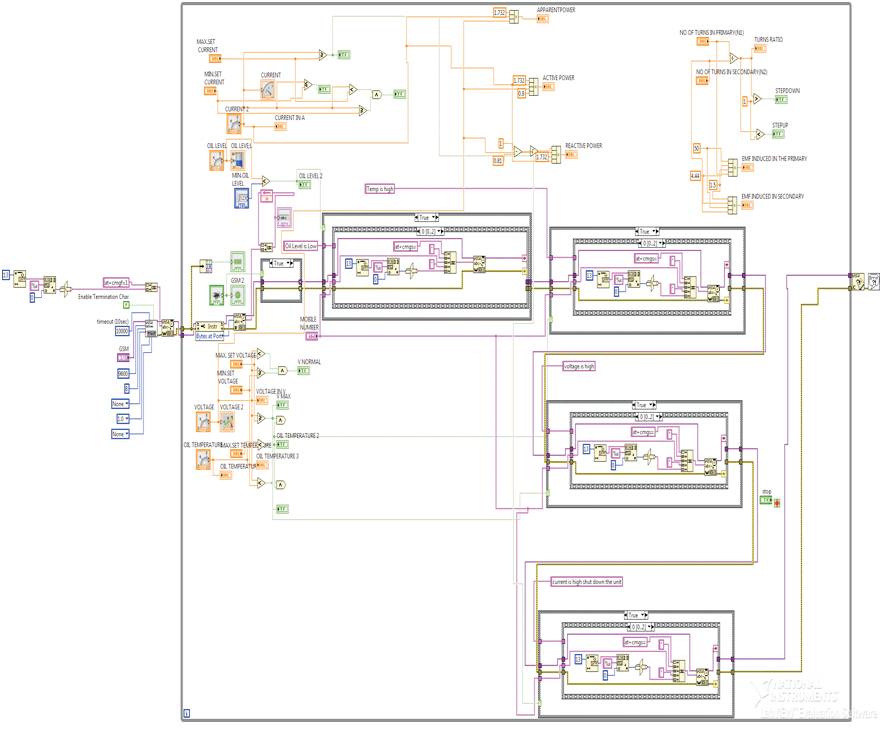
Figure 4. Block Diagram for a Closed Loop Transformer Monitoring Using Virtual Instrumentation
The SMS technology evolved from the GSM standard in the early 90's. It is currently available in the entire GSM network and can be accessed by practically every cell phone. The service enables the user to send messages with the maximum length of 160 or 140 characters when using 7-bit or 8-bit encoding, respectively. The system can segment messages that exceed the maximum length into shorter messages. In this case, it must use part of the payload for a user-defined header that specifies the segment sequence information. When a text message is sent from a user to another, the phone actually sends it to a short message service center (SMSC), where the message is stored and delivered when the recipient is on the network. Namely, it is a store-and-forward operation. In this paradigm, the system keeps resending the message for some period of time until it is successfully received. The SMSC usually has a configurable time limit for how long it will store the message, and be able to resend it in case of failure in the previous attempts. Messages can be sent using text mode or protocol data unit (PDU). The text mode is a characterbased protocol and it is the simplest mode to send messages, suitable for unintelligent terminals. The PDU may contain control information, address information, or data, i.e., this mode adds the convenience of binary data to be transmitted, not just characters (Peersman et al., 2000; Brown et al., 2007). In this project the exchanged messages will be composed only of ASCII characters. Therefore, the SMS text mode will be used, which, despite allowing only transmission of characters, it is simpler to work with. In this project, the GSM modem is responsible for sending and receiving text messages. It can accesses the GSM network like a mobile phone, differing in the way it is controlled, which is accomplished through AT commands.
AT or Hayes commands are a set of data stream commands for communication between computers and modems. Originally developed by Hayes Microcomputer Products in the beginning of modem communications, the AT commands became a standard for modem control. AT is the prefix for almost every command-line set; it is derived from the word “attention” and tells the modem that a request is coming. Requests can be made to accomplish a particular action, to change or query a specific parameter and they are sent to the modem through strings (Figueiredo et al., 2008; Jawarkar et al., 2007; Zhicong et al., 2008).
AT+CMGF: configures the message format; “AT+CMGF =1” sets to text mode, where the body of the message and its headers are given as separate parameters.
AT+CMGS: sends a short message from the modem to a given recipient and its syntax is AT+CMGS=<”recipient number”>, followed by the message content, and control Z is used for sending the message.
The Monitoring of the remotely located distribution transformer will lead to the increase of the quality of power delivered to the load and will protect the distribution transformers from various faults. The Closed Loop Transformer Monitoring Using Virtual Instrumentation is a viable system that protects the distribution transformer and also finds the low performance areas and improves the performance thereby enhancing the performance of the electricity distributors. It provides the protective information in the forms of alarms, notifications in the form of LEDs. This system protects the distribution transformer, and thereby uninterrupted power supply can be provided to the utility customers.