Introduction
- The economic analysis of the heaters should consider a desuperheater section when there is a high degree of superheat in the steam to the heater and an internal or external drain cooler to reduce drains below steam saturation temperature:
- Type: The feed water heaters will be of the U-tube type.
- Location: Heaters will be located to allow easy access for reading and maintaining heater instrumentation and for pulling the tube bundle or heater shell.
- High pressure heaters will be located to provide the best economic balance of high pressure feed water piping, steam piping and heater drain piping.
A HP Closed Feed water Heater has three zones:
- Desuperheating zone.
- Condensing Zone.
- Drain cooling Zone.
1. Description of the PTPS.
Panipat Thermal Power Station (PTPS) (Figure 1) has a total installed generation capacity of 1360 MW comprising of four Units of 110 MW each, two Units of 210 MW each and two Units of 250 MW each. i.e. PTPS-1, comprising of 4x110MW Units I to IV and PTPS-2 comprising of 210MW / 250MW Units V to VIII.
Plant load factor for PTPS-1 for different years is shown in Table 1.The maximum power generation is 2800 MU in the year 2003-04.
In Table 2, the power generation increase from 2003 to 2008 is shown. In the PTPS different units have different capacity for power generation. Plant load factors also increase for different power generating units.
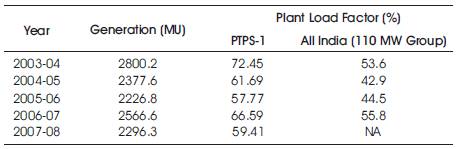
Table 1. Salient Aspects of PTPS- I
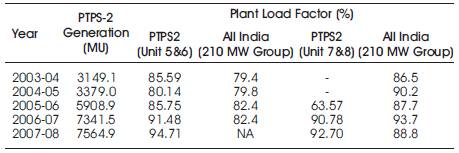
Table 2. - Salient aspects of PTPS – II
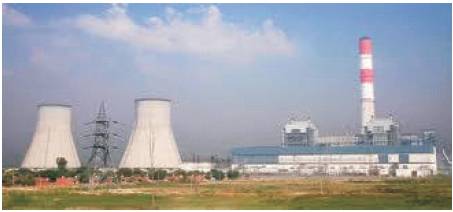
Figure1. Panipat Thermal Power Station
2. Analysis of Feed Water Heaters
2.1 LP Heater 3
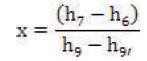
Low pressure (LP) Heater 3 is the first feed water heater in PTPS. The steam for this heater is extracted from the low pressure turbine. Also the drip of LPH4 is used to raise the feed water temperature in LPH3. The drip of LPH3 is allowed to fall into the condenser where it mixes with the condensate steam from the low pressure turbine. The mass flow diagram for LPH3 is shown Figure 2.
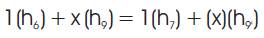
Mass balance equation for LPH3: Considering the block diagram of the plant unit, the mass balance equation can be given as:-

This gives
2.2 LP Heater 4
Low pressure (LP) Heater 4 is the second feed water heater in PTPS. The steam for this heater is extracted from the intermediate pressure turbine. Also the drip of LPH5 is used to raise the feed water temperature in LPH4. The mass flow diagram for LPH4 is shown in Figure 3.
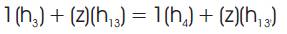
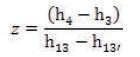
Mass balance equation for LPH4: Considering the block diagram of the plant unit the mass balance equation can be given as:-

This gives
2.3 LP Heater 5
Low pressure (LP) Heater 5 is the third feed water heater in PTPS. The steam for this heater is also extracted from the intermediate pressure turbine. No drip is used to raise the feed water temperature in LPH5. The drip of LPH5 is used in LPH4 as shown in Figure 4.
Mass balance equation for LPH5: Considering the block diagram of the plant unit, the mass balance equation can be given as:-
2.4 HP Heater 1
High pressure (HP) Heater 1 is the first high pressure feed water heater in PTPS. The steam for this heater is extracted from the intermediate pressure turbine. Also the drip of HPH2 is used to raise the feed water temperature in HPH1. The drip of HPH1 is allowed to fall in deaerator. The mass flow diagram for HPH1 is shown in Figure 5.
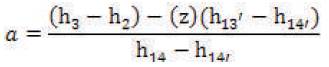
Mass balance equation for HPH1: Considering the block diagram of the plant unit, the mass balance equation can be given as:-

This gives
2.5 HP Heater 2
High pressure (HP) Heater 2 is the second high pressure feed water heater in PTPS. The steam for this heater is extracted from the CRH(Cold Reheat). No drip is used to raise the feed water temperature in HPH2. The drip of HPH2 is used in HPH1.
The mass flow diagram for HPH1 is shown in Figure 6.
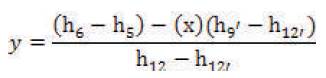
Mass balance equation for HPH2: Considering the block diagram of the plant unit the mass balance equation can be given as:-
This gives
The above analysis gives the mass flow rate in each of the heaters provided the temperature and pressure and the state of the liquid is known which is being measured from the plant. These temperatures and pressures are available in the plant both in analog and digital meters.
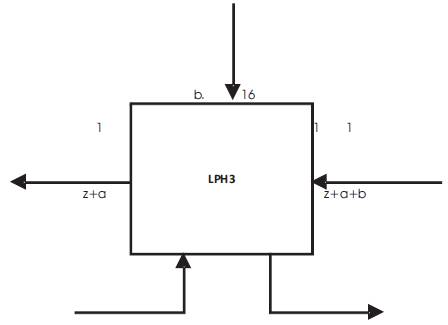
Figure 2. Mass flow diagram of LPH3
Figure 3. Mass flow diagram of LPH4
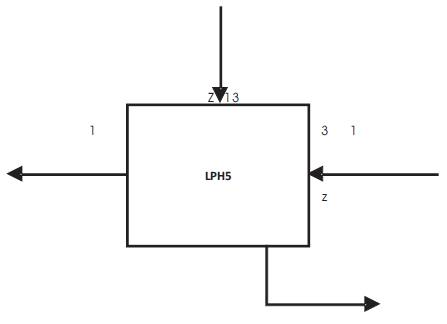
Figure 4. Mass flow diagram of LPH5
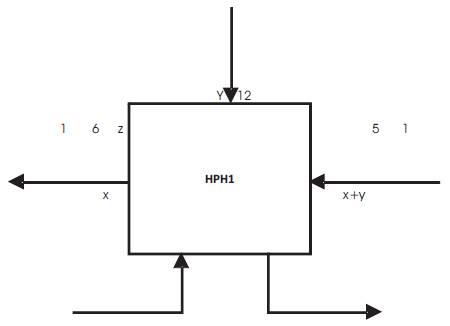
Figure 5. Mass flow diagram of HPH1

Figure 6. Mass flow diagram of HPH2
3. Work and Efficiency analysis
The work output of the plant is given by:

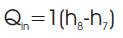
Now Qin is the amount of heat added by the furnace i.e. in the economizer, evaporator, super heater, and reheater. This can be calculated by determining the enthalpy change which is given by:
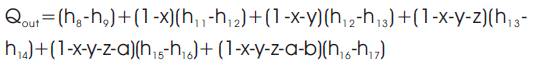
Now Qout is the amount of heat extracted i.e. expanded in the turbine and the heat energy utilized in the heat exchanger to raise the temperature of the feed water heater and the amount or heat wasted in the condenser and this is given by the equation:
This will give the work output of the plant with the help of which efficiency can be calculated as:
The values for maximum efficiency will give the optimum values of mass flow rates of the bleed steam in the feed water heaters.
4. Data Collection from Plant
The problem formulated is validated by noting certain values from the power generation plant. The plant discussed is a 110 MW capacity unit installed in Panipat Thermal Power Station. The working of the plant is studied for few days and readings are taken at different point of time.
Different reading are seen in Table 3 according to their different steam pressure, temperature, reheat pressure and temperature. Analyzing the Tables 3, and 4 shows that the minimum reheat temperature in the cycle reaches a level of 507 ̊C which is the temperature of super-heated steam.
Analyzing the Tables 3,and 4 show that the maximum temperature in the cycle reaches a level of 535 ̊C which is the temperature of super-heated steam. Also it can be seen that there is a large change in the temperature of feed water i.e. 150 ̊C due to the feed water heaters.
The Table 5 shows that the maximum pressure is 1.33 bar for 16 number heater and minimum value is 1 barin the heat exchange side and Table. 6 shows pressure(bar) at all points on the turbine side in the cycle at various steam pressure.
Graph 1 shows that the maximum efficiency obtained is 0.42 and after this the efficiency is going to decrease.
Graph 2 shows the variation between Specific work and reheat pressure. The specific work output increases up to 1038 at the pressure between 30 to 35 bars. After that there is a decrease in work output.
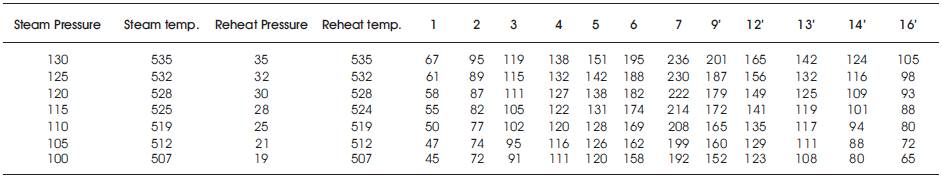
Table 3. Temperature ( ̊C ) at all points on the heat exchanger side in the cycle at various steam pressure
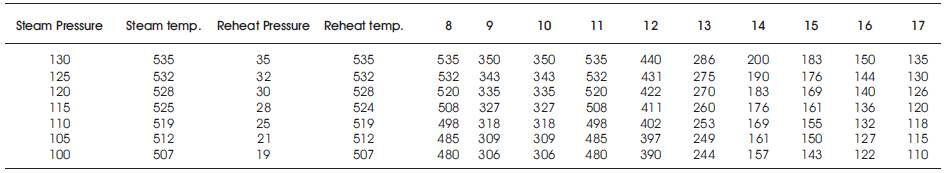
Table 4. Temperature ( ̊C ) at all points on the turbine side in the cycle at various steam pressure
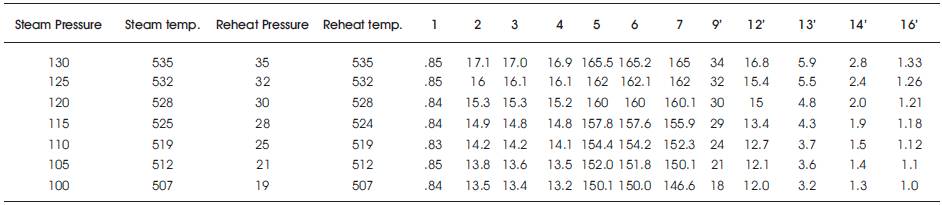
Table 5. Pressure ( bar ) at all points on the heat exchanger side in the cycle at various steam pressure
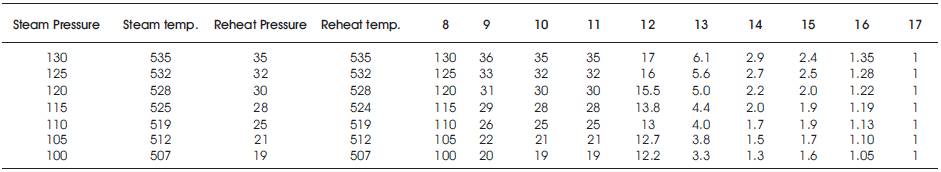
Table 6. Pressure(bar) at all points on the turbine side in the cycle at various steam pressure
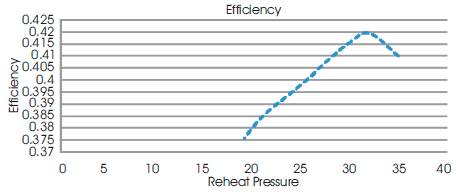
Graph 1. Efficiency Vs Reheat pressure
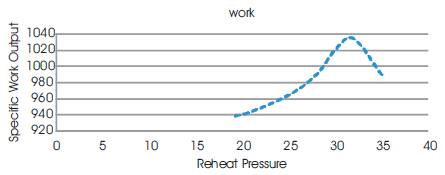
Graph 2. Specific work output Vs. Reheat pressure
5. Results and Discussion
5.1 Comparison of the results with the actual data from the Power Plant
While analyzing the Table 7 we find that in actual conditions, the figures are somewhat higher then the obtained results which give the maximum efficiency. But in the power generating unit, efforts are being made to operate the plant on the conditions given above. The difference in the mass flow rate of bleed steam extracted between the optimum conditions and the actual conditions is shown in the Graph 3.
Graph 3 shows that the difference between the two can be justified by the fact that there are various losses in the pipe lines like leakage, pressure and temperature loss due to improper insulation bends etc. and also in the heat exchangers. To overcome these losses, it becomes necessary to extract a higher amount of bleed steam than required, which there by reduces the overall efficiency to greater extent.
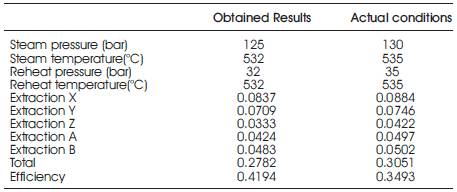
Table 7. Comparison of obtained results with the actual conditions
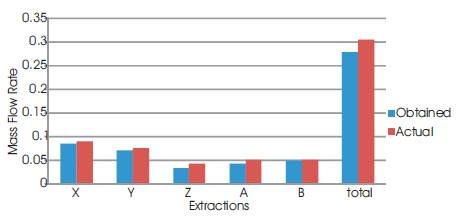
Graph 3. Comparison of Mass Flow Rate b/w Obtained and Actual
Conclusion
Analyzing the tables and the graphs, they find that the power generating unit is giving maximum efficiency and work output when the steam enters the turbine at a pressure of 125 barsand a temperature of 532 ̊C. Also the optimum amount of bleed steam extracted from the turbine at various levels required for the various feed water heaters is calculated. The maximum efficiency calculated is about 41.94%. But while comparing the obtained results from the actual data used in the thermal power plant it is found that in actual working conditions more mass of bleed steam is extracted from the turbine then the optimum results obtained. The total mass flow rate of bleed steam for all the heaters obtained by the present work is 0.2782 per unit mass flow rate of feed water, but in actual conditions the total mass flow rate of steam extracted is 0.3051 per unit mass flow rate of feed water. Also in the actual working conditions in the power plant, efforts are being made to operate the unit at the maximum temperature and pressure of about 535 ̊C and 130 bars. This is due to the fact that various temperature and pressure losses occur in the turbine, heat exchangers, pipes, bends etc. To overcome these losses, the turbine inlet temperature and pressure is kept somewhat higher than the required which reduces the plant efficiency but not more than the designed levels.
Future scope
The present work can be extended to determine the area of various losses, and efforts should be made to minimize the losses so as to improve the efficiency and work output of the plant.