Conventional energy metering system in developing country like India follows manual system which requires lots of travelling, and manual calculation of reading of electrical energy metering. This conventional metering system is highly person dependent. It doesn't give any information about energy theft as well as it is very difficult to use individual energy data for optimization of electrical energy load management as all the manual data need to be entered into the system. The proposed automated energy metering system uses GSM/ GPRS based smart energy meter which is able to transmit online electrical consumption to server periodically. It also provides energy security by providing alarming system during energy theft which is calculated based on average consumption load. In this paper, the authors describe the implementation concept of this system using LabVIEW software.
India is growing at an intense rate and it is striving to be a developed country by 2020. And hence India's power requirement would increase from present demand of 120GW to 400GW by the year 2020.This would definitely be adding more and more number of customers to the Electricity Companies. One of the hectic tasks to be performed by these companies is to go to each and every customer and take the meter readings every month. And this manual system is facing many challenges. After going through this paper, you will get the answers to the following questions.
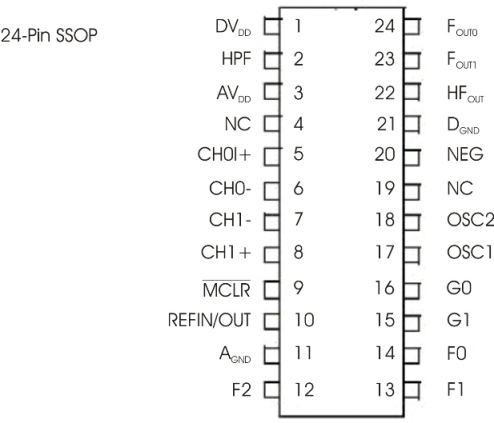
We would be doing certain modifications in current electric energy meters. We would be using MCP3905A Energy Metering IC by Microchip Company which provides us the low cost solution for getting active real power pulse output. Shunt resistor is connected to the AC load for energy sensing of lower range of currents e.g. in residential areas but for industrial area we have to use current transformer as energy sensing element. Table 1 shows the comparison between shunt resistor and current transformer. Energy metering IC MCP3905A gives instantaneous real power on HFOUT (pin 22) for meter calibration as shown in Figure 1.
Figure 1. Functional block diagram Energy Metering IC
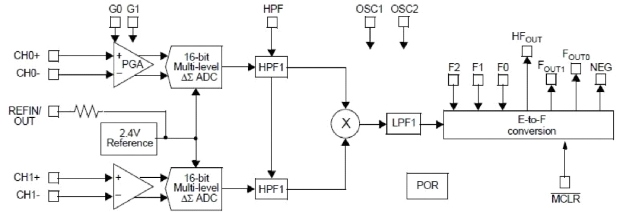
Figure 2. Functional block diagram showing the internal structure of Energy Metering IC
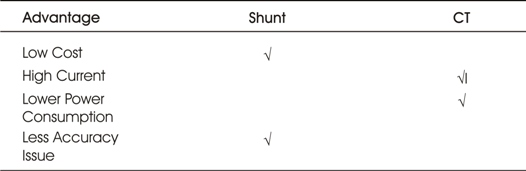
Table 1. Comparison between shunt resistor and current transformer
Hence the output from Energy Metering IC goes to the PIC16F84A Microcontroller which is programmed in such a way that it displays the Power consumption on 16*2 LCD display and another output is taken from this microcontroller which goes to the GPRS circuit. Figure 2 shows the functional block diagram of internal structure of Energy Metering IC. Depending on our requirement we can program the microcontroller to release the energy metering data to the GPRS Circuit.
Now GPRS Circuit consists of a PIC16F874A microcontroller which is powered by using IC LM7085 giving constant 5V DC supply, and GSM-GPRS Modem made by Probots is used which is ver y easy to interface with our microcontroller. GSM-GPRS Modem requires 7-15V DC/AC input for which we can use LM317 along with step down transformer for DC supply or 230V/12V Transformer for giving an AC supply.
The authors have used the popular low cost SIM300 in GSMGPRS Module. It has serial TTL interface for easy and direct interface to microcontroller. It has Power, RING and Network LEDs for easy debugging. This module also has 3V Battery Holder for Backup Purpose. This module can be controlled using TCP/IP stack. Figure 4 shows the system block diagram of implementation of GPRS System into Energy Meters.
Now the data from GPRS module goes to the central server via substation. The data from every meter goes to server at central monitoring and controlling station with the help of GSM network provided by service provider. This depends on the SIM card which we use in our GPRS module. Here they have used the SIM card of Airtel company. Now at the Central Monitoring and Controlling Station using the Labview based Web server Application, the data gets fetched. As per the graphical program in Labview the continuous monitoring of data which is received by program through server takes place. Figure 3 shows the functional block diagram of the energy metering system. This type of similar GPRS enabled energy meters are also installed at every substations which calculates the total outgoing power from the substation. Consider this power as 'B'. In the Labview program the summation of meter reading of every customers under the particular substation takes place, this reading is considered as 'A'. Now for the detection of energy theft the ratio range of 'A' and 'B' is set in the Labview program, if the actual ratio range is not matched with the preset ratio range, the error signal is generated, which indicates energy theft, excessive energy losses during transmission and distribution and increasing future energy demands. Figure 8 shows the software indicating Energy Theft. Figure 5 shows the logic behind Energy theft detection and Control System at every substation.
The control Circuit in Electric Energy meters consists of a transformer and rectifier which powers the relay. The logic signals from central station are sent to the substation via GSM network and received through GPRS module. Figure 6 shows the Control circuit of Energy. With the help of DIO NI9401 hardware present at every substation the controlling of energy meters (circuit breaking) takes place. I/O ports of DIO NI9401 can be extended by adding additional slots.
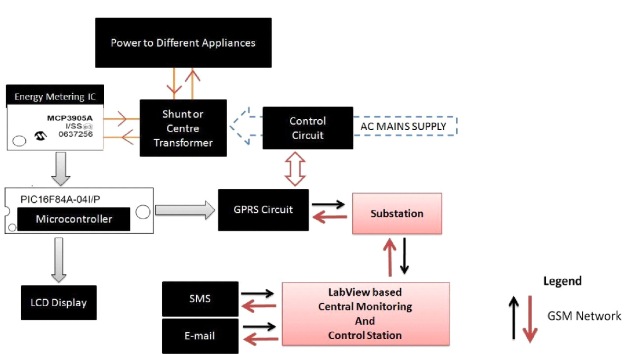
Figure 3. Functional block diagram of the energy metering system
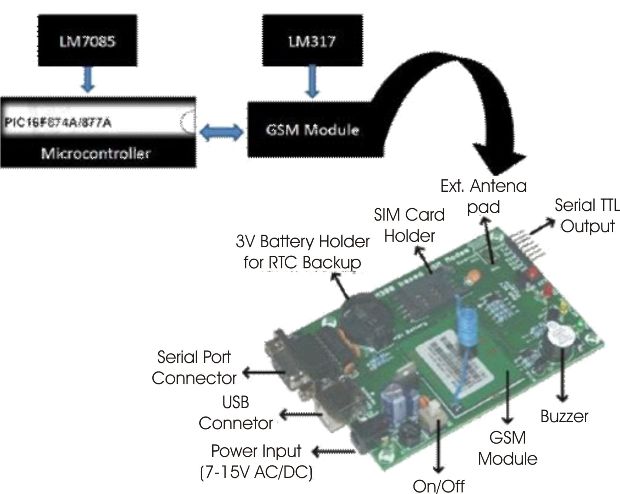
Figure 4. System block diagram of implementation of GPRS System into Energy Meters
In the program every customer's sanctioned load is set. If there is load consumption more than the sanctioned load at anytime the program would be indicating an error signal. So the electricity company could take the necessary action against such customers. Figure 7 show the Remote controlling and monitoring of individual energy meters using Labview implemented in the Gandhinagar City of Gujarat State. Figure 9 shows the software panel which reveals over loading done by the customer compared to the Sanctioned Load.
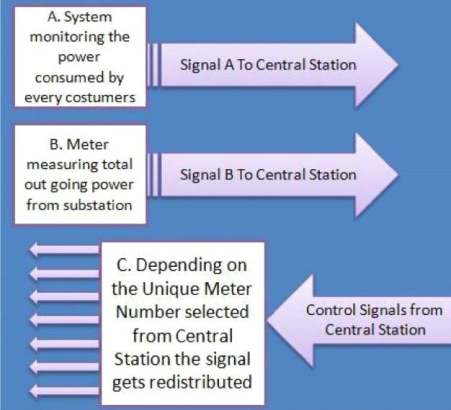
Figure 5. Diagram explaining the logic behind Energy Theft Detection and Control System at every Substations
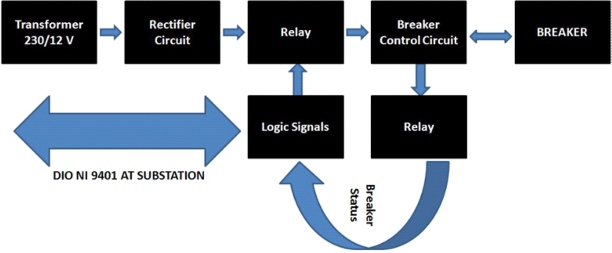
Figure 6. Control Circuit of Energy
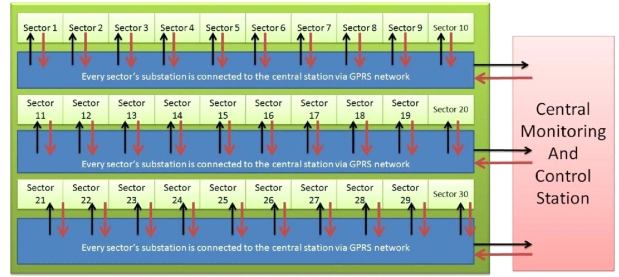
Figure 7. Remote controlling and monitoring of individual energy meters using Labview implemented in the Gandhinagar City of Gujarat State
Considering the costs of other connectors, wires, etc, it would cost approximately equal to INR 3000.
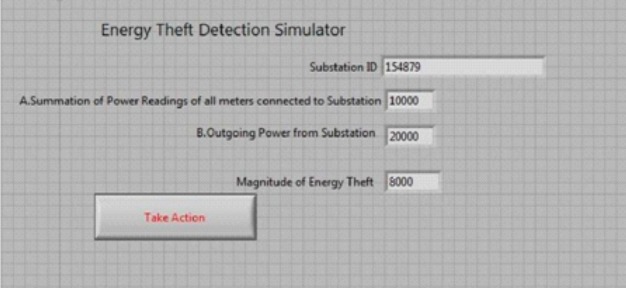
Figure 8. Software indicating Energy Theft
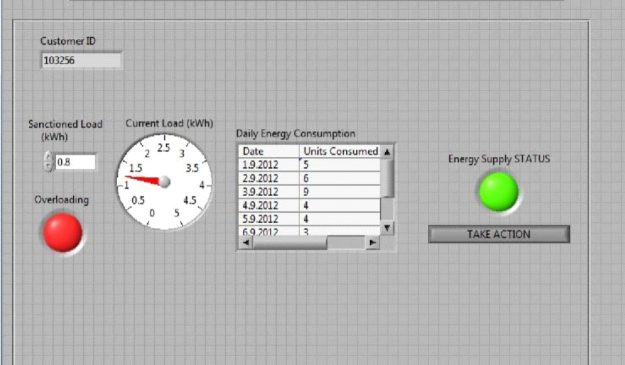
Figure 9. Software Panel Showing Overloading done by the customer compared to the Sanctioned Load
SMS and e-mail generation can be done via Labview based program which can automatically generate the monthly bills, energy usage reports, urgent notices, tips for energy saving, etc and can directly send this data to the customer.
The proposed system of remote monitoring and controlling of individual electric energy meter using Labview' has an ability to overcome all the challenges mentioned above. Here in this system with very minor modifications in the current electric energy meters, the whole system could be developed with economical feasibility. The authors have developed a graphically programmed software in Labview which would be having a capability of simulation and control of electrical quantities related to energy consumption as well as energy distribution. With the graphical system design we can get the real time data from the energy meters of each and every customer. Considering the losses in the distribution of electricity from substation to the customers, the ratio value of power output from substation to the total power consumed by every customer is set in the Labview program. An error signal is generated if there is energy theft or load consumption more than the sanctioned load.
In this way we can implement this system, in which the overall cost is comparatively less. And we can have the smarter way of energy consumption monitoring, billing and controlling.