Figure 1. A Typical QRA Methodology
The Chemical Process Industries (CPI) contribute significantly in Indian economy. The growing importance of environment concerns is forcing CPI to use the state-of-the-art technology which increases the complexity of the process. The diversity in the products manufactured by CPI has made it more and more common for these industries to use reactors, conduits and storage vessels in which hazardous substances are handled at extreme conditions. Accidents in such units are caused either by material failure (such as crack in the storage vessels), operational mistakes (such as raising the pressures temperature/flow-rate beyond critical limits), or external perturbation (such as damage caused by a projectile) which can have serious-often catastrophic-consequences. The accidental release of the inventory results in toxic release, fires and explosions. Quantitative Risk Assessment (QRA) is utilised as a tool to evaluate the risk posed to the society from the process and storage facilities. In the present paper, the status of quantitative risk assessments in chemical process industries has been described.
Chemical Process Industries (CPI) plays very vital role in our day-to-day life by providing the Chemicals and their products which have become a part of our life. The growing importance of environment concerns is forcing CPI to use the state-of-the-art technology which increases the complexity of the process. In process indsutry there are several processing plants and inventory. If there is any accident then it would result in toxic vapour release/fires/explosions depending on the material properties. The growth in the number of industrial areas and in the number of industries contained in each of the areas give rise to increasing probabilities of 'chain of accidents' or cascading/domino effects wherein an accident in one industry may cause another accident in a neighboring industry which in turn may trigger another accident and so on.
In order to prevent-or at least reduce the frequency of occurrence of such accidents, major efforts are needed towards raising the level of safety, hazard management and emergency preparedness. This realization and the increased public awareness towards this issue, has prompted the authorities to develop tools and techniques for carrying out risk assessment of CPIs. There are various guidelines available in the literature (CCPS, 2000) on how to perform QRA.
The concept of Risk and Risk assessment is not a new art. It has been practiced by the insurance markets for at least two centuries as a commercial activity. But long before industrialization, man was familiar with taking and accepting risk. In the context of chemical accident prevention, preparedness and response, codes and standards are the foundations of risk assessment and risk control. Risk has been defined in various ways by different authors.
IChemE defined it as 'a function of probability (or frequency) and consequence – sometimes termed 'expected loss.’
The Royal Society, London described it as 'the probability of undesired consequences.’
AIChE/(CCPS, 2000) coined it as 'a measure of human injury, environmental damage, or economic loss in terms of both the incident likelihood and the magnitude of the loss or injury.’
The risk assessment process, regardless of the method or techniques used includes the following components:
An inherent property of a substance, agent, source of energy or situation having the potential to cause undesirable consequences (e.g., properties that can cause adverse effects or damage to health, the environment or property).
Systematic investigation of the possible hazards associated with an installation, particularly identification of the hazards of the chemical(s) that can cause injury or death to people or damage to property by the release of the chemical or by the release of energy in the event of an accident.
Determination of the different situations that can occur and lead to harm, including estimation of the probable quantity, concentrations, transport, and fate of the hazardous substance(s) or energy released in each specified situation, as determined in part by the environmental conditions at the time of the event.
An estimate of the number of times a specified phenomenon (event) occurs within a specified interval.
A calculation or estimate of the nature and extent of the damage caused by all specified hazardous events, including the influence of environmental factors and the probability of exposure of individuals, populations or ecosystems.
Integrates the previous components into an estimation of the combination of the event frequencies and consequences probabilities of the hazardous events specified (for each event and the sum of all events),
Evaluation of the significance of the risk estimation and each of the components of the risk assessment process, including elements of risk perception and cost/benefit considerations.
The components of the risk assessment process defined above lead to a definition of risk assessment - a value judgment that combines the results of risk characterisation and the estimate of the significance of the risk.
The concept of QRA, which has emerged in recent years with ever-increasing importance being attached to it, deals with the following key aspects of accidents in CPIs (Khan and Abbasi, 1998):
a) It helps in setting of industries and management of sites so as to minimize the damage if accident do occur;
b) It provides feedback for other exercises in accident forecasting and disaster management.
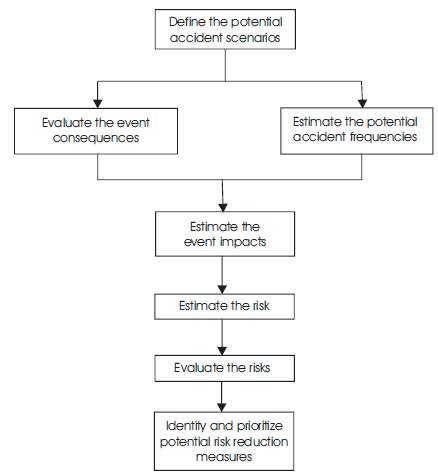
The risk is defined in QRA as a function of probability or frequency and consequence of a particular accident scenario:
Risk = F(s, c, f)
where
s = hypothetical scenario,
c = estimated consequence(s),
f = estimated frequency
The typical QRA methodology is given in Figure 1.
Figure 1. A Typical QRA Methodology
Arendt (1990) discussed growing concern about the risk of major chemical accidents. He pointed out that as a new process technologies were developed and deployed, less of the historical experience base remained pertinent to safety assurance giving example of space industry and novel processes in CPI. Focus was on differentiating it from other methods which were deterministic where as QRA for CPI was mainly probabilistic in nature. Further there was a discussion on risk management and risk perspective. A number of misconceptions relating to data acquisition, accuracy etc., were discussed. It was concluded that Quantitative Risk Assessment was an important tool for the CPI and when used judiciously, the advantages of QRA outweighed the associated problems and costs.
Pietersen et al. (1992) presented a brief overview of risk assessment methodologies, focusing on safety in design and the different methods that can be combined for a full QRA. The results of a QRA were normally presented as individual risk and group or societal risk. The calculated individual risks were often presented in the form of an Individual Risk Graph (IRG) or Individual Risk Contours (IRC). The authors calculated the IRGs and IRCs for an example accident scenario: a release of ammonia at 2 kg/s for 1800s, during different types of meteorological conditions. The example clearly illustrated the development of graphs and curves. Finally, it was concluded that a QRA (inclusive risk contour mapping) can be a useful tool, for example in land use planning. However, for the safety of a chemical plant, other methods for risk assessment were also available, and are indispensable.
Tweeddale (1992) retrieved the importance of the 'Rapid ranking' that had been used for several years as a method of determining the priority that should be given to formal investigation of the wide range of hazards and risks present on major process industry sites. They discussed some historical, recent applications and the nature of the developments which they resulted in. Particular topics discussed include: development of the method such that it can be used by operating managers rather than specialists; use to raise risk consciousness; adaptation for use as an aid to hazard identification; use to define which risks should be studied and which risks, even if low, should be incorporated in routine monitoring and periodic auditing programmes; use as a basis for comparison of the relative risks presented by a variety of different industrial installations; use for a range of different types of risk: and extension beyond ranking to include 'shortlisting' i.e., deciding which risks to include in a study programme and which to leave out. Philosophical difficulties including the danger of omitting a risk, from detailed study, which was erroneously shown as low and the uncertainty of the absolute level of the ranked risks and the approaches to minimize these problems were discussed.
(Khan and Abbasi, 1998): presented a state-of-the-art review of the available techniques and methodologies for carrying out risk analysis in CPI like checklists, HAZOP, FTA, FMEA and Hazard Indices. They also presented a set of methodologies developed by them to conduct risk analysis effectively and optimally like optHAZOP, PROFAT, HAZDIG etc.
(Khan and Abbasi, 1999): discussed briefly some of the major accidents in CPI which occurred during 1926–1997. They analysed the case studies with a view to understand the damage potential of various types of accidents, and the common causes or errors which had led to these disasters. An analysis of different types of accidental events such as fire, explosion and toxic release had also been done to assess the damage potential of such events. They stressed the greatest risk of damage posed by VCE. Throughout their study they highlighted the need for risk assessment in CPI.
Ditali et.al. (2000) presented the prototype of the computer code, Atlantide, developed to assess the consequences associated with accidental events that can occur in LPG storage/transferring installations. The characteristic of Atlantide was simple enough and at the same time adequate to cope with consequence analysis as required by Italian legislation in fulfilling the Seveso Directive. The models and correlations implemented in the code were relevant to flashing liquid releases, heavy gas dispersion and other typical phenomena such as BLEVE/Fireball. The computer code allows, on the basis of the operating/design characteristics, the study of the relevant accidental events from the evaluation of the release rate (liquid, gaseous and two-phase) in the unit involved to the analysis of the subsequent evaporation and dispersion, up to the assessment of the final phenomena of fire and explosion.
Mercx et.al, (2000) discussed the various models available for the vapour cloud explosion blast modeling. They presented the fundamental objections in applying the TNT Equivalency method for vapour cloud explosion blast modelling. They also discussed the other types of models which do not have the fundamental objections like TNO Multi-Energy method that is increasingly accepted as a more reasonable alternative to be used as a simple and practical method. Computer codes based on Computational Fluid Dynamics (CFD) like AutoReaGas, developed by TNO and Century Dynamics, could be used in case a more rigorous analysis was required. They stressed that a CFD approach, in which the actual situation is modelled, supplies case-specific results. An overview of the key aspects relevant to the application of the Multi-Energy method and CFD modeling were also provided and demonstrated with an example problem involving the calculation of the explosion blast load on a structure at some distance from the explosion in an offshore platform complex.
(Khan and Abbasi, 2001): discussed a different methodology i.e., Optimum Risk Analysis (ORA). They had gone ahead and applied it on a chemical plant sulfolane manufacturing unit and enumerated the advantages of this technique. ORA aimed to identify and assess hazards and to estimate the risk factors due to any mishap/accident in the chemical process industry. The ORA framework enabled modelling of probable accidents based on the chemical and process characteristics, evaluation of mode of occurrence of these accidents, estimation of detailed consequences and finally prediction of risk factors. ORA had normal steps like risk identification, ranking, estimation and assessment however the way these are done were little bit modified. After assessing the risks to sulfolane unit under consideration the authors made a number of suggestions like instead of one or two large-capacity vessels, several vessels of smaller capacity should be used for storage. Adequate space should be kept between the storage vessels and buffers provided between them so that adverse consequences of failure in one of them do not cause second or higher order. A thorough emergency preparedness strategy should always be kept in position, fortified by periodic drills or 'dry runs' so that the damage is contained in case an accident occurs. According to authors the methodology optimal risk analysis is swift, less expensive to implement, less time-consuming, and is as (or possibly more) accurate and precise, as existing methodologies.
Melchers and Feutrill (2001) stated that Quantified Risk Analysis (QRA) was used for the revision of regulatory separation distances associated with medium size Liquefied Petroleum Gas (LPG) refuelling facilities used in automotive service (gas) stations. The facility consisted of a 7.5 kl pressure vessel, pump, pipework, dispensing equipment and safety equipment. Multi-tank installations were relatively uncommon. They described the hazard scenarios considered, the risk analysis procedure and the selection and application of data for initiating events and for rates of failure of mechanical components and of the pressure vessel. Human errors and intervention possibilities were also considered. Because of the inapplicability of established consequence models and the relatively small scale of the facilities, a number of tests were performed to estimate flame length, flame impingement effects, ignition probabilities and the effectiveness of screening devices.
Alonso et al. (2006) recalled the importance of TNO Multi- Energy model in calculating the overpressure and impulse from accidental industrial explosions. From the curves given by this model, data was fitted to obtain equations showing the relationship between overpressure, impulse and distance. These equations, referred herein as characteristic curves, can be fitted by means of power equations, which depend on explosion energy and charge strength. Characteristic curves allowed the user to determine overpressure and impulse at each distance.
Beerens et.al. (2006) once again reiterated the importance of QRA in CPI and, in some countries, also in land-use planning. In QRA calculations the frequency of an accident scenario was most often assessed by a generic failure frequency approach. For this purpose, there was a strong need for failure data that were actual, reliable and generally accepted. They showed the difficulty of tracing back failure data due to the lack of univocal terminology. To obtain validated failure data they initiated a study based on recent data and a faulttree- based model with algorithms and modification factors. This initiative ultimately led to failure data that could be easily applied in current-day practice and gives opportunity to obtain appropriate data for non-standard applications. Furthermore, the possibility of how these generic data could be revised and updated was presented.
Chang and Lin (2006) reviewed 242 accidents of storage tanks that occurred in industrial facilities over the last 40 years. They applied Fishbone Diagram to analyze the causes that lead to accidents. The authors also provided corrective actions to help operating engineers handling similar situations in the future. The results show that 74% of accidents occurred in petroleum refineries, oil terminals or storage. Fire and explosion account for 85% of the accidents. There were 80 accidents (33%) caused by lightning and 72 (30%) caused by human errors including poor operations and maintenance. Other causes were equipment failure, sabotage, crack and rupture, leak and line rupture, static electricity, open flames etc. Most of those accidents would have been avoided if basic engineering principles were practiced.
Early (2006) discussed the recent implementation of a database management system at a chemical plant and chronicles the improvements accomplished through the introduction of a customized system. According to review while programming techniques still remain a bit complex and cumbersome, they do allow practitioners familiar with the workflow to model using software. This was a major change from the historical systems where the software designer had no knowledge of the workflow requirements.
Moosemiller (2006) described the use of failure rate data also emphasizes the need to be careful in interpretation. He stated that as companies move progressively toward quantifying the risks of releases of hazardous materials, there becomes a greater need for developing the data necessary to populate the risk analysis. Sophisticated mathematical models have been developed to predict the consequences of a hazardous material release. But the effort devoted to the frequency side of the “risk equation” has been much disorganized by comparison, with inconsistent or non-existent definitions of “failure”, mixing of incompatible data, application of data from one industry to a completely different industry, and a host of other problems. Nonetheless, through judicious assembly and analysis of a variety of data sources, a useful failure rate database can be developed. Pitfalls in interpreting failure rate data are also illustrated.
Abbasi and Abbasi (2007) presented an overview of the mechanism, the causes, the consequences, and the preventive strategies associated with BLEVEs. The authors reiterated the importance of understanding the BLEVE mechanism as it is the most devastating of accidents likely in CPI. The list of BLEVE incidents that occurred between 1926 and 2004, the theories behind the BLEVE, various formulae available in the literature to calculate the fireball diameter, height of the fireball from the ground and BLEVE preventive measures are also presented.