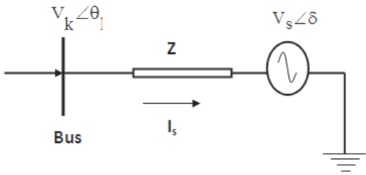
Figure1. STATCOM Equivalent Circuit
The present day power network system is being operated under highly stressed operating condition and is highly complex due to increasing demand in electricity for various sectors such as industrial applications, commercial use and domestic needs. As the load increases, the reactive power also increases abruptly and hence the system becomes unstable which results in poor voltage profile and more power losses of a transmission system. The main goal of this study is to establish a novel method of evaluating power system conditions by installing FACTS (STATCOM, SSSC, and UPFC) devices, which will enhance the voltage profile and minimise network losses. FACTS devices with suitable placement will meet the required reactive power demand and hence active power transfer increases up to their thermal limits so as to minimize the losses and improve the voltage profile of the system. In this paper the effective placement of FACTS devices using HGAPSO technique gives better results in terms of minimization of power losses and enhancement of voltage stability. The proposed technique is implemented in a MATLAB environment and tested for IEEE 14 test system.
The demand for electrical power has recently increased due to increasing economic activity and changing lifestyles. However, with the increasing demand for electricity, the generating stations' capacities are not upgraded. Hence, the practical solution to meet the electric power demand is to utilize the generated power as maximum as possible without loss ( Kundur, 1994).
In the recent past, advanced power controlled devices have been built in the field of power electronics to control and enhance the power transmission as much as possible up to their thermal limits without adding to the cost or operational complexity in the power system, and hence the power transmission system with the above power controlled devices is referred to as Flexible AC Transmission Systems (FACTS) ( Flatabo et al., 1990).
Among various FACTS devices, the Unified Power Flow Controller (UPFC) is one of the versatile and effective power control and reactive power compensating device. Heuristic optimization techniques such as genetic algorithm (GA) and particle swarm optimization (PSO) are powerful techniques to solve the complex and nonlinear problems within a short time. However, hybrid optimization methods such as HGAPSO (hybrid genetic algorithm and particle swarm optimization) have recently been implemented to achieve better accuracy and reduce computational time.
In this research paper, HGAPSO optimization method has been used for optimal location of different FACTS such as STATCOM (Static Synchronous Compensator), SSSC (Static Synchronous Series Compensator) and UPFC (Unified Power Flow Control) to minimize the power losses and enhance the voltage profile in a power transmission system. This paper discusses the N-R power flow modelling of STATCOM, SSSC, and UPFC, as well as the HGAPSO heuristic technique for optimally locating the various FACTS devices with a single line diagram of the IEEE-14 bus test system.
Many researchers focused on the location of compensating devices as well as their sizes, and the successful positioning of multiple FACTS devices in the power system. Many researchers have introduced load flow studies and modelling of compensating devices such as SVC, TCSC, SSSC, STATCOM, and UPFC for analysis of complex power systems. The majority of power engineers used the trial and error approach when installing FACTS devices in the beginning. In the past, the most effective branch or buses could be calculated by using mathematical equations derived from voltage profiles and branch components ( Hingorani & Gyugyi, 2000).
Voltage magnitude, transformer toppings, and capacitor bank reactive power are among the control variables taken into account by the optimization algorithm. This complex optimization problem is solved using a binarycoded GA with tournament selection, two point crossover, and bit-wise mutation. Voltage stability level of the system is defined based on the L-index of load buses. The optimal locations of the VAR sources are also identified by using the GA based algorithm ( Abido, 2002).
The inclusion of losses from optimal power flow as an objective function of the PSO will give the optimum solution such as fuel cost minimization, voltage profile improvement and stability enhancement ( Chiang, 2005).
An algorithm for optimal placement of FACTS devices in power system planning using combination of PSO and GA is given by Durairaj and Fox (2008).
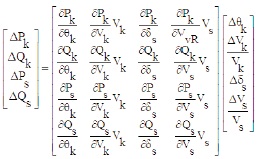
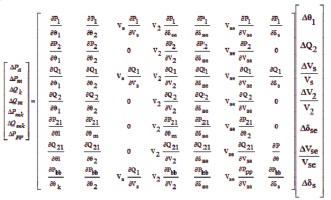
A Static Synchronous Compensator (STATCOM) is a power controlling device used on AC transmission networks. The STATCOM can act as either a source or sink of reactive AC power to AC transmission networks and it is constructed based on the voltage-source converter. Sometimes, a STATCOM is used to support electricity networks which have a poor power factor or poor voltage regulation ( Rao, 2019). In general, STATCOM is used to control the transmission voltage by reactive power shunt compensation. Figure 1 shows the STATCOM equivalent circuit and based on the STATCOM equivalent circuit, i.e. VSC in series with the coupling transformer connected to bus 'k', the active and reactive power equations, after performing some complex operations are as given in Equation (1) ( Acha et al., 2004; Gotham & Heydt, 1998; Hingorani, 1993, 1995; Hingorani & Gyugyi, 2000).
Figure1. STATCOM Equivalent Circuit
A static synchronous generator operated without an external electrical energy source is called SSSC and the aim of SSSC is to increase or decrease the overall reactive voltage drop throughout the transmission line and thus control the transmitted electric power by injecting series voltage which can be regulated and the SSSC is connected between buses 1 and 2. The injected voltage source is denoted by Vse, and Zse is the combined impedance of the SSSC and the line. This allows one to monitor the power flow of the line or the voltage of the respective buses 1 and 2 by regulating Vse, as shown in Figure 2, and the linearised model of the SSSC is given in Equation (2) ( Song & Johns, 1999; Zhang, 2003; Zhang et al., 2006).
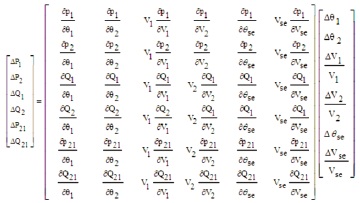
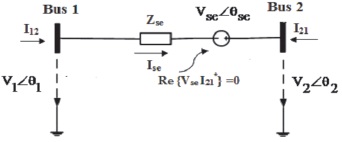
Figure 2. SSSC Equivalent Circuit
A unified power flow manner or coordination manner in UPFC is a combination of separate shunt and series voltage source converter operation. In general, the variable reactive current has been injected by the shunt at the point of connection and the variable reactive voltage in series with the transmission line has been injected by the series controllers.
Shunt and series compensators, such as UPFC, controls real and reactive power flow, as well as enhance the voltage profile at their terminals. Figure 3 depicts a power flow UPFC equivalent circuit.
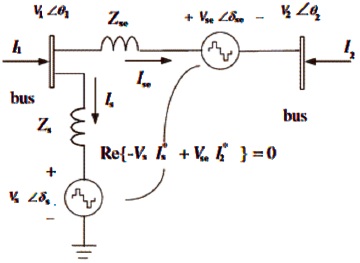
Figure 3. UPFC Equivalent Circuit
The UPFC series controller is connected to buses 1 and 2, and the shunt controller is connected to bus 1. The injected voltage source is represented as Vse∠δse and Zse is the combined impedance of UPFC series controller and the line and the injected current source is represented as Vs∠δs and Zs and the linearized model of UPFC is given in Equation (3) ( Fuerte-Esquivel et al., 2000a, 2000b; Nabavi-Niaki & Iravani, 1996; Povh, 2000; Zhang et al., 2004).
HGAPSO technique is used for placement of different FACTS (STATCOM, SSSC and UPFC) devices after determining the NR power flow modeling equations.
In this section, HGAPSO optimization method is discussed to optimally identify the location of above FACTS devices implemented in a MATLAB environment to reduce the power (active and reactive) transmission losses and enhance the voltage profile of the system more significantly ( Bansal, 2005; Engelbrecht, 2007; Fuerte- Esquivel & Acha, 1997; Lee & El-Sharkawi, 2008).
FACTS device placement using PSO and GA basically experiences some problems to achieve optimality. Since GA performs selection, crossover, and mutation operations at any generation for optimality, using GA to locate FACTS devices in an IEEE-14 bus test system results in slower convergence. Optimal placement of FACTS devices using PSO results in premature convergence due to low dissimilarity because all the particles converge at the same search space.
The above mentioned issues in GA and PSO heuristic methods are modified to achieve higher convergence speed, and an efficient search technique called HGAPSO. This hybrid technique is developed by combining features of GA and PSO algorithms, and this technique has been implemented in a MATLAB environment. As a result of this approach, we can achieve high diversity while reducing computational cost and time ( Sharma et al., 2004).
Step 1: Define the power losses minimization as the objective function.
Step 2: Initialize the number of particles and the maximum number of iterations to achieve the objective.
Step 3: Run the NR power flow analysis IEEE 14 bus systems in a MATLAB environment for the defined random values.
Step 4: Randomly initialize the direction and velocity (the size and location of FACTS) of each particle and calculate the fitness of each particle (i.e., Pbest and Gbest) stored.
Step 5: The crossover and mutation are performed and then the direction and velocity of each and every particles are found with Equation (4) and Equation (5).
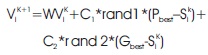
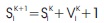
where, Vik =velocity of agent i at Kth iteration, ViK+1 = velocity of agent i at (K+1)th iteration, W=the iteration weight, C1 =C2 = acceleration constants (0 to 4), Sik = current position of agent at Kth iteration, Sik+1 = current position of agent at (K+1)th iteration, Pbest = Pbest agent i, Gbest = Gbest of the group, Wmax =maximum iteration weight, Wmin = minimum iteration weight, rand1=rand2=random numbers (0 to 1).
Step 6: If the number of iterations are equal to the maximum iterations, then show losses and determine the best position and size of FACTS in relation to the objective function (Gbest is chosen from the Pbest), and then stop the programme; otherwise, proceed to the next step.
Step 7: If the iteration is less than the maximum iteration, update the direction and velocity, as well as the iteration incrimination, and run the load flow for optimum FACTS locations and sizing; otherwise, proceed to the next step.
Step 8: If the losses are equal to the previous losses, proceed to Step 3; if not, the minimum losses location and sizing of FACTS are identified among all particles (Gbest is chosen from among the Pbest), then proceed to the next step.
Step 9: Continue until the maximum number of iterations is reached; otherwise, continue to Step 5.
Figure 4 shows the single line diagram of IEEE 14 bus test system and it consists of twenty transmission lines, five generator buses and there are nine load buses. The test system data and results are presented on 100 MVA and usually the reference bus number is taken as 1.
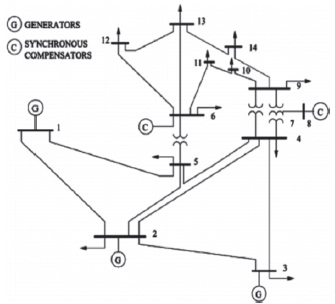
Figure 4. IEEE14 Bus System Single Line Diagram
The effect of optimal position and sizing of STATCOM, SSSC, and UPFC devices using HGAPSO heuristic method is discussed in this section. FACTS devices would have a significant impact on the reactive power flow through the cables, changing the voltage profile and further reducing losses.
Table 1 shows the position and size of various FACTS devices, as well as the minimum voltage profile, and maximum voltage profile for active power losses, and reactive power losses with and without various FACTS devices using the HGAPSO method. Since the lines 14 and 18, which are directly connected to the 11th bus, are affected more than other lines, the necessary reactive power compensation is reached to enhance the voltage profile after placing STATCOM at the 11th bus position, which is far away from all the generating stations. As a result, after placing STATCOM at the 11th bus location, the required reactive power compensation is reached to enhance the voltage profile and power losses reduction are less important.
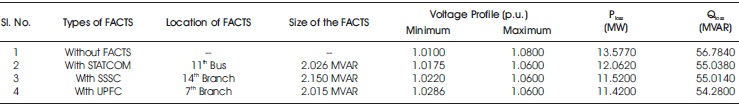
Table 1. Comparative Analyses of Real and Reactive Power Losses without FACTS and with FACTS on IEEE 14 Bus System by using HGASO Method
Active power losses are reduced by 11.16 percent after using HGAPSO to enable STACOM, while reactive power losses are only reduced by 3.08 percent. Figures 5 and 6 display the increase in voltage profile, and reduction in power losses before and after STATCOM placement, respectively.
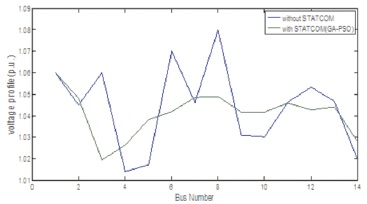
Figure 5. Voltage Profile Before and After Placement of STATCOM by using HGAPSO Heuristic Method for IEEE 14 Bus System
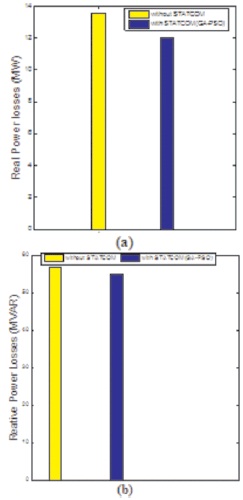
Figure 6. Total Real Power Losses and Reactive Power Losses Before and After Placement of STATCOM by using HGAPSO Heuristic Methods for IEEE 14 Bus System
The SSSC series FACTS system is best placed using HGAPSO on the 14th branch, which is between the 11th and 6th buses and affects more transmission lines than STATCOM. Since the SSSC-connected bus is close to all of the generation stations, as well as lines 8, 14, 15, 16, and 18, which are directly connected to the 14th branch, it has a greater impact than the other lines that are only indirectly connected.
Hence by placing SSSC using HGAPSO, the active power losses are reduced by 16.34 percent and reactive power losses are reduced by 3.12 percent as shown in Table 1. Hence, the power losses reduction by using SSSC is better than STATCOM device.
The voltage profile improvement and power losses reduction before and after placement of SSSC is shown in Figure 7 and Figure 8 respectively.
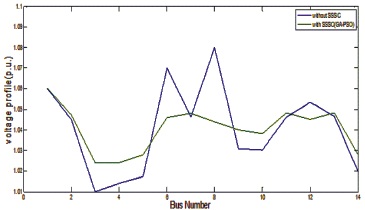
Figure 7. Voltage Profile Before and After Placement of SSSC by Using HGAPSO Heuristic Method for IEEE 14 Bus System
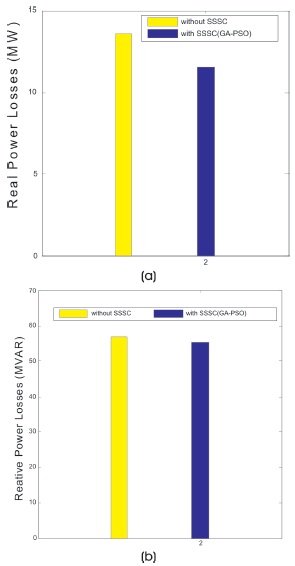
Figure 8. Total Real Power Losses and Reactive Power Losses Before and After Placement of SSSC by using HGAPSO Heuristic Methods for IEEE 14 Bus System
The voltage profile improvement and power losses reduction before and after placement of UPFC is shown in Figure 9 and Figure 10 respectively.
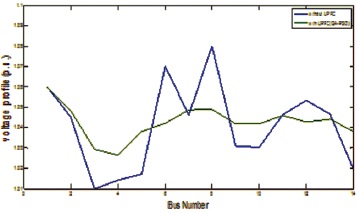
Figure 9.Voltage Profile Before and After Placement of UPFC by using HGAPSO Heuristic Method for IEEE 14 Bus System
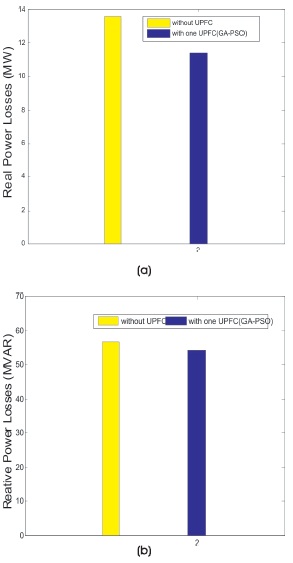
Figure 10. Total Real Power Losses and Reactive Power Losses Before and After Placement of UPFC by using HGAPSO Heuristic Methods for IEEE 14 Bus System
As shown in Table 1, the best place for the UPFC FACTS device is on the 7th branch, which is located between 4th and 5th buses and is in equal distance from all generating stations. It is also close to all generating stations, resulting in greater reactive power compensation through STATCOM and SSSC FACTS devices. The lines 3, 4, 5, 6, 7, 8 and 11 are directly connected to the 7th branch, is highly influenced than the other lines, which are indirectly connected. Hence with the above advantages, the active power losses are reduced by 17.06 percent and reactive power losses are reduced by 4.41 percent using HGAPSO method. Hence by using UPFC device, the power losses reduction and voltage profile enhancement is more significant than STATCOM and SSSC devices as given in Table 1.
This research paper concludes that UPFC FACTS device placement using HGAPSO technique simulated in the MATLAB environment for IEEE-14 bus test system provides better voltage profile and more significant reduction of power (active and reactive) transmission losses than STATCOM and SSSC optimal placements using HGAPSO technique due to superior functional characteristics and more advantages.