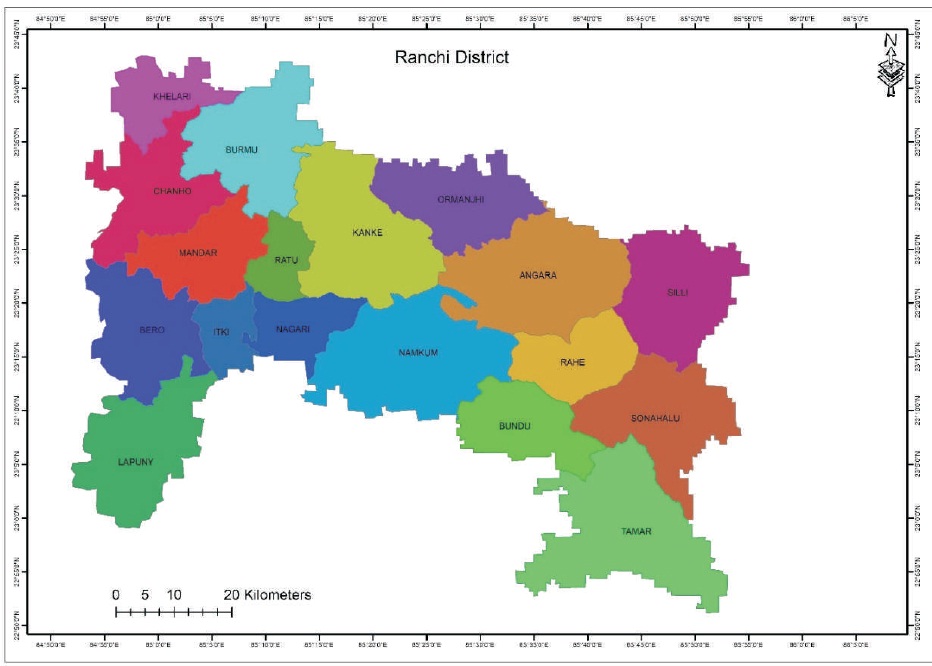
Figure 1. Map of Study Area
Erosion is a physical and chemical breakdown of rock that occur due to weathering phenomenon. This study aimed to estimate soil loss in Ranchi district using Revised Universal Soil Loss Equation (RUSLE) model with integrated approach of Geo informatics. RUSLE model uses rainfall and runoff, soil erodibility, slope length, slope steepness, cover and management factor and support practice factor. These factors can be generated using remote sensing satellite data, rainfall product and soil map provided by NBSS and LUP. By using RUSLE model it is observed that soil erosion of Ranchi district is between 2 – 30 tons/hec/yr. Major soil erosion is in Burmu, Angara, Tamar, Bundu, Namkum block of Ranchi district. Maximum area lies between 2 – 5 tons/hec/yr erosion.
Soil erosion can be explained as the movement and the transport of soil by some agents namely water, wind, glaciers, etc., which causes the detachment, transport, redistribution and deposition of sediments (Lal, 2003). In broader classification the process of erosion can be classified in two process the slow geologic erosion and the accelerated erosion process. The former has resulted in the formation of enormous region of fertile soil of alluvial flood plains and the later resulted to be destructive process, which makes the soil deprived of fertility (Lal, 2003). Soil erosion is the outcome of the interaction between rainfall and soil. The rainfall becomes an erosive agent and the soil acts as a medium that gets detached and transported (Nanna 1996). These processes are majorly determined by locational factors including climate, soil, vegetation, man-made soil conservation measures and topography (Petter, 1992; Morgan, 1995; Hudson, 1995; Nanna, 1996; Mkhonta, 2000). In India erosion has been estimated that about 5334 m-tonne of soil is being detached (Sahu, Baghel, Sinha, Ahmad, & Verma, 2017). The estimation of soil loss can be done using various models. These models can be used to represent real world phenomenon of soil erosion (Aronof, 1989). These models are implemented upon the mathematical equations, the result can differ from model prediction (Nanna, 1996) that is why no model can be called “best”. Mainly there are four categories of model, which are empirical, or statistical, conceptual, physical based model (Merritt, Letcher, & Jakeman, 2003; Roo, 1993). Empirical or Statistical Model is the simplest of all, based on the analysis of observation from the data (Wheater, Jakeman, & Beven, 1993) and generally based on the assumptions of stationarity (Merritt et al., 2003). Conceptual Model provides indication of the effect (qualitative and quantitative) of land use changes, typically represents the catchment as a series of internal storage (Merritt et al., 2003) and includes a general description of catchment process without including specific details of process interaction, which requires detailed catchment information (Sorooshian, 1991). Physical-based Model requires the fundamental knowledge of erosional process and incorporates the law of conservation of mass and energy (Benett, 1974; Petter, 1992). The parameters used in physical-based model are measurable and known (Merritt et al., 2003). Stochastic and Deterministic Model uses the random variable having distribution and probability, if all variables are free from random variation model is regarded as deterministic (Roo, 1993). The presented study is concluded on the basis of one of the empirical model, Revised Universal Soil Loss Equation (RUSLE) model, a modification of Universal Soil Loss Equation model, which is one of the widely used model (Yazidhi, 2003).
Renard, Foster, Weesies, McCool, and Yoder, 1997 United States Department of Agriculture developed a field scale model in 1960s, which was called the Universal Soil Loss Equation. This model was later called Revised Universal Soil Loss Equation, after some modification was incorporated in the existing model in 1997. The USLE model has been widely applied at the watershed scale based on the lumped approach to catchment scale. The RUSLE model is now better in estimating the values of various parameters by incorporating improvements in the factors. Some of the improvement includes numerous improvements, such as monthly factors, incorporation of the influence of profile convexity/concavity using segmentation of irregular slopes, and improved empirical equations for the computation of LS factor.
Since soil erosion is a spatial phenomenon, geoinformatics plays crucial role in modelling of soil erosion (Yazidhi, 2003), but the fact cannot be ignored that the quality of the result is highly dependent on the quality of data used (Svorin, 2003). The Geographic Information System (GIS) environment gives us the ability to link the remote sensing data with its spatial location as land use / land cover (Mkhonta, 2000). The use of digital elevation models and GIS offers great possibilities to estimate more précised topographical parameters (Yazidhi, 2003). The GIS environment provide spatial input data to the model, while the RUSLE can be used to estimate the soil erosion. Earlier studies revealed that RS and GIS techniques are of great use in characterization and prioritization of watershed for soil erosion (Sahu et al., 2017; Tirkey, Pandey, & Nathawat, 2013).
The main aim of present study is to integrate RUSLE model with remote sensing and GIS techniques for assessing the erosion risk in Ranchi District.
Ranchi district lies in the southern part of Jharkhand state. The district has total area of 5097 km2 and is located between 22° 52'- 23° 45' North latitude to 84° 45'- 85° 50' East longitude. The district is divided into 18 administrative blocks shown in Figure 1.
Figure 1. Map of Study Area
The advantage of is RUSLE that the parameters of this model can be easily integrated with GIS for better analysis. The present study was started with delineation of Ranchi District from Survey of India (SOI) toposheet of 1:50,000 scale using ArcGIS 10.5 software. The prepared base map was then used for the extraction of study area from satellite image (Landsat 8, OLI) and ASTER (digital elevation model obtained by ASTER Satellite) as shown in Figure 2 and details of data used were shown in Table 1.
A= R*K*LS *C*P
Where, A is the average annual soil loss per unit area
R is the rainfall and runoff factor
K is the soil erodibility factor
L is the slope length factor
S is the slope steepness factor
C is the cover and management factor
P is the support practice factor.
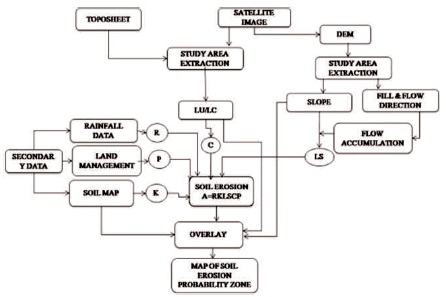
Figure 2. Methodology flow Chart (Ganasri and Ramesh, 2016; Tirkey et al., 2013)
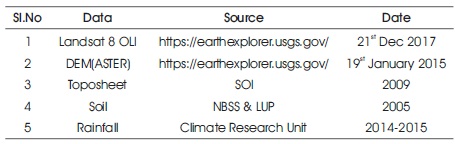
Table 1. Data Used
It represents the susceptibility of soil or surface material to erosion, transportability of the sediment, and the amount and rate of run-off given by a particular rainfall input as measured under a standard condition as shown in Table 2 and K- factor map of Ranchi district is shown in Figure 3.
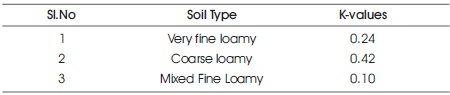
Table 2. Value of Soil Type Prevalent in the Ranchi District (Ganasri and Ramesh, 2016; Tirkey et al., 2013)
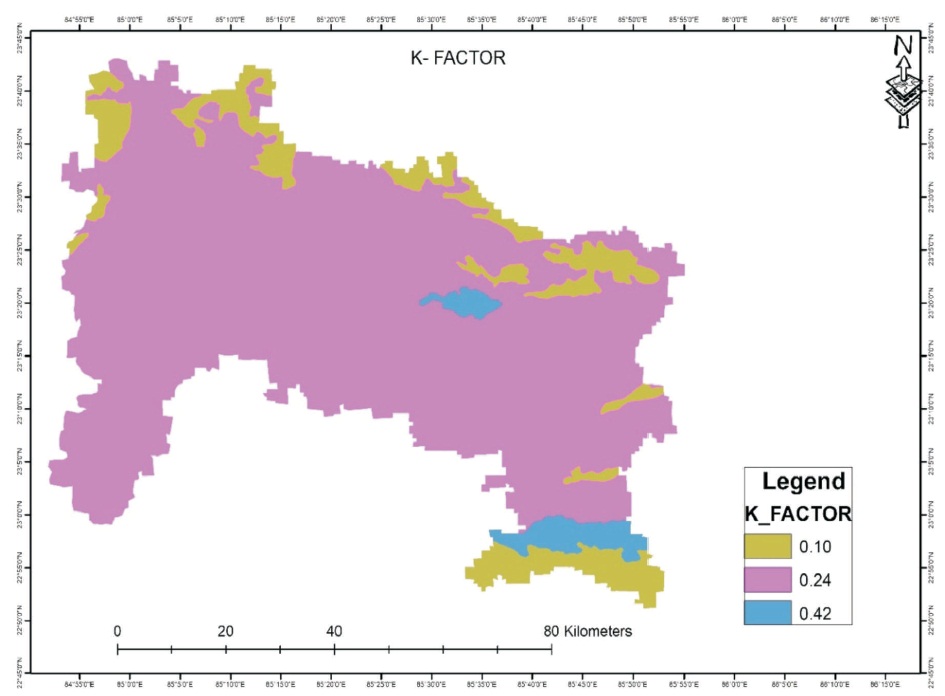
Figure 3. K- factor Map of Ranchi District
The C-factors are the most important values for crop management. The vegetation canopy and ground vegetation cover reduces soil erosion in forested regions (Renard et al., 1997) varies with season and crop production system. The C- factor map as shown in Figure 4 was prepared on the basis of land use-land cover map of Ranchi district. The C- factor values are shown in Table 3. The land use- land cover of the Ranchi District was classified with seven land use-land cover classes, namely, water body, forest area, built-up land, wasteland, agriculture land, Shrub land based on the ground information. These are the major land use-land cover features found in Ranchi District. Landsat-8 image was processed for extracting these six land use-land cover classes using supervised classification method. The supervised classification method is the method which requires ground truth information for each land use-land cover category was collected using Google earth and trained the algorithm to extract these seven land use-land cover.
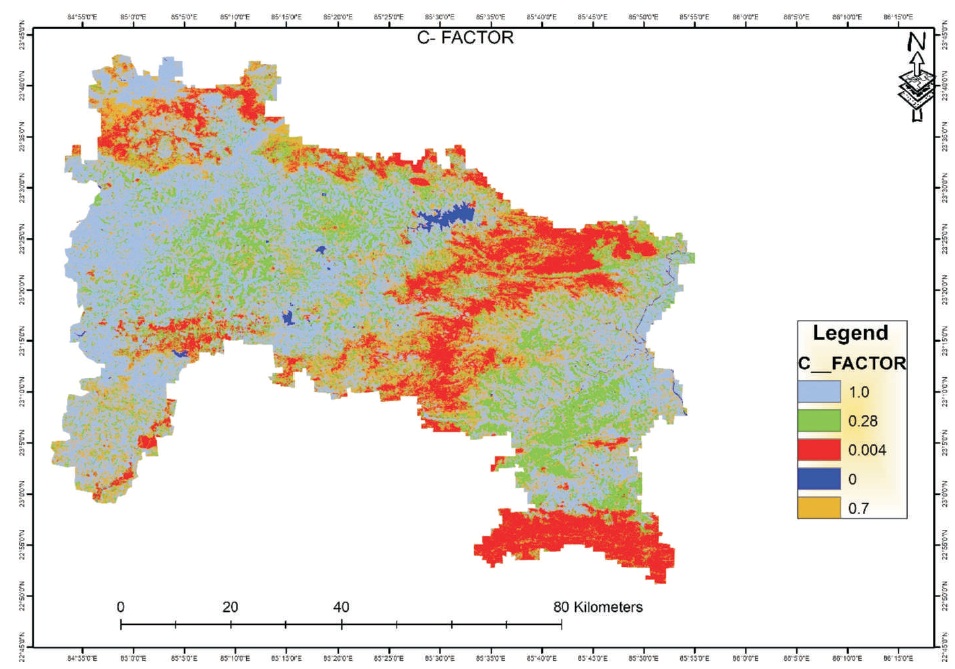
Figure 4. C- Factor Map of Ranchi District
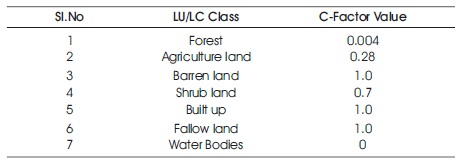
Table 3. C-Factor Value (Ganasri & Ramesh, 2016; Tirkey et al. 2013)
It is the ratio of soil loss with a specific support practice to the corresponding loss with up slope and down slope cultivation. Value of P factor is between 0 to 1 which varies between good to poor conservation practices as in Table 4 and P-factor map as shown in Figure 5. Since there is a lack of field data regarding the conservation practices that have been taken place in the Ranchi District (Ganasri & Ramesh, 2016).
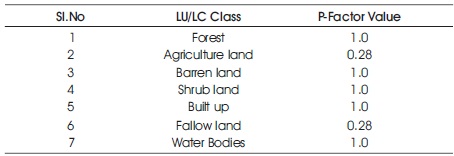
Table 4. P- Factor Value (Tirkey et al. 2013)
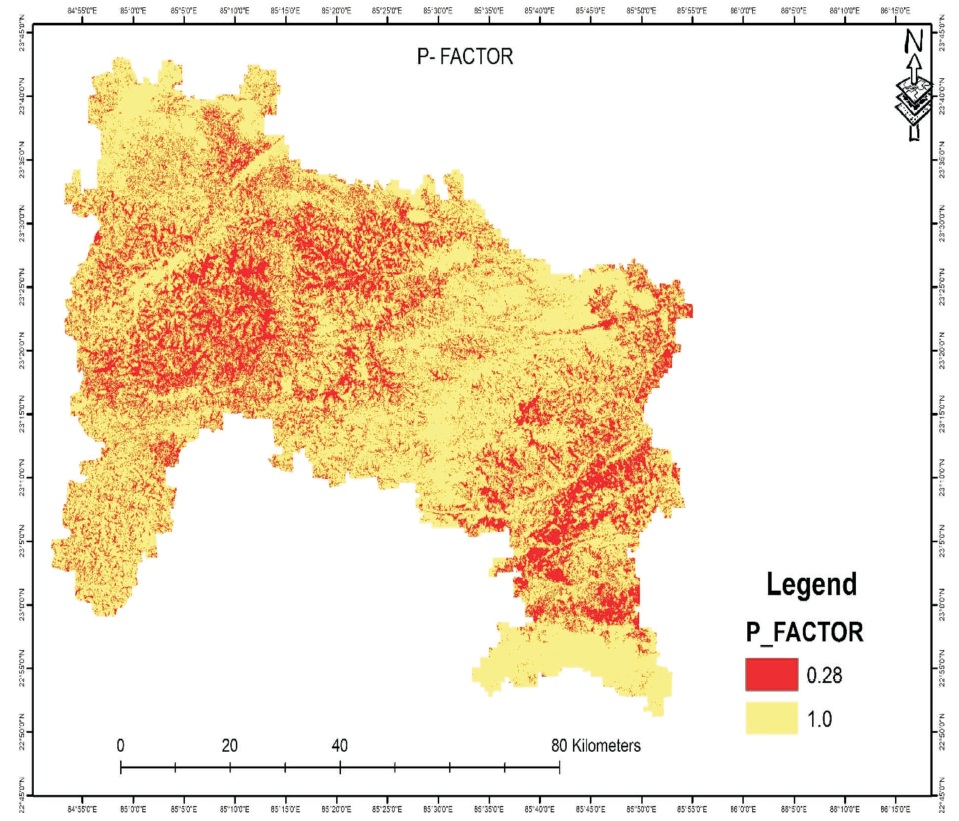
Figure 5. P- Factor map of Ranchi District
The topographic factor represents a ratio of soil loss under given condition to that at a site with the “standard” slope steepness of study area. Slope steepness (S) represents the effect of slope steepness on erosion. The effects of slope have a higher impact on soil loss than slope length. Higher the slope, more is the erosion (Ganasri & Ramesh, 2016). The worst erosion occurring between 80 and 89% slope. Therefore, the topographic factor is calculated using the equation given below:
LS = ([Flow Accumulation] *Cell Size/22.13)0.6 (Sin ([Slope of DEM] * 0.01745) /0.0896)1.3 * 1.4]
The rainfall erosivity factor (R)reflects the effect of rainfall intensity on soil erosion, and requires detailed, continuous precipitation data for its calculation. R indicate the two most important characteristics of a storm determining its erosivity with respect to amount of rainfall and peak intensity sustained over an extended period. Equation used is,
R = 81.5 + 0.375 * r (340 ≤ r ≤ 3500 mm)
Where, r = Mean annual rainfall in mm.
The R- factor was found to be 126.897 MJ mm ha-1h-1 and its map was generated in GIS.
The maximum soil loss in the Burmu, Angara, Tamar, rd Bundu, Namkum block was found to occur near the 3rd and 2nd order streams where the presence of weathered material is more. Because of the steep slope of this area (30˚-35˚) the soil gets detached easily at the time of rainfall and gets transported with the runoff leading to excessive soil erosion in this region. It is also observed that large portions of plain area (having a slope up to 15˚) also contribute to the soil loss of the watershed exhibiting annual average soil erosion upto 8-15 tons' ha-1yr-1 and some parts having 4-8 tons' ha-1yr-1, this is observed particularly in those places where there is 1st and 2nd order stream channels. Drainage density also effects the soil erosion and Ranchi district have more drainage density. Total soil erosion were further divided into 5 different classes as shown in Table 5. Highest erosivity area were 2252.46 sq.km under class of moderate erosion that is, 2 – 5 tons/hec/yr followed by 1455.43 sq.km in class of severe erosion that is, 15 – 30 tons/hec/yr. Least area were observed in slight erosion class that is, 488.93 sq.km.
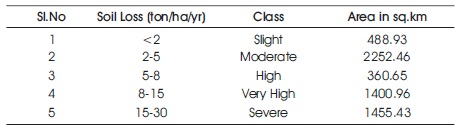
Table 5. Soil Loss
RUSLE empirical soil erosion models, are physically easily interpretable, require minimal resources and can also be worked out with readily available inputs to precise the areas exposed to high erosion risk. This paper explains about the application of empirical soil erosion model to estimate soil erosion potential and the potential zones in Ranchi District. It reviles that soil erosion varies from 0 to 30 tons/hec, whereas maximum area is covered with the variation of soil erosion of 0 – 5 tons/hec as shown in Figure 6.
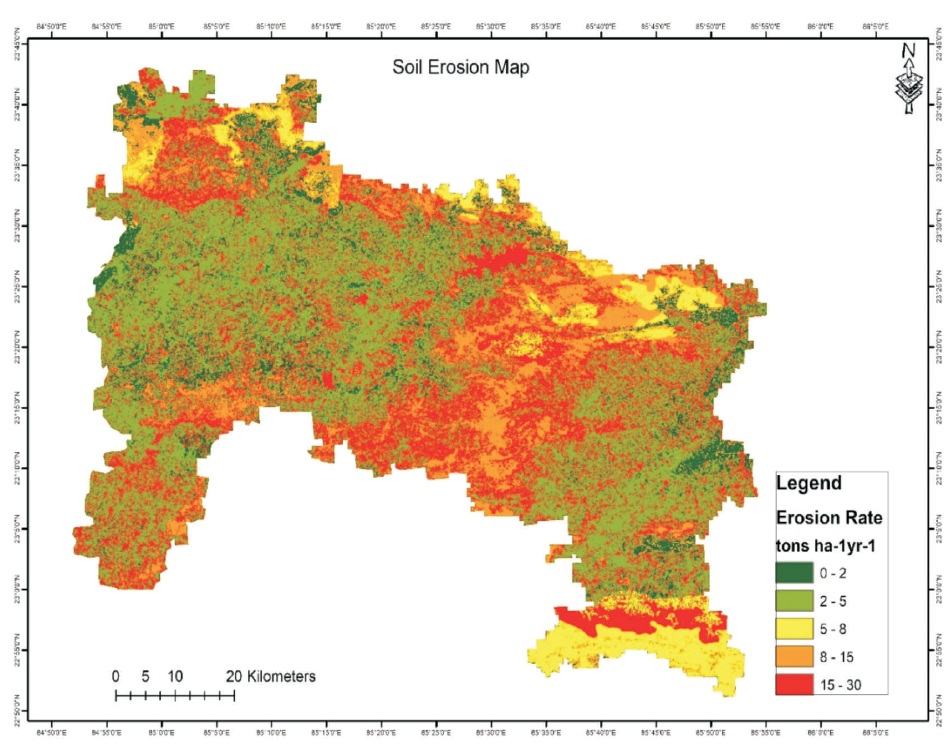
Figure 6. Soil Erosion/ Loss map