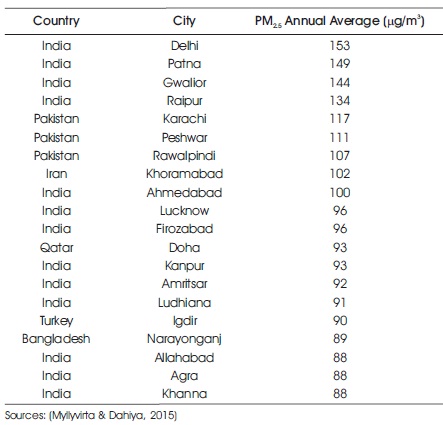
Table 1. India's 13 Most Polluted Cities in World
In modern years, numerous occurrences of air pollution proceedings in India have periodically caused terror and an important issue of discussion by pollution specialists of government and non-government organization or institutes. It may cause both long and short-term impacts on the environment and human health. Therefore, Canadian Environmental division proposed a new term, Air Quality Health Index (AQHI) to measure the air quality status, based on health effects. In the present study, Noamundi mining area has been considered to study the Air Quality Health status as it is an active mines area. The PM10 (Particulate Matter), PM2.5, SO2 (Sulphur Dioxide), and NOx (Nitrogen Oxides) have been used as main air pollutants for the analysis. Normally, the results of AQHI varied in between 1 to 10, but it may be rarely higher above 10 through critical or very high pollution episodes like smoke. The higher pollution is observed at western to south-western part of the study area (Average: 6-10). Somewhere in south-western part of the study area, it needs the limit of critical pollution level (above 10). The north-western, North-eastern part of the study area reflects the low level of health risk (within 3) and south-eastern part of the study area registered the moderate level (health risk 6). From the Exceedence Factor (EF) analysis, it is concluded that the PM2.5 and PM10 are the main reasons for higher health risk at south-western part as it falls in the core zone of the mining.
Air pollution is the responsible and serious issue of India (Environmental Performance Index, 2018). As per the results of the Environmental Performance Index (EPI) of 2018, India was ranked 177th (Score: 30.57 out of 100), with issues mainly in urban, semi-urban Industry, mining sectors, etc. According to the World Health Organization (WHO) report, the 13 cities of India fall within 20 most polluted cities of the world (Table 1). Based on information and report it shows that the Delhi, Patna, and Gwalior are the most polluted cities in the world. The major sources of pollutants are vehicles emission, fuel wood burning, biomass burning, and industries, etc. Although from these segments, there are 20% of Industrial emissions, while 10% emission is from cooking-biomass, etc. According to Air Pollution Act (1981), air pollution occurs while an amount of harmful substances or pollutants (solid, liquid, or gaseous substance) entered into the pure or farce air (Air Pollution). Air is the source of Oxygen (O2) for breathing and life.
Table 1. India's 13 Most Polluted Cities in World
Now-a-day's urbanization, industrialization, and other developmental activities may add other elements to the pure air and pollute it. The awareness of air pollution is much more significant for humans, primarily for ailing people. The polluted air also effects weather, climate and human health condition, etc. The main elements of air pollutants are PM2.5, PM10, SO2, NO2, Carbon Monoxide (CO), etc. These pollutant elements may affect plants, animals, people, environment, etc., which not only have effects on local or regional, but also on the global scale (Anjaneyulu & Valli, 2007).
The present study area is Noamundi, known as mining town of West Singhbhum district of Jharkhand, which is mainly for Iron ore mines (Panda, Banerjee, Jain, Jeyaseelan & Sharma, 2014; Panda, Jain, & Jeyaseelan 2018). As Noamundi is a mining area, digging, dumping, carrying, blasting, crushing, dust emission, vehicular emission, etc., are associated with this area. These activities have introduced dust or Particulate matter and other pollutant elements into the air. On the other hand, Noamundi is a biodiversity and ecology sensitive area. Therefore, air quality of this area is an important part of environment and human health.
This study focuses on the air quality assessment of Noamundi Iron ore mines and surrounding areas located in Jharkhand. The main objectives of the study are: (1) Identify the significant environmental parameters and assessing the air quality status within the study area, (2) Describe the individual concentration and air quality status, and (3) Predict the air environment scenario based on Air Quality Health Index (AQHI).
Noamundi (State Jharkhand, India) known as mining town of West Singhbhum district is situated about 300 m to 680 m above mean sea level. The geographical location of this deposit is between 22°04'14"N to 22°10'41"N latitude, and 85°27'09"E to 85°30'06"E longitude. The main highlighted geographical location is Noamundi market area and its 6 km buffer areas.
The temperature of the area of Noamundi areas through the period of October - December 2013 ranged since 9.1°C to 26.5°C with the average rainfall of 318 mm and 50 to 90.4% relative humidity. The wind speed of the area ranged from 0 to 10.2 km/h with direction from west and south-west. The average wind speed of the year is 3 km/h to the south and south-east direction. The barometric pressure ranged from 702.6-744.2 mmHg and most of the times sky was clear. The month wise for the last 10 years with the average climatological data of the district by Gua-Noamundi observatory are presented in Table 2.
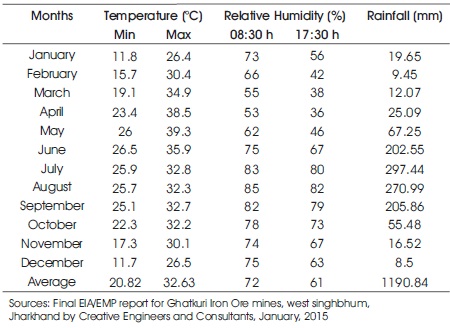
Table 2. Month-wise Average Climatological Data of Gua- Noamundi Observatory West Singhbhum District (last 10 years)
As Noamundi is an active mining area, air quality analysis of the area is an important factor for the area. The main sources of the air quality data are Ministry of Environment, Forest and Climate Change (MoEF & CC), and Jharkhand State Pollution Control Board (JSPCB). The yearly average Air Quality data has been used for this study (Final EIA/EMP report, 2013). There are some air quality standards to maintain and assess the air quality status, whether it is polluted or not. Air quality Standards are the values that describe the highest permissible limit of the concentration. The Standard values differ from nation to nation like NAAQUS (National Ambient Air Quality Standards), WHO (World Health Organization) Standard, etc. Many researchers, specialists, analysts, etc., use NAAQUS to minimize the data required. NAAQUS notified on November 2009 has been used here as it is effective for the small study areas and is shown in Table 3.
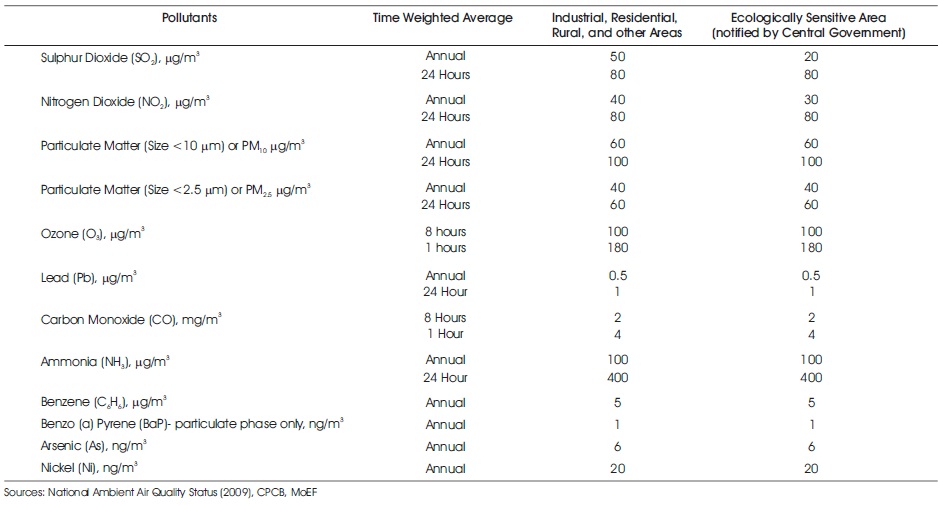
Table 3. Revised National Ambient Air Quality Standards (NAAQS), 2009
In the present study, the PM2.5, PM10, SO2, and NOx has been considered as an air quality parameter. The tiny liquid droplets and solid particles compose the PM, emitted into the air from vehicles, forest fire, waste burning, wood burning, industrial activities, etc., which pollute the air. PM2.5 are the main components of smog generated in the air creating breathing problem, lung disease, or heart problem. Human health problem can also damage vegetation productivity, etc. (Canadian Environmental Sustainability Indicators, 2016). Sulphur dioxides (SO2) is introduced as the group of sulphur containing gases or sulphur oxides (SOx). SO2 is emitted from fuel or sulphur that contains raw material or industrial work (metal ore smelting), etc. The major sources of Sulphur dioxide (SO2) are Iron ore crasser, electricity generation, refining industry, etc. Nitrogen dioxide (NO2) is introduced as the group of nitrogen oxides (NOx). As the monitors do not directly measure the Nitrogen dioxide (NO2), NOx has considered for NO2. This Nitrogen dioxide may create the problem of breathing or lungs and enlarge the weakness for allergens (asthma).
Air Quality Index (AQI) helps to convert the air pollution parameters into a general scale base on the importance of weighted values. There are different type of methods for air quality measurement index, like MAQI (The Mitra Air Quality Index), ORAQI (Oak Ridge Air Quality Index), and Air Quality Health Index (AQHI), etc. The Exceedence Factor (EF) and Air Quality Health Index (AQHI) methods have been used for the current study, based on the NAAQ standards (Table 3). As the air quality is related to life, health, etc., the AQHI method is suitable for decisionmaking.
The Exceedance Factor (EF) is used to know the individual status of individual pollutants. Exceedance Factor (EF) is the ratio between the annual mean concentration of the pollutants and respective standard (equation 1). Using concentrations and corresponding standards value of all locations, the Exceedance Factor for each pollutant and each location has been calculated (National Ambient Air Quality Status, CPCB, 2009).

Further, the Exceedance Factor has been used as a parameter for AQHI. Equal importance has been given to all air pollution elements by multiplying 10 with E factor of each pollutant. In this way, the air quality rating (Q ) of each i pollutant has been calculated. After that the result quality ratings of all parameters are being used for AQHI and is given in equation below.
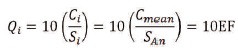
where, EF is Exceedance Factor, Cmean and SAn are the Annual mean concentration and Annual standard of the respective criteria pollutant. Qi, Ci, and Si are the Quality rating, Concentration, and Air quality standard, respectively for ith pollutant and n is the number of pollutants. Accordingly, the air quality ratings for each pollutant are calculated to derive AQHI (Dubey, Pal, & Singh, 2014).
Preliminary analyses are essential to evaluate the individual concentration effects on air quality. An E Factor method has been proposed to analyze the air pollution of individual data, with spatial distribution pattern. It has been categorized into four classes through, Critical pollution (> 1.5), High pollution (1.0 - <1.5), Moderate pollution (0.5 - 1.0), and Low pollution (< 0.5). From Table 4, the High pollution (H) status is observed for PM10 and Critical pollution (C) status is observed for PM2.5 with location ID AQ16 to AQ24. From the observation, all other locations fall in the category of Moderate pollution (M) and Low pollution (L). On the other hand, SO2 and NOX reflect Low pollution (L) status of the area.
As shown in Figure 1, the center to green circle is the low pollution (L) zone, from green to orange are Moderate pollution (H) zone, from orange to red high pollution (M) and after red circle Critical pollution (C) zone, which represent the E factor (EF) gradient threshold. The blue line reflects the individual concentration status of pollutants with corresponding location ID with respect to Figure 2. From the visual exploration, the status and analysis of PM10, PM2.5, SO2, and NOX are shown in Figures 2(a), 2(b), 2(c), and 2(d), respectively. It is concluded that the PM10 and PM2.5 are the unstable conditions while SO2 and NOx are the stable conditions of the area.
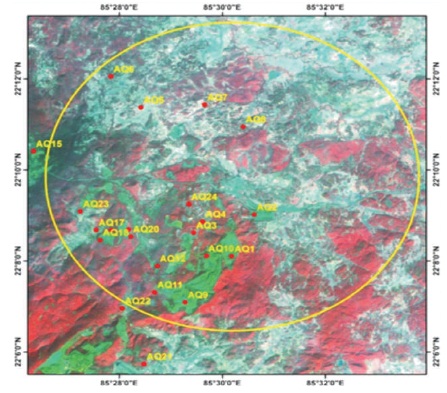
Figure 1. A Synoptic View of the Study Area (Location Map)
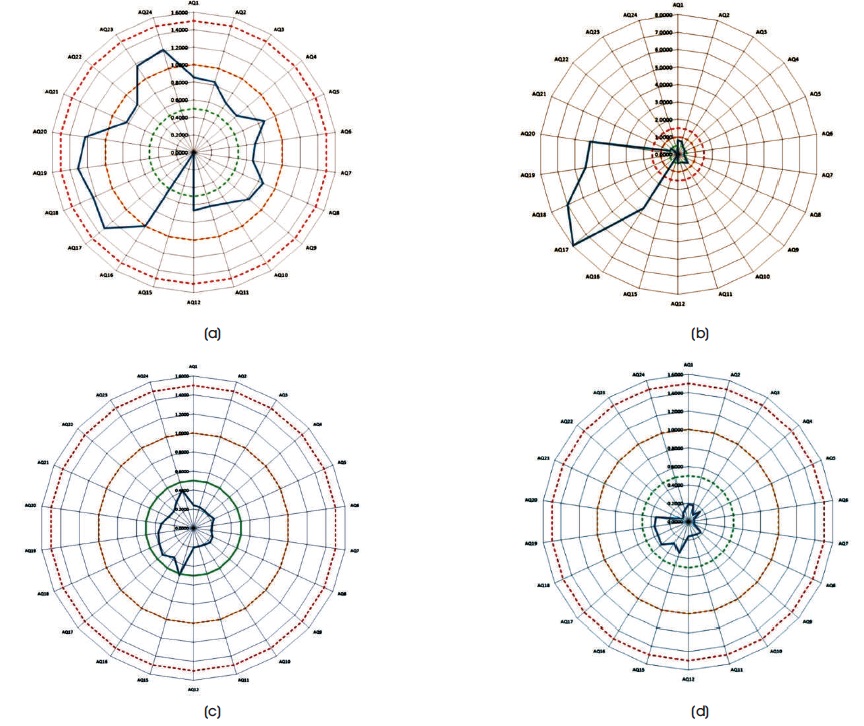
Figure 2. E factor (EF) Threshold and Status of (a) PM10 (b) PM2.5 (c) SO2 (d) NOX
The AQH index has been categorized into four classes as low (1-3), moderate (4-6), high (7-10), and very high level (above 10) of risk. Due to fraction results, it has been modified in continuous scale like 1-3, 3-6, 6-10, and above 10, respectively. From the observation of AQHI with spatial location, the ID AQ16 to AQ20 finds high to very high level of risk zone (Table 5 and Figure 3). The location of the air quality testing point has been depicted with location map in Figure 1. Although the SO2 and NOX have been observed as a low pollutant (from E factor), it falls in a very high level of risk zone due to higher pollution contrition of PM10PM2.5.
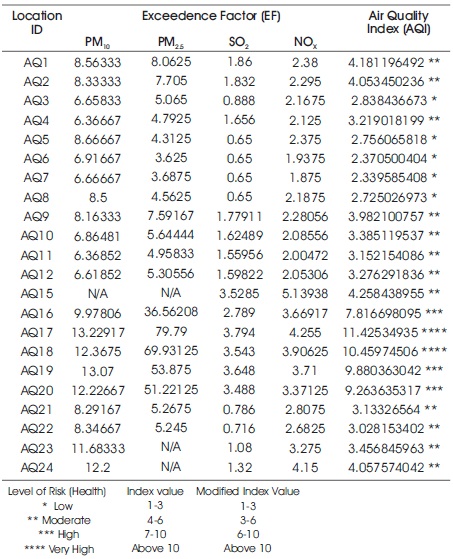
Table 5. Location-wise Air Quality Rating and Index
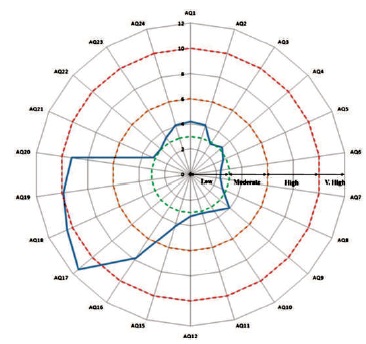
Figure 3. Air Quality Health Status of the Study Area
From the findings observed, the higher pollution statuses are obtained at western to south-western (SW) part of the study area and low level of pollution statuses are observed at north-western, north-eastern part of the study area. However, the south-eastern (SE) part has been registered as a moderate level of health risk. These variations take place because of the presence of active iron ore mines at southern and SW part of the present area like Katamati, Thakurani, Noamundi, etc. Fortunately, the entire southern portion of the study area is covered by forest and canopy. Wind direction has been observed at south and south-east. Maximum habitation can be seen in the eastern and center area of the study area.
Air pollutions that affect health has been a strong issue in recent years. The revelation that air pollutants, such as PM, NOX, and SO2 may introduce with respiratory and lungs problem. These effects may have been measured and exposed by levels of the health risk scale. In the present study, the EF and AQHI have been used for knowing the air quality status of the area. The EF for both PM2.5 and PM10 are significantly higher than the SO2 and NOX value. Higher pollution is observed at western to south-western part of the study area (AQHI scale: more than 6). The lower pollution statuses are observed at NW, NE part of the study area (AQHI scale: 1-3), while a moderate level of health risk is observed in SE part of the study area (AQHI scale: 3- 6). From the analysis, southern portion of the study area is covered by green cover while major habitation distribution can be seen in eastern and center part of the area. Further, the findings obtained in the study may be useful for the study in environmental sustainability.
The authors are grateful to the Ministry of Environment, Forest and Climate Change (MoEF & CC), Ranchi, regional office for providing the Air quality data, which is the most important for this study. Our sincere thanks to Dr. D. Dutta (Scientist / Engineer-SG) and Mr. Y. K. Srivastava (Scientist / Engineer-SF) of NRSC / ISRO for their encouragement and help of our study. The authors would like to express gratitude to all colleagues of MoEF & CC, Ranchi, who have helped at various stages and provided their support for this study. Our thanks are also due to Jharkhand State Pollution Control Board (JSPCB). The authors are grateful to the Govt. of India, for providing amenities and encouragement for research work.