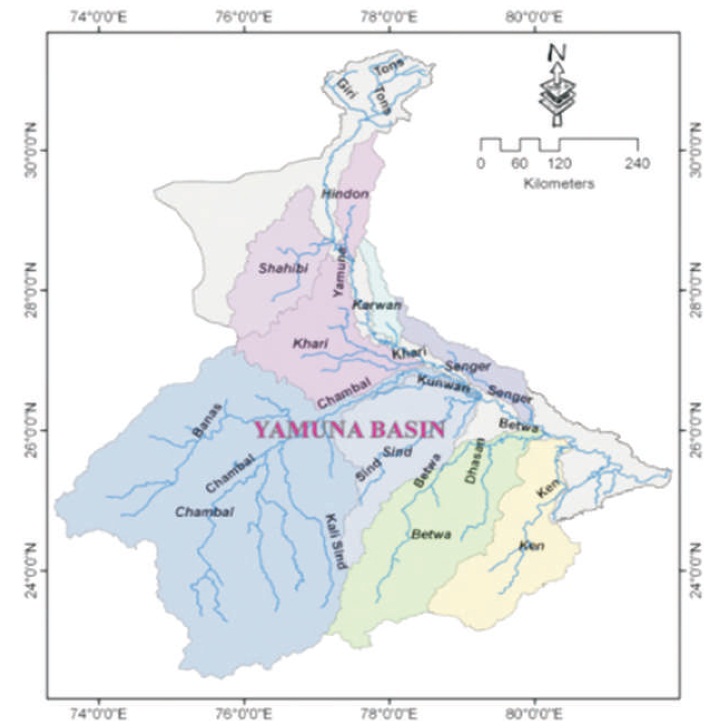
Figure 1. Yamuna River Basin
For a river management, it is necessary to identify the vulnerability and their effects on the morphology of river bed and riverside lands. This study aims to focus on the identification of vulnerable zone with erosion and shifting of the 22 km stretch River Yamuna along Delhi between Wazirabad Barrage and Okhla Barrage. An attempt has been made to use GIS and RS techniques for change detection of river courses for past and present geographical data sources of river courses. Using three dry season satellite images of Landsat MSS (60 m) for 1980 and 1989 and Landsat8 (30 m) for 2017, largely pre and post construction of major barrages and bridges have been considered. The bank line movement rates (m/yr) of the river were analyzed under three periods: 1980-1989, 1989-2017, and 1980-2017. The result indicates that the downstream of Wazirabad barrage and upstream of Okhla barrage have changed significantly due to varying reason of erosion, accretion, and construction activities. Rate of shifting in both the upstream of Okhla barrage and downstream Wazirabad barrage is more in between 1980-1980 as compared to 1989-2017. The rate of shifting between 1980-1989 in downstream of Wazirabad barrage was 3.6 times more between 1989-2017. The rate of shifting between 1980-89 in upstream of Okhla barrage was 3.4 times more between 1989-2017. The most effective factors in morphological changes are the changes in regime because of dam construction, reduction of runoff, and accumulation of sediment loads on the riverbed.
A proper understanding of the ways in which river channels have migrated through time is critical to many geo-morphological and river management problems (Petts, 1995; Milton, Gilvear, & Hooper, 1995). Lateral migration is a positional change of a river channel as a result to variations in fluid flow and sediment discharges and is always associated with bank erosion of the stream bed or channel wall under turbulent flow conditions. Lateral migration is therefore a process that can cause catastrophic local or regional changes (Hickin, 1983). Geomorphologists have obtained information traditionally on channel migration using surveys of cross-sections along the river being studied, supplemented with aerial photographs, and data from topographic maps. These traditional measurement techniques vary in terms of time scale, accuracy, and repeatability (Lawler, 1993), but a common feature to all is that they are localized in extent.
While small-scale studies are useful for developing mechanistic models of changing river channels, fundamental concerns are emerging due to relevance of such small-scale research to understanding larger systems and for larger area studies, a procedure of generalization from discrete patches to integrated wholes is often needed for conventional surveys. Unfortunately, generalization often introduces different degrees of bias and a potential problem of reliability for research results.
Satellite remote sensing offers the possibility of direct perspectives of large areas at scales compatible with river stretches being studied that are relatively free from unintentional bias. It provides a means of monitoring migrating channels by repetitive measurements from space borne systems. Most recently, satellite remote sensing has often been integrated into a Geographic Information System (GIS). The integration of satellite remote sensing with GIS provides an excellent framework for data capture, storage, synthesis, measurement, and analysis, all of which are essential to channel migration investigations. Useful sources of satellite data for river studies are images from Landsat (MSS, TM, ETM, and L-8), SPOT, Radarat, NOAA, IRS, and many light-weighted satellite systems. Higher resolution data are preferable for fluvial applications. Although its spatial resolution is not as fine as that of SPOT HRV data, Landsat data are the sole multi-spectral digital data with synoptic coverage extending back to1972. In addition, these data are inexpensive and can be managed computationally even by a personal computer with a Pentium processor. Therefore, Landsat data have unique value and thus are extensively used for a variety of tasks, notably in natural resource surveys and environmental monitoring. Landsat data are also used in river channel change studies. Salo et al. (1986) and Kaliraj, Chandrasekar, Ramachandran, Srinivas, and Saravanan (2017) have used timesequential MSS images to quantify lateral migration rates of the meandering and anastomosing stretches of the Ucayali and Amazon in Peru. Jacobberger (1988) mapped abandoned river channels that were active 6,000 to 8,000 years ago in the Sahel region of Africa using MSS and TM data. Philip, Gupta, and Bhattacharya (1989) used MSS and TM imagery to quantify the migratory trend of the Ganges River in India. In recent decades, various studies had been conducted on the morphology of major river using remote sensing images, e.g Kummu, Lu, Rasphone, Sarkkula, and Koponen (2008) for the Mekong river; Chu, Sun, Zhai, and Xu (2006) for the Yellow river; Wang and Lu (2010) for lower Yangtze River; Sarkar and Thorne (2006), Sarkar, Haque, and Alam (2003) for a major river system of Bangladesh, and Thorne, Russel, and Alam (1993), Baki and Gan (2012) for Brahamputra-Jamuna River.
These works have demonstrated the promising potential of Landsat data for studying river channel change. In deltaic lowlands, channel migration tends to be complicated by marine processes and intensified human activities.
This study presents an application of Landsat imagery and GIS techniques to the study the channel migration of large Yamuna River along NCR in between Wazirabad and Okhla Barrage system. This is a potential application in river studies.
The Yamuna River is the largest tributary of River Ganges. The hydrological cycle and water resource of the Yamuna basin (Figure 1) are mainly governed by south west monsoon. The climate of the basin varies from semi arid to humid with about 84% of precipitation occurs during the monsoon season (June to September). The total catchment of the Yamuna River is 366223 km2 with water spread area of 20375 km2, which is 42.5% of the total Ganga basin area, and 10.7% of the total geographical landmass of the country. The percentage contribution of the various states to the catchment area of Yamuna River is (http://www.cwc.nic.in): Uttaranchal 1.1%, UP 20.4%, Himanchal Pradesh 1.7%, Haryana 6.1%, Rajasthan 29.7%, Madhya Pradesh 40.6%, and NCT –Delhi 0.4%. The sub-basin tributaries of the Yamuna contribute 70.9% of the catchment and remaining 29.1% account for direct drainage into the Yamuna River through other small tributaries. The source of Yamuna lies in the Yamunotri Glacier at an elevation of 6,387 meters (20,955 ft), on the south western slopes of Banderpooch (38°59' N 78°27' E) peaks, which lie in the Mussoorie range of Lower Himalayas, in the Uttarkashi district, Uttarakhand, north of Haridwar. From here it flows southwards, for about 200 kilometers (120 mi) through the Lower Himalayas and the Shivalik Hills Range. The entire drainage system of the river stretches (Figure 2) all the way between Giri-Sutlej catchment in Himachal and Yamuna-Bhilangna catchment in Garhwal, indeed the southern ridge of Shimla is also drained into this system. The combined stream flows through the Shivalik range of Himachal Pradesh and Uttrakhand and enters into plains at Dak Pathar in Uttarakhand, where the river water is regulated by a weir and is diverted into a canal for power generation (http://www.cwc.nic.in). From Dak Pathar, the Yamuna flows through the Ponta Sahib and reaches Hathikund in Yamuna Nagar district of Haryana. At Hathikund, the river is diverted into Western and Eastern Yamuna canal for irrigation and drinking water supply of Delhi. The catchment of river Yamuna at the Hathikund is 12950 km2 approximately. At this point, the maximum and minimum flow is 7079 m3/s and 70 m3/s (Figures 3 a & b). Only approximately 160 cusecs (4.53 m3/s) is released for ecological consideration, which vanishes after short distance of travel due to loss. Upstream of Hathikund barrage the ratio of Qmax/Qmin (Figure 4) (where Qmax is the flood peak discharge and Qmin is the lowest flow rate in the year) is about 92 (with mean annual maximum and minimum of 5042.8 and 54.5 m3/s based on the data from1994-2008) in comparison to 33 of Indus, 34 of Ganga, and 4 of Amazon. This might be attributed due to the lesser glacier area in the Yamuna catchment (i.e. 125 km2) as compared to the Indus basin (i.e. 14,043 km2). Yamuna river enters Delhi near Palla village after traversing for about 224 km. At Palla, the flow in the river is received by western Yamuna canal for the Delhi water supply at Wazirabad. During the dry period, the flow upstream of the Wazirabad barrage is approximately 10-11 m3/s (Figure 5) and is used as raw water for Wazirabad water works and practically no water is released in the river downstream of the barrage. The Yamuna river flow downstream of the Wazirabad barrage consists largely of untreated or partially treated domestic and industrial wastewater contributed by numerous drains along with the water transported by Haryana Irrigation Department from western Yamuna canal to the Agra canal via Nazafgarh drain and the Yamuna. About 22 km downstream of the Wazirabad barrage, the Yamuna water diverted into the Agra canal for irrigation upstream of the Okhla barrage. Generally, water flows through the barrage during the dry season is minimum with 105 cusecs (2.86 m3/s) being released for ecological consideration.
Figure 1. Yamuna River Basin
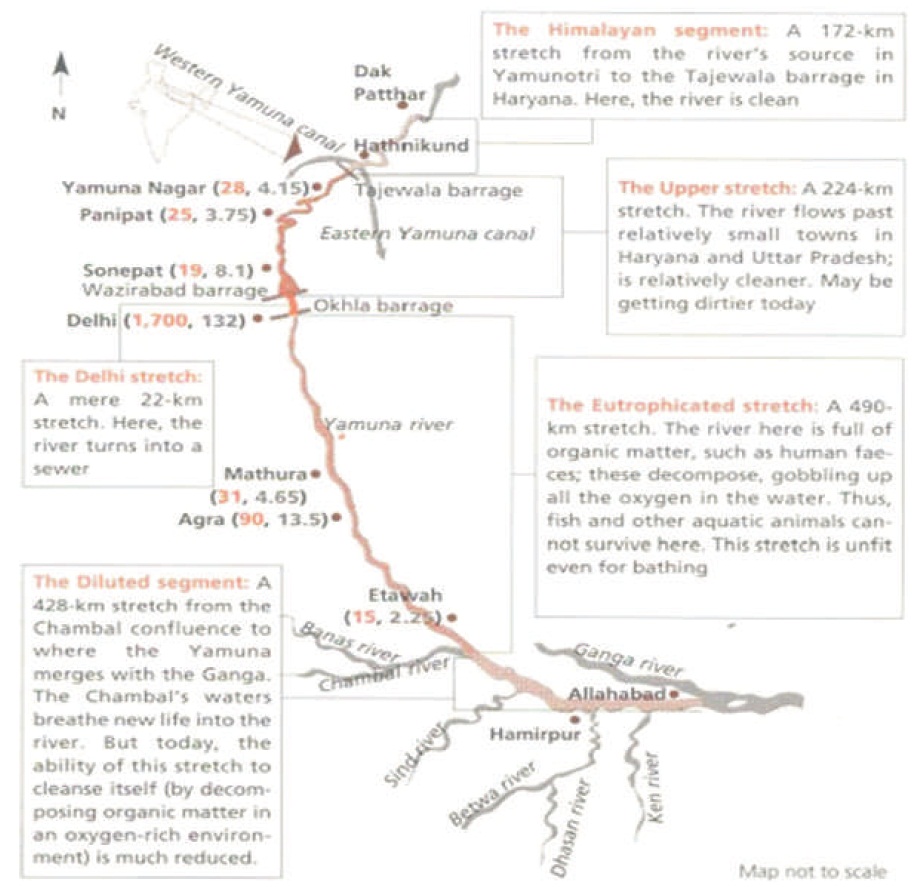
Figure 2. Drainage Segment of River Yamuna
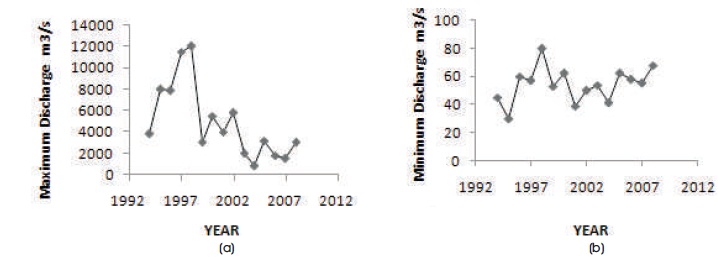
Figure 3(a&b) Annual Maximum and Minimum Discharge u/s of the Hathnikund Barrage (Source: Page 15 – The Yamuna River Basin, Water Resource and Environment, Springer)
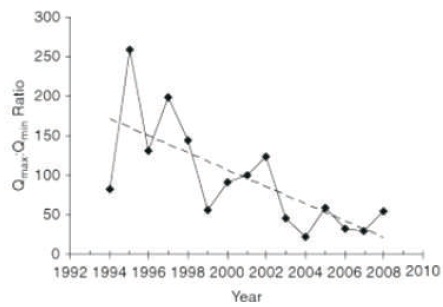
Figure 4. Ratio of Q and Q u/s of the Hathnikund Barrage max min (Source: Page 15 - The Yamuna River Basin, Water Resource and Environment, Springer)
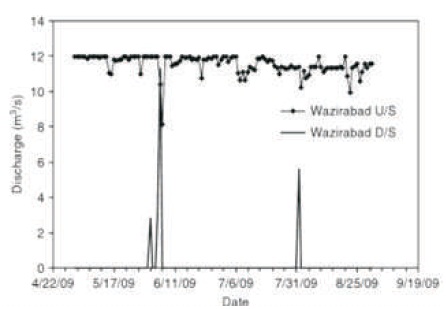
Figure 5. Discharge in the Yamuna River at Wazirabad Barrage (Source: Page 16 - The Yamuna River Basin, Water Resource and Environment, Springer)
The present study (Figure 6) is focused on the urban segment of River Yamuna along the National Capital Territory (NCT) of Delhi. River Yamuna enters NCT of Delhi at a point close to Palla village (28°50'N, 77°12'E) and leaves Delhi 4 km downstream of the Okhla barrage near village Jaitpur (28°31'N, 77°20'E). The 48 km “urban stretch” of River Yamuna constitutes the “Delhi segment” of the river. The first 22 km course of River Yamuna in Delhi is without any major diversions or drains falling into it. The remaining 26 km of River Yamuna has three barrages constructed on it. These are the Wazirabad barrage (28°42'N, 77°13'E), the ITO barrage (28°37'N 77°15'E), and the Okhla barrage (28°32′N, 77°18'E).
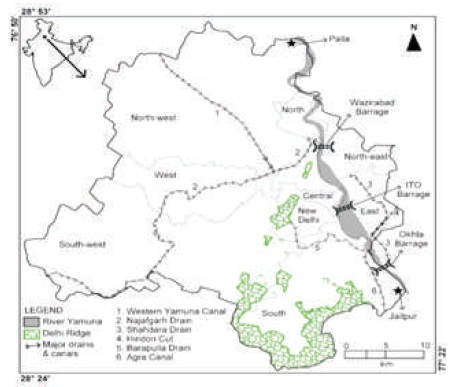
Figure 6. River Yamuna along the National Capital Territory (NCT) of Delhi
Multi temporal Lands at images acquired by optical sensors during dry season (November-March) of the River Yamuna along Delhi was downloaded that are freely available satellite images from https://earthexplorer.usgs. gov/ or https://glovis.usgs.gov/. Only satellite images acquired during the dry season were selected because vegetation cover and other ground conditions are relatively consistent from year to year, which is essential for assessing the inter year change of shifting of Yamuna River. Additionally, during dry season, the chance of getting relatively cloud free atmosphere are higher and plan form generally shows the boundary and pattern of channel within the braided belt clearly. Three Landsat images (1980, 1989 and 2017) (Figure 7) covering the Yamuna river along NCT-Delhi were selected for this study.
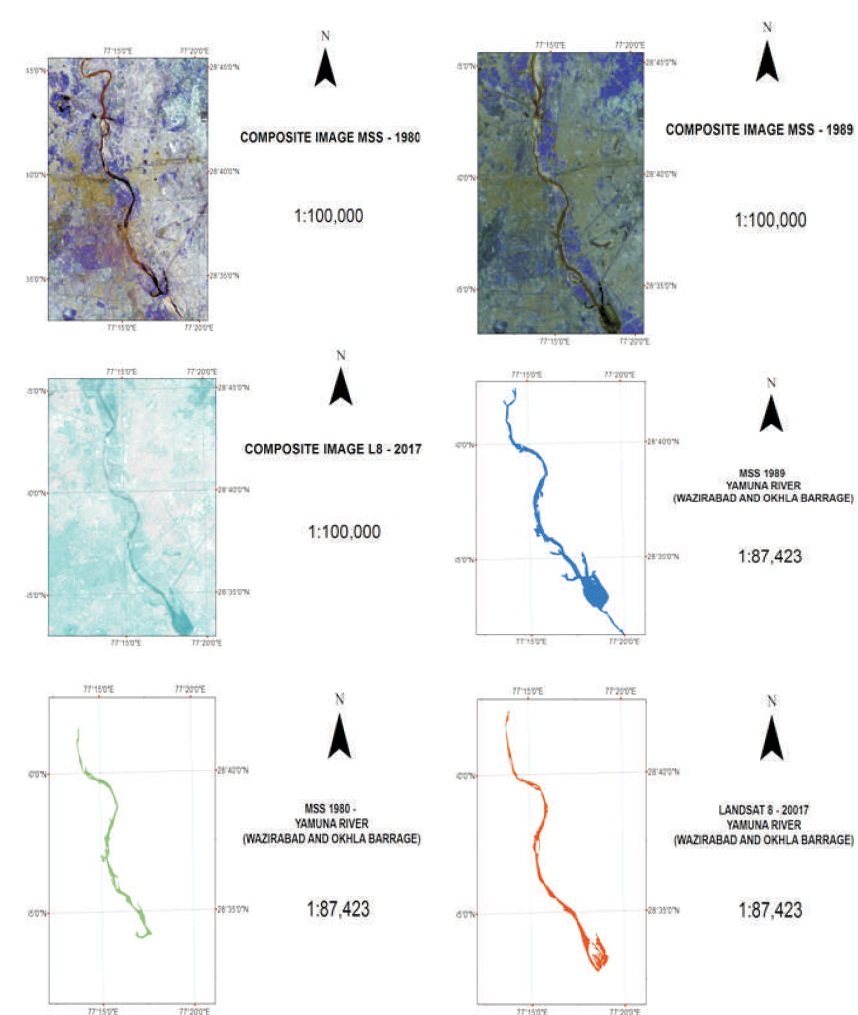
Figure 7. Composite Image and Polygon of MSS & Landsat - 8 (1980, 1989, & 2017)
All satellite images (Table 1) were processed and analyzed by using image analysis and ArcGIS10.4 software. The data collected was rectified and the study area was geo-referenced to WGS1984 with projection system UTM zone 43 Northern hemispheres. The primary task of this study was to delineate bank line and boundary from all geo-referenced images. All selected images were carefully analyzed for bank line and boundary using Arcview10.4. The spatial tool analysis with multivariate cluster classification and reclassification was performed for each satellite images. The classified images were changed into polygon from raster with conversion tool. To quantify changes in river bank location that have been occurred between any two images using ArcView, polygon of different period were overlapped. Usually, the section used to measure the bank line shifting is set to be at 90 ̊to the axis of channel (EGIS, 1997; Baki & Gan, 2012). A similar method was used by Kotoky, Bezbaruah, Baruah, and Sarma (2005); Debnath, Das, Ahmed, Bhowmik, (2017) to estimate the erosion and deposition rates for the upper reach of Brahmaputra river within India. Changes to riverbank line were performed for three time periods, 1980-1989, 1989-2017, and 1980-2017. The total eroded area between any two times periods were calculated by overlying bank lines of two respective years. Band 1, 2, and 3 of MSS, 2,3 and 4 of MSS and Landsat 8 images that gives a color composite of visible-infrared band useful for land/water delineation were used in this study. Changes to the river morphological attributes and identification of major vulnerable erosion and accretion zone were quantified for images of 1980, 1989 and 2017.
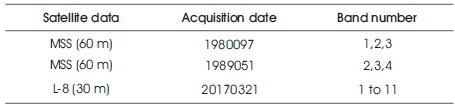
Table 1. Satellite Images used for this Study
Given the resolution of images of Landsat MSS and Landsat 8, the assement of changes of erosion and accretion along the riverbanks are approximate and subject to an order of accuracy comparable to the image resolution. Landsat 8 (30 m resolution) are typically more useful than Landsat-MSS images in mapping homogeneous, near urban land covers, at times they could be less useful in heterogeneous urban area (Haack, Barayant, & Adams,1987; Hossain, Gan, & Baki, 2013). Errors associated with the estimation of bank line changes based on remotely sensed data will partly depend on the spatial resolution of satellite images such that coarser resolution images tend to result in kore errors in estimating the bank line migration of any river system, and vice versa. Other possible source of error include visual deliation of bank line, difference in water level between images and other type systematic or random errors. However, the overall resultant errors should be relatively small compared to the overall, sizeable changes in the river banks of Yamuna River.
Other than the lower Mississipi, Laturbesse (2008) said that all the mega rivers typically with a discharge larger than 17000 m3/s, a high river width/depth ratio frequently exceeding 200, low slope<0.00015, and high bed load have an abranching channel patterns. They don't satisfy the usual discriminators between braiding and meandering (Kleinhans, 2010), possibly because there exist a stable vegetated island that do not seasonally adjust with annual flow variability. Laturbesse (2008) and Eaton, Millar, and Davidson (2010) have proposed theoretical threshold based on power laws, which relate critical slope to discharge and bank strength to discriminate multiple-thread channels that are stable an abranching channel from unstable, braided channels. The former are those that “migrate upon their flood plains via organized predictable arrangement of net erosion and deposition associated with a single set of bars on alternate side of the channel, maintaining statistically similar channel dimension” (Eaton et al., 2010). The result on morphological changes of Yamuna River along NCTDelhi between Wazirabad and Okhla Barrage are discussed below.
The bankline shifting rates due to erosion accretion for the Yamuna River within the reaches of NCT-Delhi between Waizrabad and Okhla barrage for three time intervals between 1980 and 2017 are shown in Table 2 and the rates of bankline shifting with respect to previous years are plotted in Figure 8. The figures show a considerable movement of both bankline resulted from accretion (riverward) as well as erosion (landward) between 1980 to 2017. Two specific zone namely just downstream of Wazirabad barrage (B) and just upstream of New Okhla barrage (A) has been gone under remarkable shift in bankline in order of from 350 m to 550 m at various time scale from 1980 to 2017.
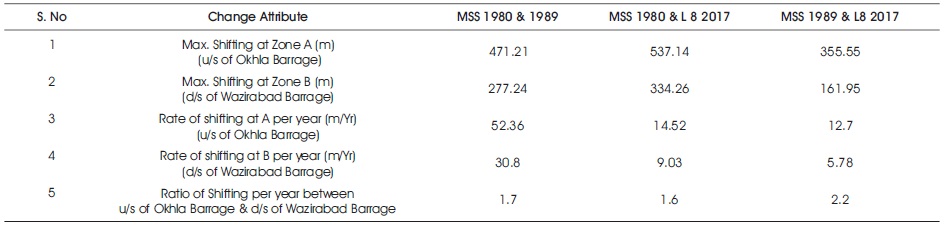
Table 2. Shifting and Rate of Shifting at Major Vulnerable Zone (at u/s of Okhla Barrage-A &d/s of Wazirabad Barrage - B)
Figure 8(a) shows that between 1980 and 1989, the just d/s of Wazirabad barrage and u/s of Okhla has gone under significant shifting of bankline in a localized fashion and remains stable for remaining stretch. A leftward shifting of bankline has been recorded as 471.21 m at u/s of Okhla barrage and 227.24 m d/s of Wazirabad barrage. The rate of shifting at both the localized vicinity of barrages is 52.36 m/yr and 30.8 m/yr. It is evident that the shifting phenomena at lower reach, i.e u/s of Okhla barrage is 70% more than upper reach, i.e d/s of Wazirabad barrage.
Figure 8(b) shows that between 1989 and 2017, the just u/s of Okhla barrage and d/s of Wazirabad has gone under significant shifting of bankline in a localized fashion and remains stable for remaining stretch. A leftward shifting of bankline has been recorded as 355.55 m at d/s of Wazirabad barrage and 161.95 m u/s of Okhla barrage. The rate of shifting at both the localized vicinity of barrages is 12.7 m/yr and 5.78 m/yr. It is evident that the shifting phenomena at lower reach, i.e u/s of Okhla barrage is 120% more than upper reach, i.e d/s of Wazirabad barrage.
Figure 8(c) shows that between 1980 and 2017, the just u/s of Okhla barrage and d/s of Wazirabad Barrage has gone under significant shifting of bankline in a localized fashion and remains stable for remaining stretch. A mixed shifting of bank line at Okhla has been observed and recorded as 537.14 m at u/s of Okhla barrage and 334.26 m d/s of Wazirabad barrage. The rate of shifting at both the localized vicinity of barrages is 14.52 m/yr and 9.03 m/yr. It is evident that the shifting phenomena at lower reach, i.e u/s of Okhla barrage is 60% more than upper reach i.e d/s of Wazirabad barrage.
Figure 8(d) shows that there is a continuous process of erosion and deposition simultaneously over the period of time between 1980, 1989, and 2017.
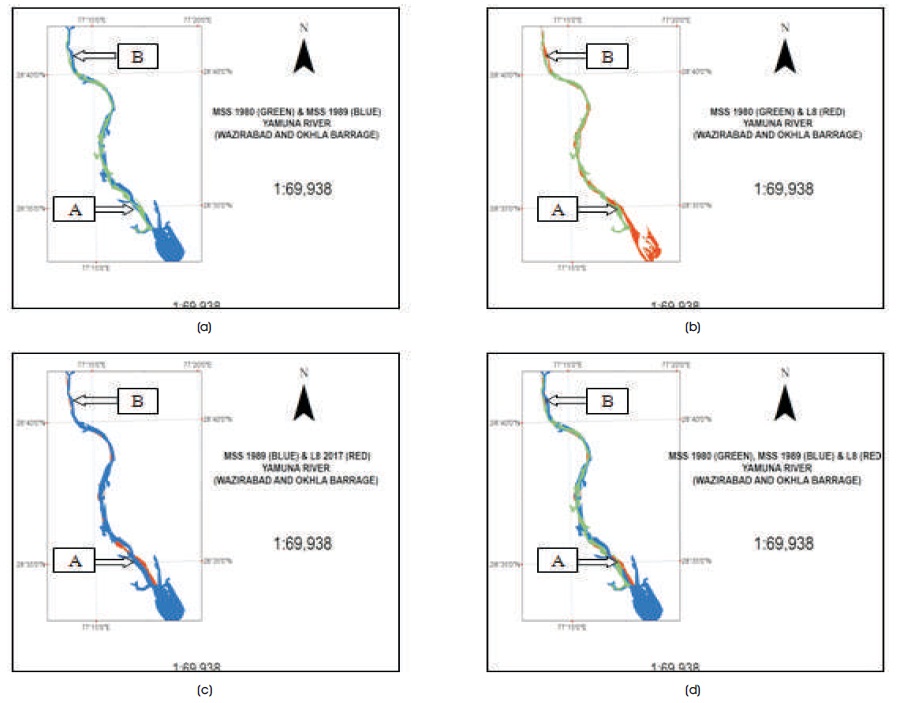
Figure 8(a) MSS 1980 & 1989 (b) MSS 1980 & Landsat 8 ( c) MSS 1989 & Landsat 8 (d) MSS 1980,1989 & Landsat 8
Figure 9(a) shows that there is a difference of magnitude in erosion and deposition for both the u/s of Okhla barrage and d/s of Wazirabad barrage. The shifting of river bank is more prone near Okhla barrage than Wazirabad barrage.
Figure 9(b) shows that the rate of shifting between two identified zone as d/s of Wazirabad and u/s of Okhla barrage for the year between 1980-89, 1989-2018, and 1980-2017. Rate of shifting between 1980-2017 is minimum and between 1989-2017 is maximum.
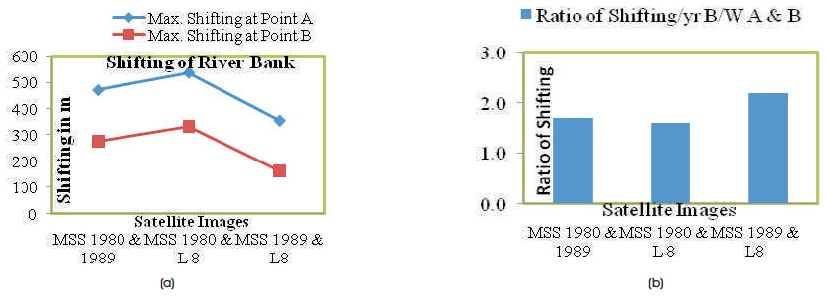
Figure 9(a) Maximum Shifting of Yamuna River at A & B (b) Ratio of Shifting between A & B
In this study, multiple Landsat MSS and Landsat 8 images of 1980, 1989, and 2017 of dry season acquired over the Yamuna River located along NCT-Delhi. During the study period, the river has shifted its bankline by erosion and accretion almost every year to a significant amount. In particular vicinity of Wazirabad and Okhla barrage experienced vast and significant amount of shifting as compared to remaining stretch of river. The shifting between 1980 -89 at localized domain near barrage has 471.21 m at u/s of Okhla and 277.24 m at d/s of Wazirabad at a rate of 52.36 m/yr and 30.8 m/yr, respectively. The shifting between 1989-2017 at localized domain near barrage has 355.55 m at u/s of Okhla and 161.95 m at d/s of Wazirabad at a rate of 12.7 m/yr and 5.78 m/yr, respectively.
The Yamuna River went under two fairly distinct patterns of morphological changes happened in 1980-89 and in 1989-2017. The amount of bank line shifting is more between 1980 – 89 than 1989-2107 as well as the shifting of bankline at u/s of Okhla is more than d/s of Wazirabad. The rate of shifting at u/s of Okhla barrage for a span of 10 year between 1980-89 is 4.12 times higher than rate of shifting for a span of 27 year between 1989-2017. This reflects a massive change in regime of Yamuna River along NCT-Delhi after the construction of major structures over it. This rate of shifting at at d/s of Wazirabad is further aggravated and is 5.33 times higher.
Lastly, the significant shifting rate of Yamuna River is probably due to composition of bankline by highly erodible materials and it has high discharge rate during monsoon season.
This study concludes that use of remote sensing and GIS are potential for the purpose of morphological assessment. Further studies with higher resolution satellite imageries are required to focus with suitable areal and volumetric extent for a more accurate assessment.
We like to extend our deepest gratitude to all personalities and organizations for their immense and unconditional help and suggestions for the preparation of this research paper. Special thanks to the Landsatand Google Earth, for providing necessary information, maps and images.